
Abstract
Keywords
Introduction
Stroke is the third leading cause of disability worldwide and ranks as the second leading cause of death globally, with acute ischemic stroke (AIS) being its most prevalent form. 1 The cornerstone of early AIS management is thrombolytic therapy, particularly through the prompt administration of recombinant tissue plasminogen activator (rt-PA). 2 While thrombolysis is an established effective intervention, it carries inherent risks, notably the risk of hemorrhagic transformation (HT). HT can occur spontaneously in cases of acute ischemic cerebral infarction, with reported incidences ranging widely from 10% to 48%, depending on various risk factors. 3 These hemorrhagic events pose critical concerns due to their potential to exacerbate neurological deficits, increase disability, and in severe cases, lead to mortality.
Given the severe implications of HT, there is a growing emphasis on predicting its occurrence in AIS patients undergoing thrombolysis. Early identification of patients at risk of HT can guide clinical decisions and improve patient outcomes. 4 Management of HT involves careful monitoring and supportive care, including blood pressure control, reversal of anticoagulation, and in some cases, surgical intervention to manage intracerebral hemorrhage. 5 Machine Learning (ML) is emerging as a powerful tool in this context. Known for their predictive capabilities across various medical fields, ML algorithms excel at interpreting complex data patterns, which enables the development of precise, patient-specific prediction models. 6 In the field of AIS and thrombolysis, these models show promise in determining the probability of HT events, thereby offering a new dimension of insight. 7
Amid increasing interest in ML-based predictive models for post-thrombolysis HT, there is a pressing need for a comprehensive synthesis of the existing evidence. 8 A systematic review and meta-analysis of relevant studies can reveal nuances about the overall efficacy, benefits, and limitations of these predictive frameworks. 9 By pooling insights from multiple research initiatives, a clearer understanding of the predictive accuracy inherent in ML algorithms can be achieved. 9 In light of this, our systematic review and meta-analysis aims to meticulously analyze the body of literature on ML-driven prediction models tailored for post-thrombolysis HT in AIS patients. Our goal is to provide clinicians and researchers with profound insights, fostering an understanding of the models’ potential clinical applicability while also highlighting areas needing further research and refinement.
Materials & Methods
This systematic review is anchored in the guidelines delineated by PRISMA 10 and was duly registered on PROSPERO with the ID: CRD42023453818. 11
Eligibility Criteria
Inclusion Criteria: Studies are eligible for inclusion if they meet the following conditions: 1) They focus on patients with AIS where thrombolysis is targeted; 2) They utilize machine learning or deep learning algorithms in predictive models; 3) The predictive models are specifically tailored for patients with AIS who have undergone thrombolytic treatment; 4) The models are based on studies examining HT as a patient outcome.Exclusion Criteria: Studies will be excluded if they: 1) Include endovascular treatments such as thrombectomy or other invasive methods for AIS in the study population; 2) Build models using patient samples that include non-AIS diseases such as hemorrhagic stroke, cerebral venous sinus thrombosis, or cerebral arteritis, in addition to AIS thrombolysis patients; 3) Lack an evaluation of model effectiveness; 4) Studies that include post-thrombolytic treatment data in their predictive modeling variables. For focused analysis, conference abstracts, review manuscripts, open letters, commentary pieces, editorials, and erratum were excluded due to their intrinsic succinctness.
Search Strategies
Under the guidance of experts in evidence-based medicine, we conducted a comprehensive search using the keywords of ischemic stroke, hemorrhage, and artificial intelligence. A detailed overview of our search technique is provided in Supplementary Table S1. We systematically searched quintessential databases: PubMed, Web of Science, Scopus, Embase, and Google Scholar, from their respective inceptions until July 10, 2024. These databases predominantly covered relevant computer science journals and conferences.
Study Selection
Study selection and review were conducted independently by two reviewers, YJ and LL. Initial steps involved eliminating duplicates, comments, conference abstracts, letters, narrative reviews, editorials, and errata. The remaining records underwent a preliminary screening based on titles and abstracts, followed by a comprehensive assessment via full-text reading. Any discrepancies between the primary reviewers were addressed through discussions, and unresolved differences were referred to a third reviewer, FL.
Data Extraction
For the eligible studies, data was independently extracted by two reviewers (YJ and FL) using a predefined form. Extracted details included: author's name, year of publication, demographic characteristics of the study population (age, gender, ethnicity/place of recruitment), sample sizes of the training, testing, and external validation cohorts, included variables (clinical information, laboratory test results, and brain imaging), imaging modalities used for model development, models based on different algorithms, and model validation information. Performance metrics extracted from the included papers included Area Under the Curve (AUC), sensitivity, specificity, and diagnostic odds ratio (DOR). Performance metrics were restricted to those pertaining to the “best-performing” model. In cases where discrepancies arose, a third reviewer (YL) was consulted to resolve disagreements. This three-tier review process ensured a rigorous and unbiased data extraction process. We outlined specific procedural steps followed to address disputes, ensuring clarity and systematic resolution. Furthermore, detailed descriptions of the training protocols followed by the reviewers were provided to ensure consistency and accuracy in data extraction. This included training on the use of the extraction form, familiarization with the inclusion and exclusion criteria, and calibration exercises to minimize variability between reviewers. Additionally, to enhance the transparency of our methodology, we listed specific software tools used for managing and analyzing the extracted data in the Supplemental Materials, allowing for replication and verification by other researchers.
Risk of Bias (RoB) Assessment and Quality of Evidence
The RoB for each study was independently assessed by two sets of investigators. Group 1, consisting of YJ and YL, and Group 2, which included LL and ZW, utilized the Prediction Model Risk of Bias Assessment Tool (PROBAST), which encompasses 20 queries spread across four key domains: participants, predictors, outcomes, and analysis. Each domain was subsequently categorized as either ‘low’ or ‘high’ risk of bias. To ensure a meticulous evaluation of adherence to reporting standards, we employed the Transparent Reporting of a Multivariable Prediction Model for Individual Prognosis or Diagnosis (TRIPOD) protocol. Any discrepancies that arose during the assessment process were mediated by a third investigator, YC, to reach a consensus. The detailed assessments, including any modifications made to the TRIPOD and PROBAST for this specific review, are documented in Supplementary Tables S2 and S3.
Data Synthesis
To visualize the types of characteristic variables in each model, network diagrams were used. The discriminative capacity of each predictive model was primarily assessed using the AUC, sensitivity, specificity, and DOR. AUC values, along with their 95% confidence intervals (CIs), were collated from the included studies. The standard error (SE) of each AUC was calculated using the actual counts of positive and negative cases provided in the studies. When 95% CIs were not explicitly mentioned, they were derived from the available data using the formula: 95% CI = effect size (AUC) ± 1.96 × SE. In situations where the SE was not reported, it was estimated using the formula that includes sensitivity, specificity, and the number of positive and negative cases, following the method described by Hanley et al, who developed a nonparametric approach to compare areas under correlated ROC curves. 12
In addition to AUC, sensitivity and specificity for each study were systematically analyzed. Sensitivity (SEN), specificity (SPE), and DOR were calculated from individual studies, and their standard errors were derived using binomial distribution formulas. SPE and SPE were calculated from individual studies, and their standard errors were derived using binomial distribution formulas. Forest plots were employed to illustrate the variability and precision of these estimates across studies through both fixed and random-effects models.
Statistical heterogeneity among the studies was rigorously evaluated using Cochran's Q-test, with significance set at P ≤ .10, and the I^2 statistic, where values above 50% indicated notable heterogeneity. When significant heterogeneity was observed, a random-effects model was used for pooling the AUCs, sensitivities, specificities, and DORs. If heterogeneity was minimal, a fixed-effects model was applied. Additionally, correlations between AUC values and corresponding variables such as sensitivity, specificity, and DOR were visualized using network diagrams. This analysis elucidated the relationships and potential trade-offs between model sensitivity and specificity in detecting true positives and correctly identifying negatives, respectively. All meta-analyses and network diagrams were constructed in R Studio, using R version 4.2.3, providing a robust platform for statistical computation and graphical representation.
Results
Search Results
We initially identified 1943 records across various databases, from which 564 duplicate records were removed before screening. After screening 1379 titles and abstracts, we excluded 1276 records for irrelevance or inappropriateness, leaving 103 articles for full-text assessment. Of these, 91 were further excluded due to irrelevance to the study criteria or methodological issues, resulting in 12 studies being included in the final systematic review and meta-analysis (Figure 1).
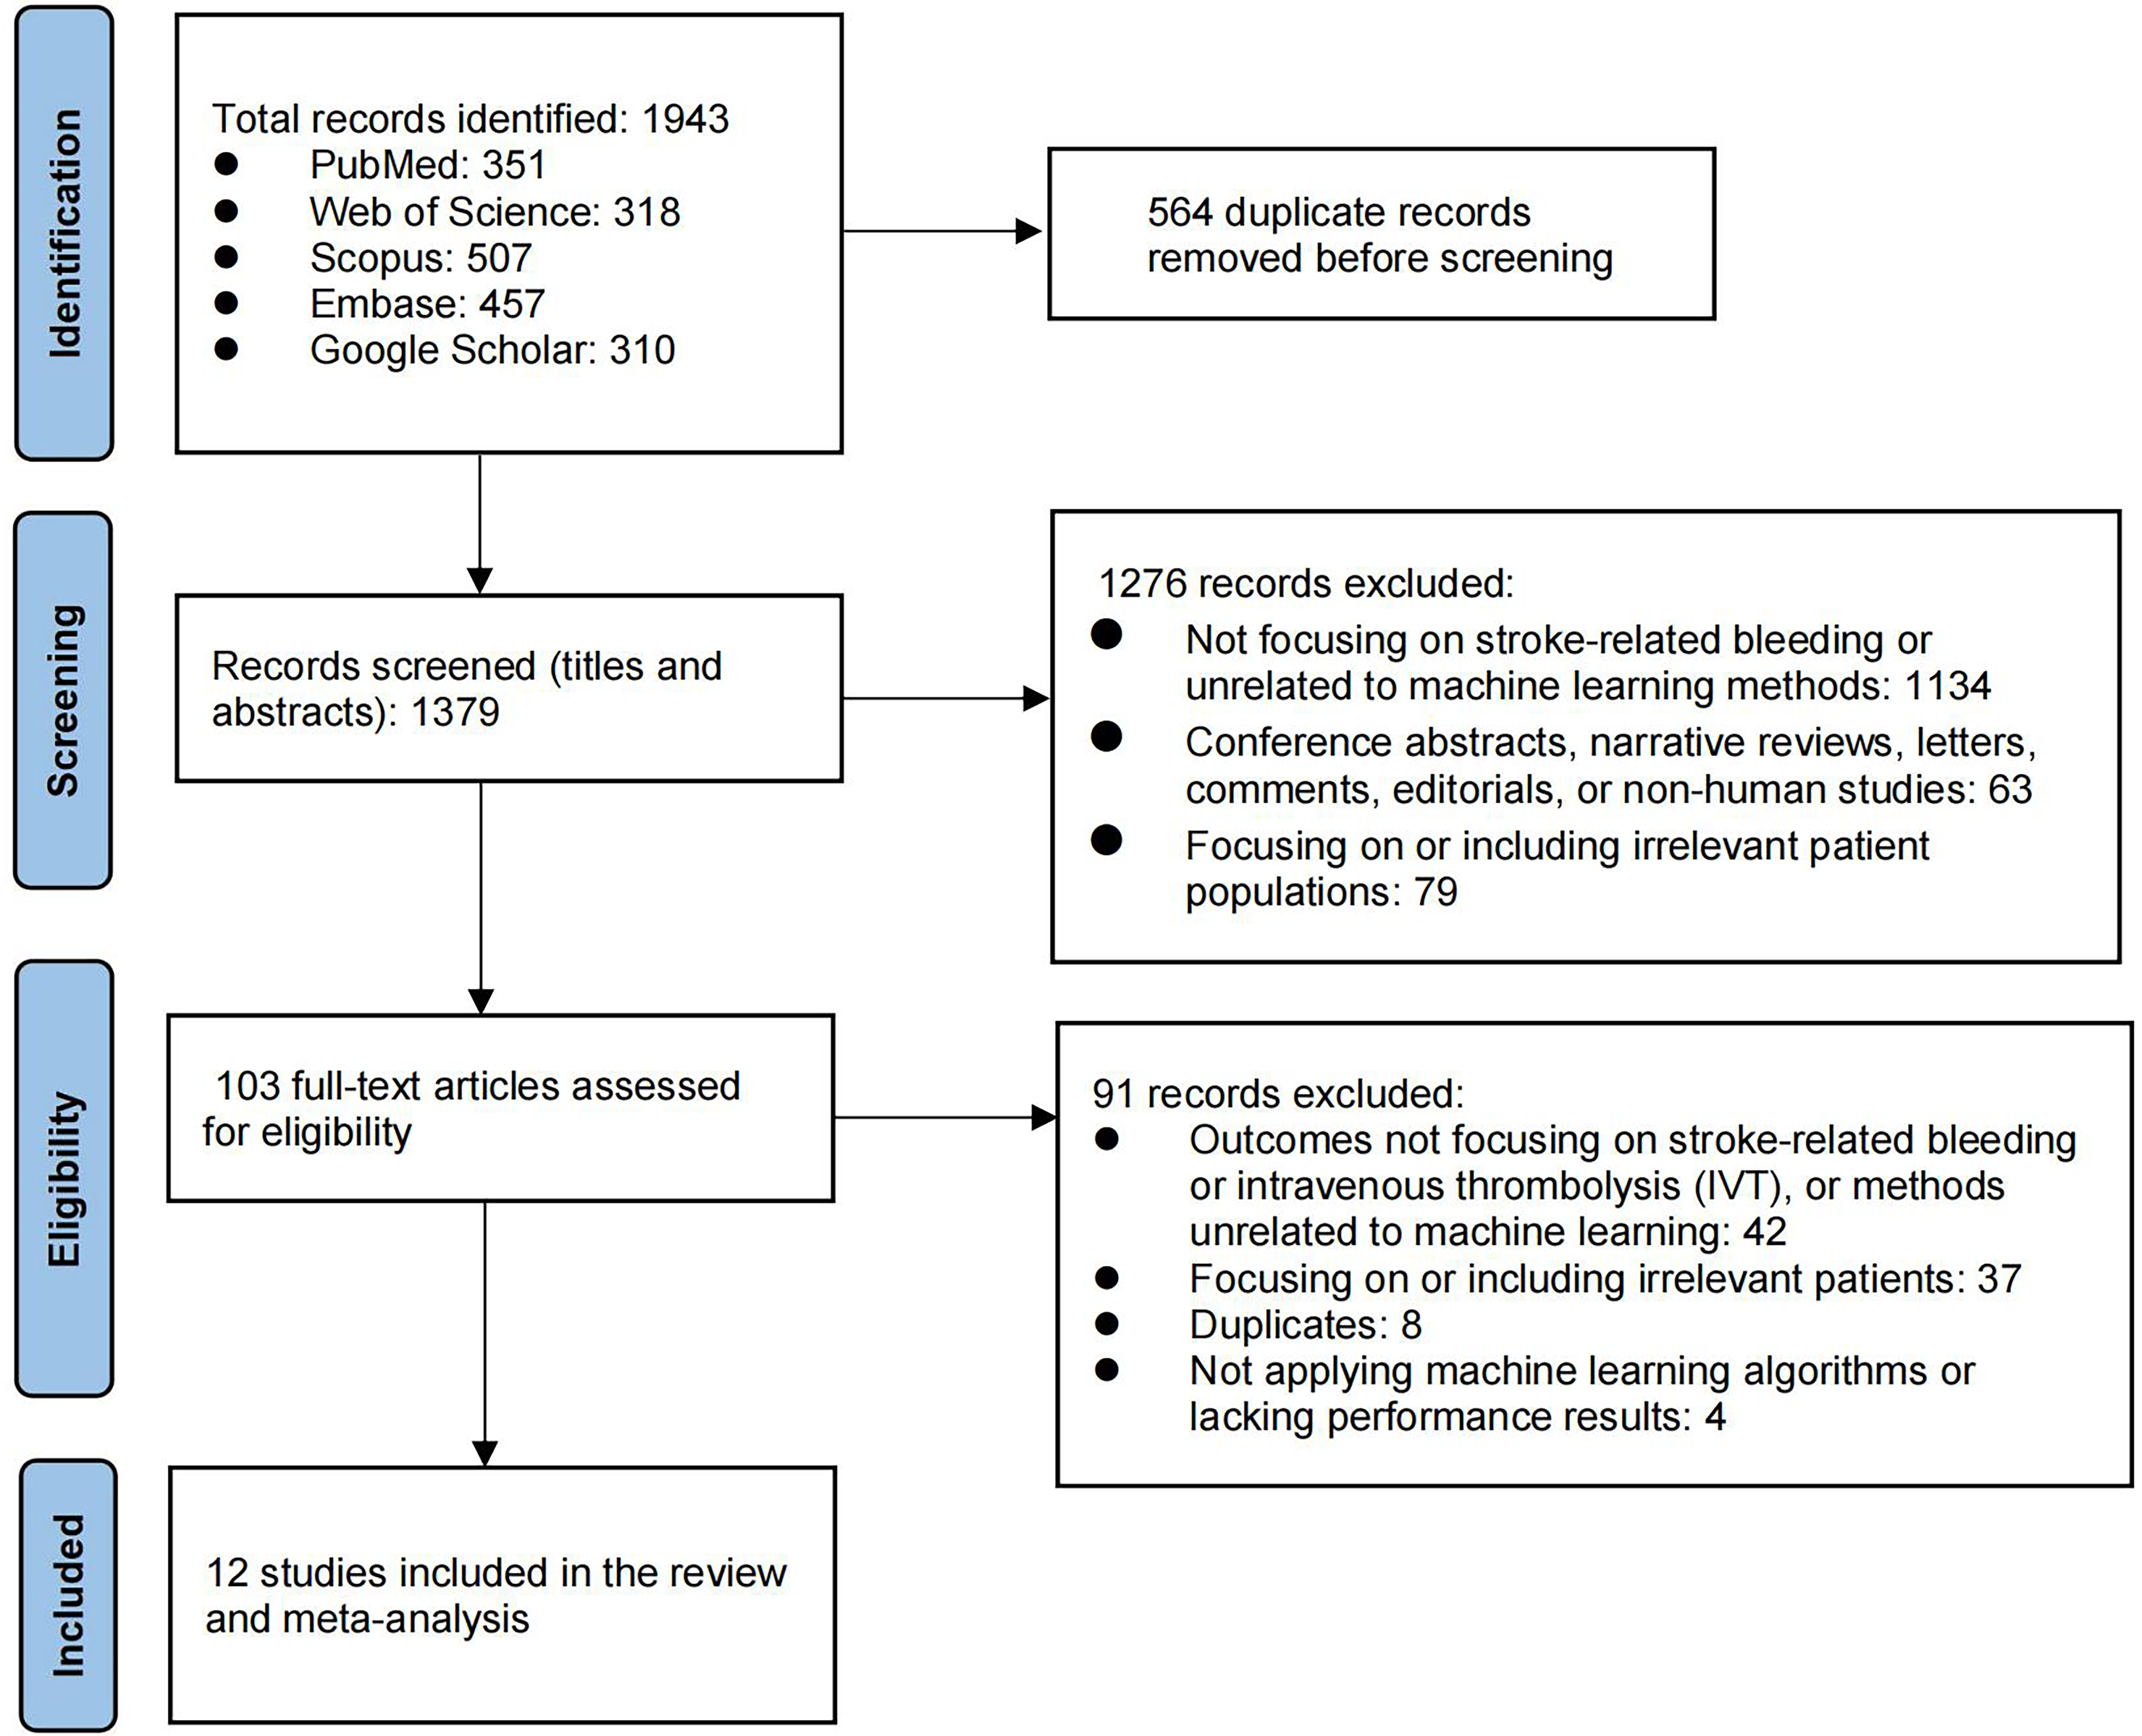
Flowchart of study selection process.
Basic Characteristics
A concise overview of the characteristics of the eligible studies13–24 is provided in Table 1. Out of the 12 studies, a collective total of 18 007 participants who had AIS and received thrombolytic therapy were included. The age of participants in these studies had a mean or median ranging from 64.00 to 69.32 years. The male participants’ percentage across the studies varied between 55.1% and 69.9%. Among the 12 studies, 8 were conducted in mainland China.13–15,17,21–24 The other studies were singular representations from South Korea, 18 Thailand, 19 the United Kingdom, 16 and Taiwan. 20 Two studies used public databases,16,24 and the others were collected retrospectively.13–15,17–23 Six out of these studies carried out external validation for their predictive model.14,16–18,22,24 Details about individual study characteristics, methodologies, and key findings are elaborated in Tables 1 and 2.
Basic Characteristics.
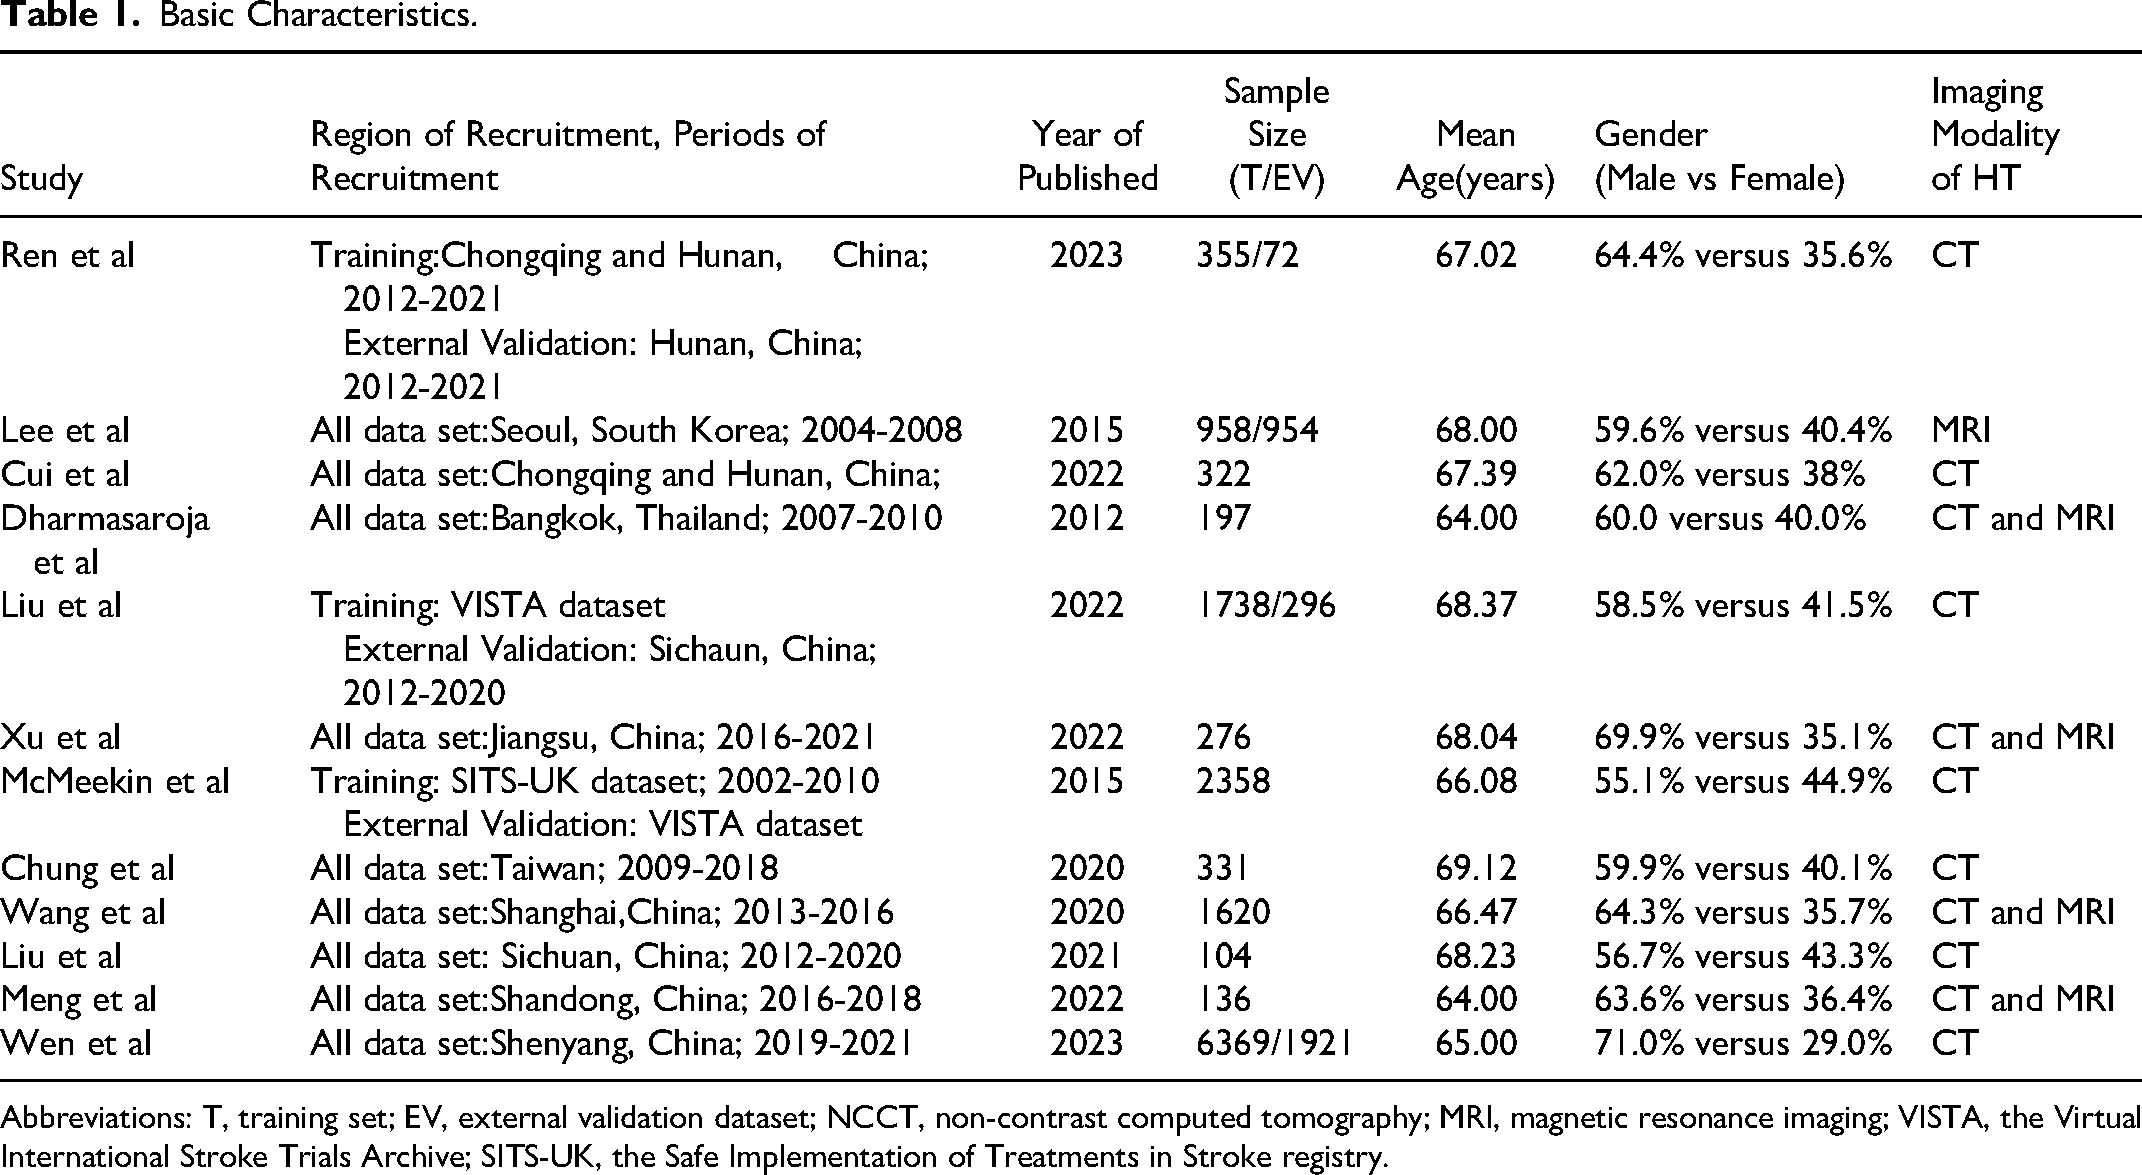
Abbreviations: T, training set; EV, external validation dataset; NCCT, non-contrast computed tomography; MRI, magnetic resonance imaging; VISTA, the Virtual International Stroke Trials Archive; SITS-UK, the Safe Implementation of Treatments in Stroke registry.
Model Development Using Conventional Machine Learning Algorithms.
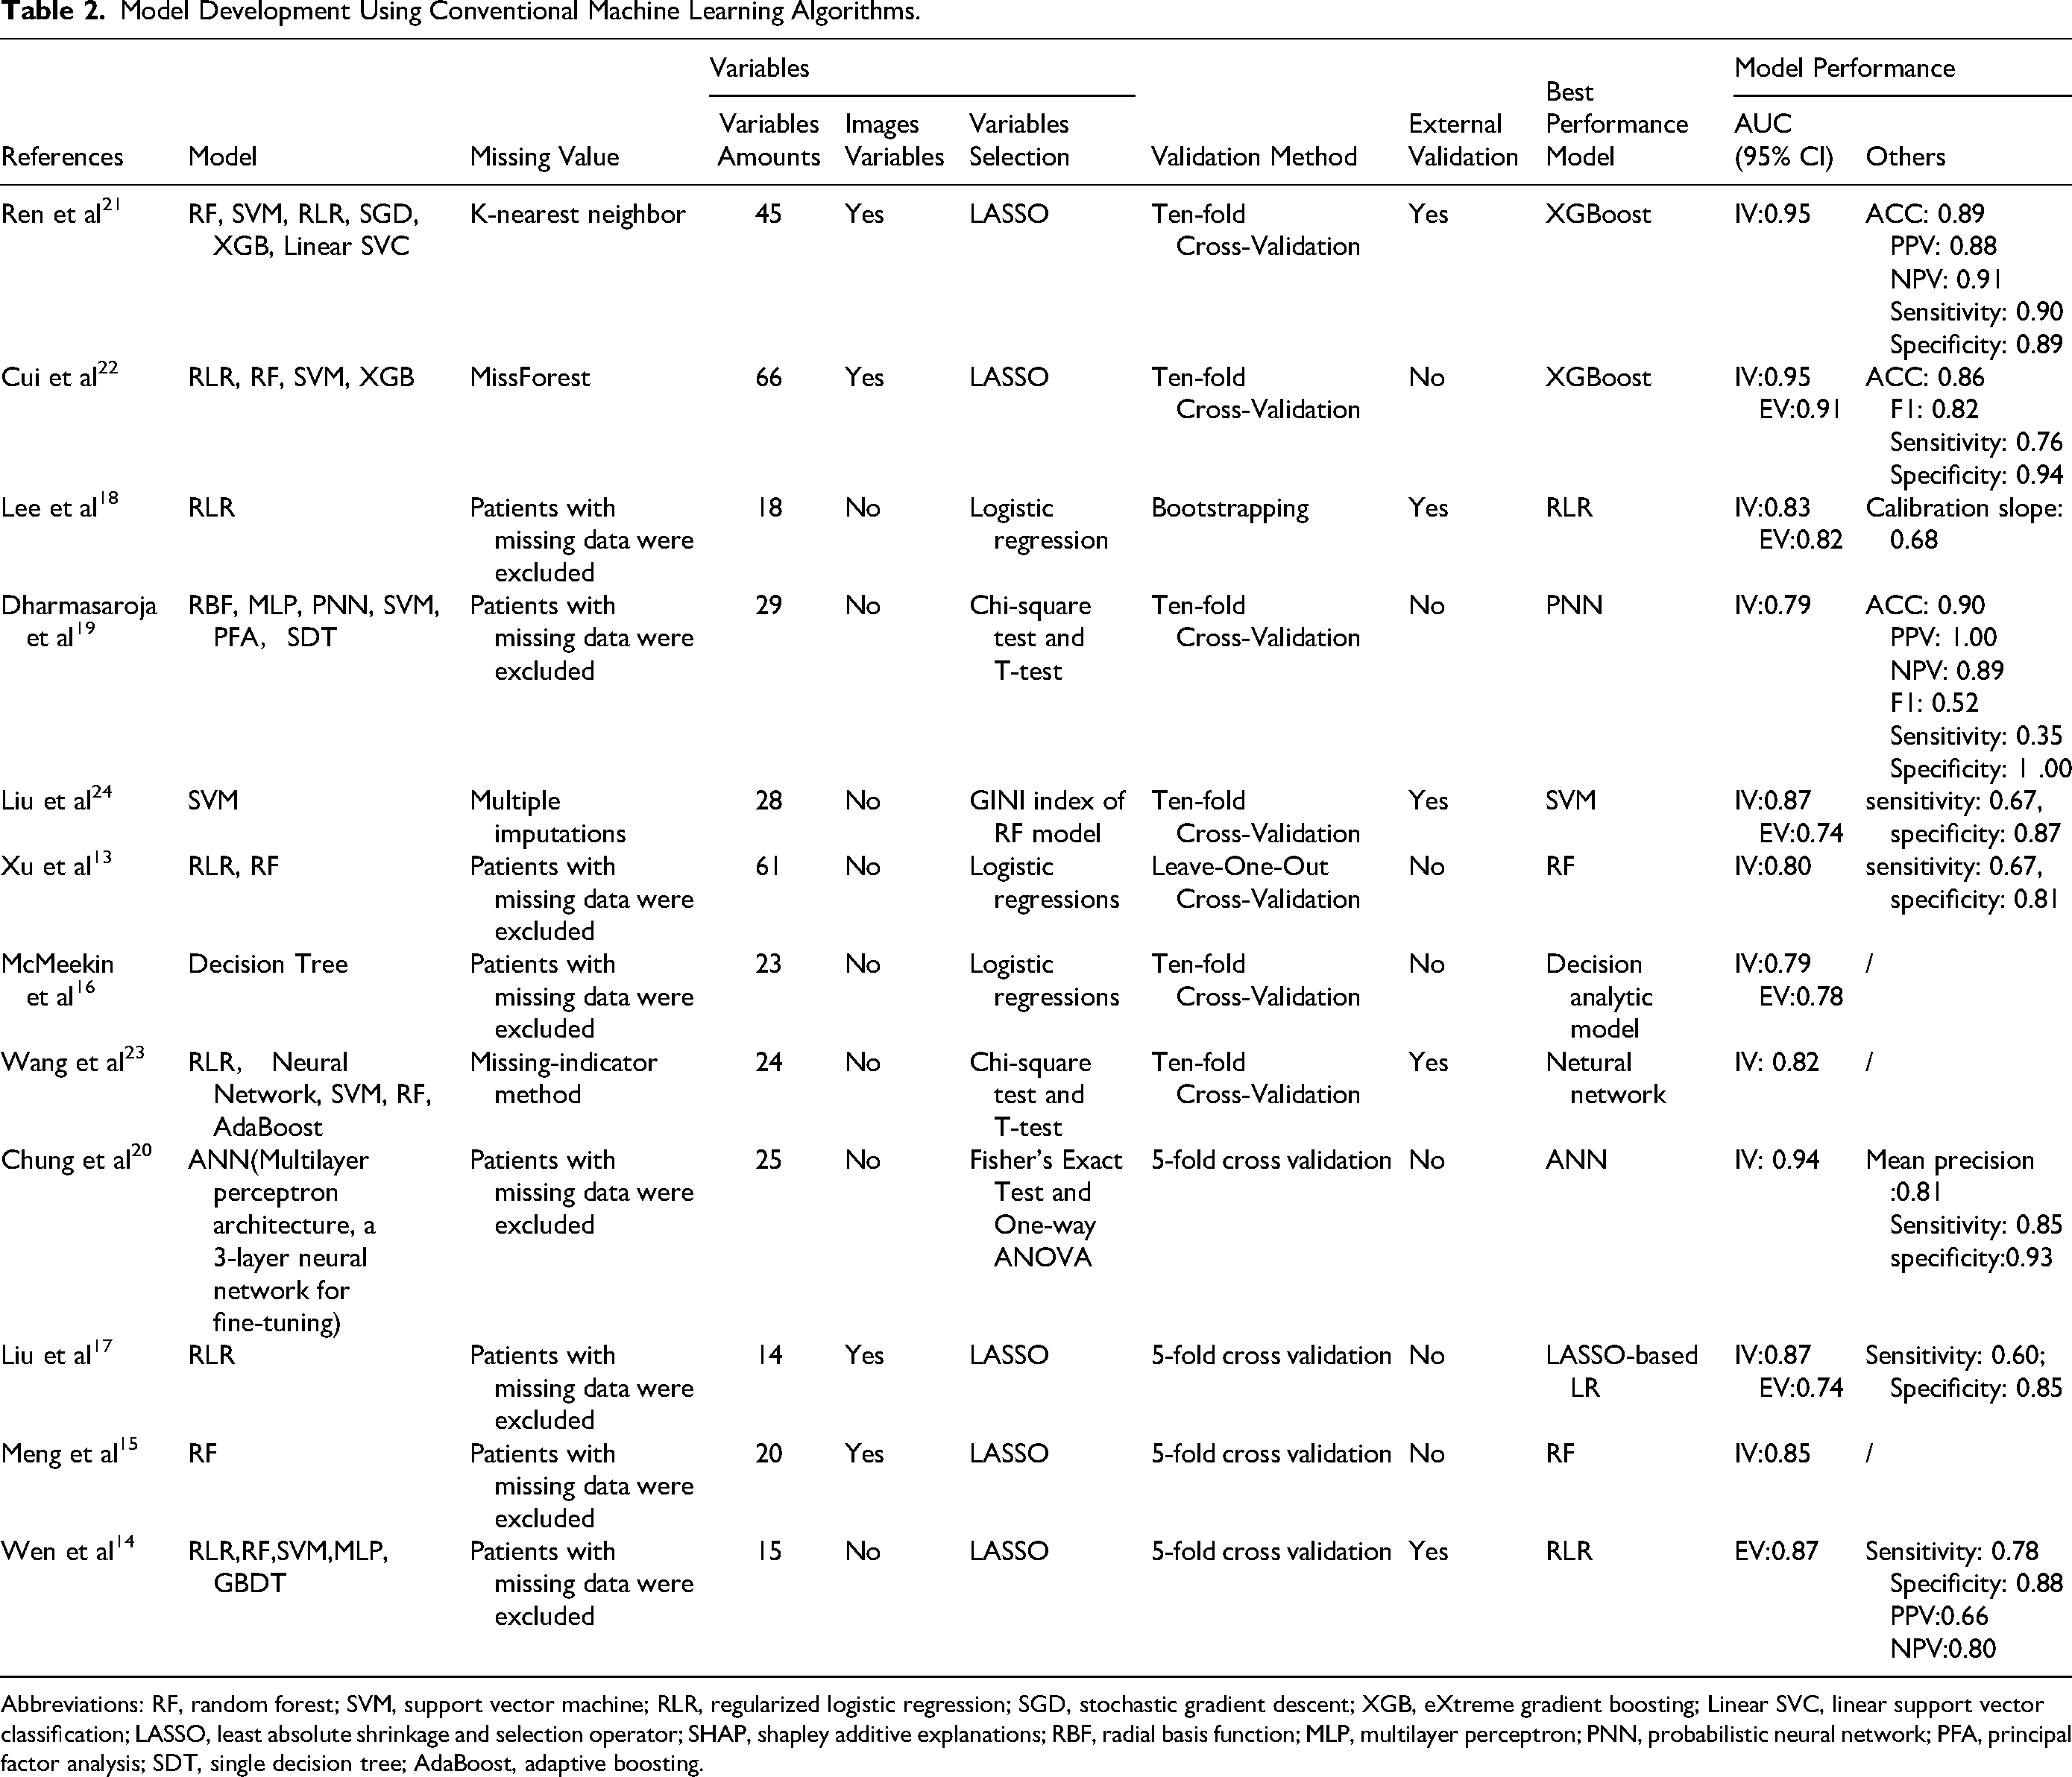
Abbreviations: RF, random forest; SVM, support vector machine; RLR, regularized logistic regression; SGD, stochastic gradient descent; XGB, eXtreme gradient boosting; Linear SVC, linear support vector classification; LASSO, least absolute shrinkage and selection operator; SHAP, shapley additive explanations; RBF, radial basis function; MLP, multilayer perceptron; PNN, probabilistic neural network; PFA, principal factor analysis; SDT, single decision tree; AdaBoost, adaptive boosting.
Features Selection and Model Development
Out of the studies reviewed: 12 implemented various ML algorithms for crafting predictive models.13–19,21–24 One study made use of the Artificial Neural Network (ANN) algorithm for its prediction tasks. 20 The algorithms employed across the studies can be categorized as follows: Decision Trees, Random Forest, Regularized Logistic Regression (RLR), Support Vector Machine (SVM), eXtreme Gradient Boosting (XGBoost), Linear Support Vector Classification (Linear SVC), and Probabilistic Neural Network (PNN). Data completeness plays a pivotal role in predictive modeling. The approaches to handle missing data among the studies varied: Four studies leveraged advanced imputation techniques, namely multiple imputations, miss-forest, or the missing-indicator method, to manage gaps in data.21–24 Other studies opted to exclude participants who had any missing data, either in feature variables or outcome variables (Table 2).13–20,24
Important Predictors and Best Model Performance
In the Figure 2, several features emerged as significant predictors in the ML models used for forecasting outcomes. These encompass: age, glucose levels, NIH Stroke Scale (NIHSS) score, International Normalized Ratio (INR), Systolic Blood Pressure (SBP), Diastolic Blood Pressure (DBP), onset to treatment time, and White Blood Cell (WBC) count, consistently emerged as significant predictors in ML-based models. Additionally, some studies incorporated imaging features derived from radiomic analysis into their predictive models. These imaging features, which assess parameters such as vascular health, local blood flow, and tissue integrity, were used to enhance the predictive accuracy of the models.
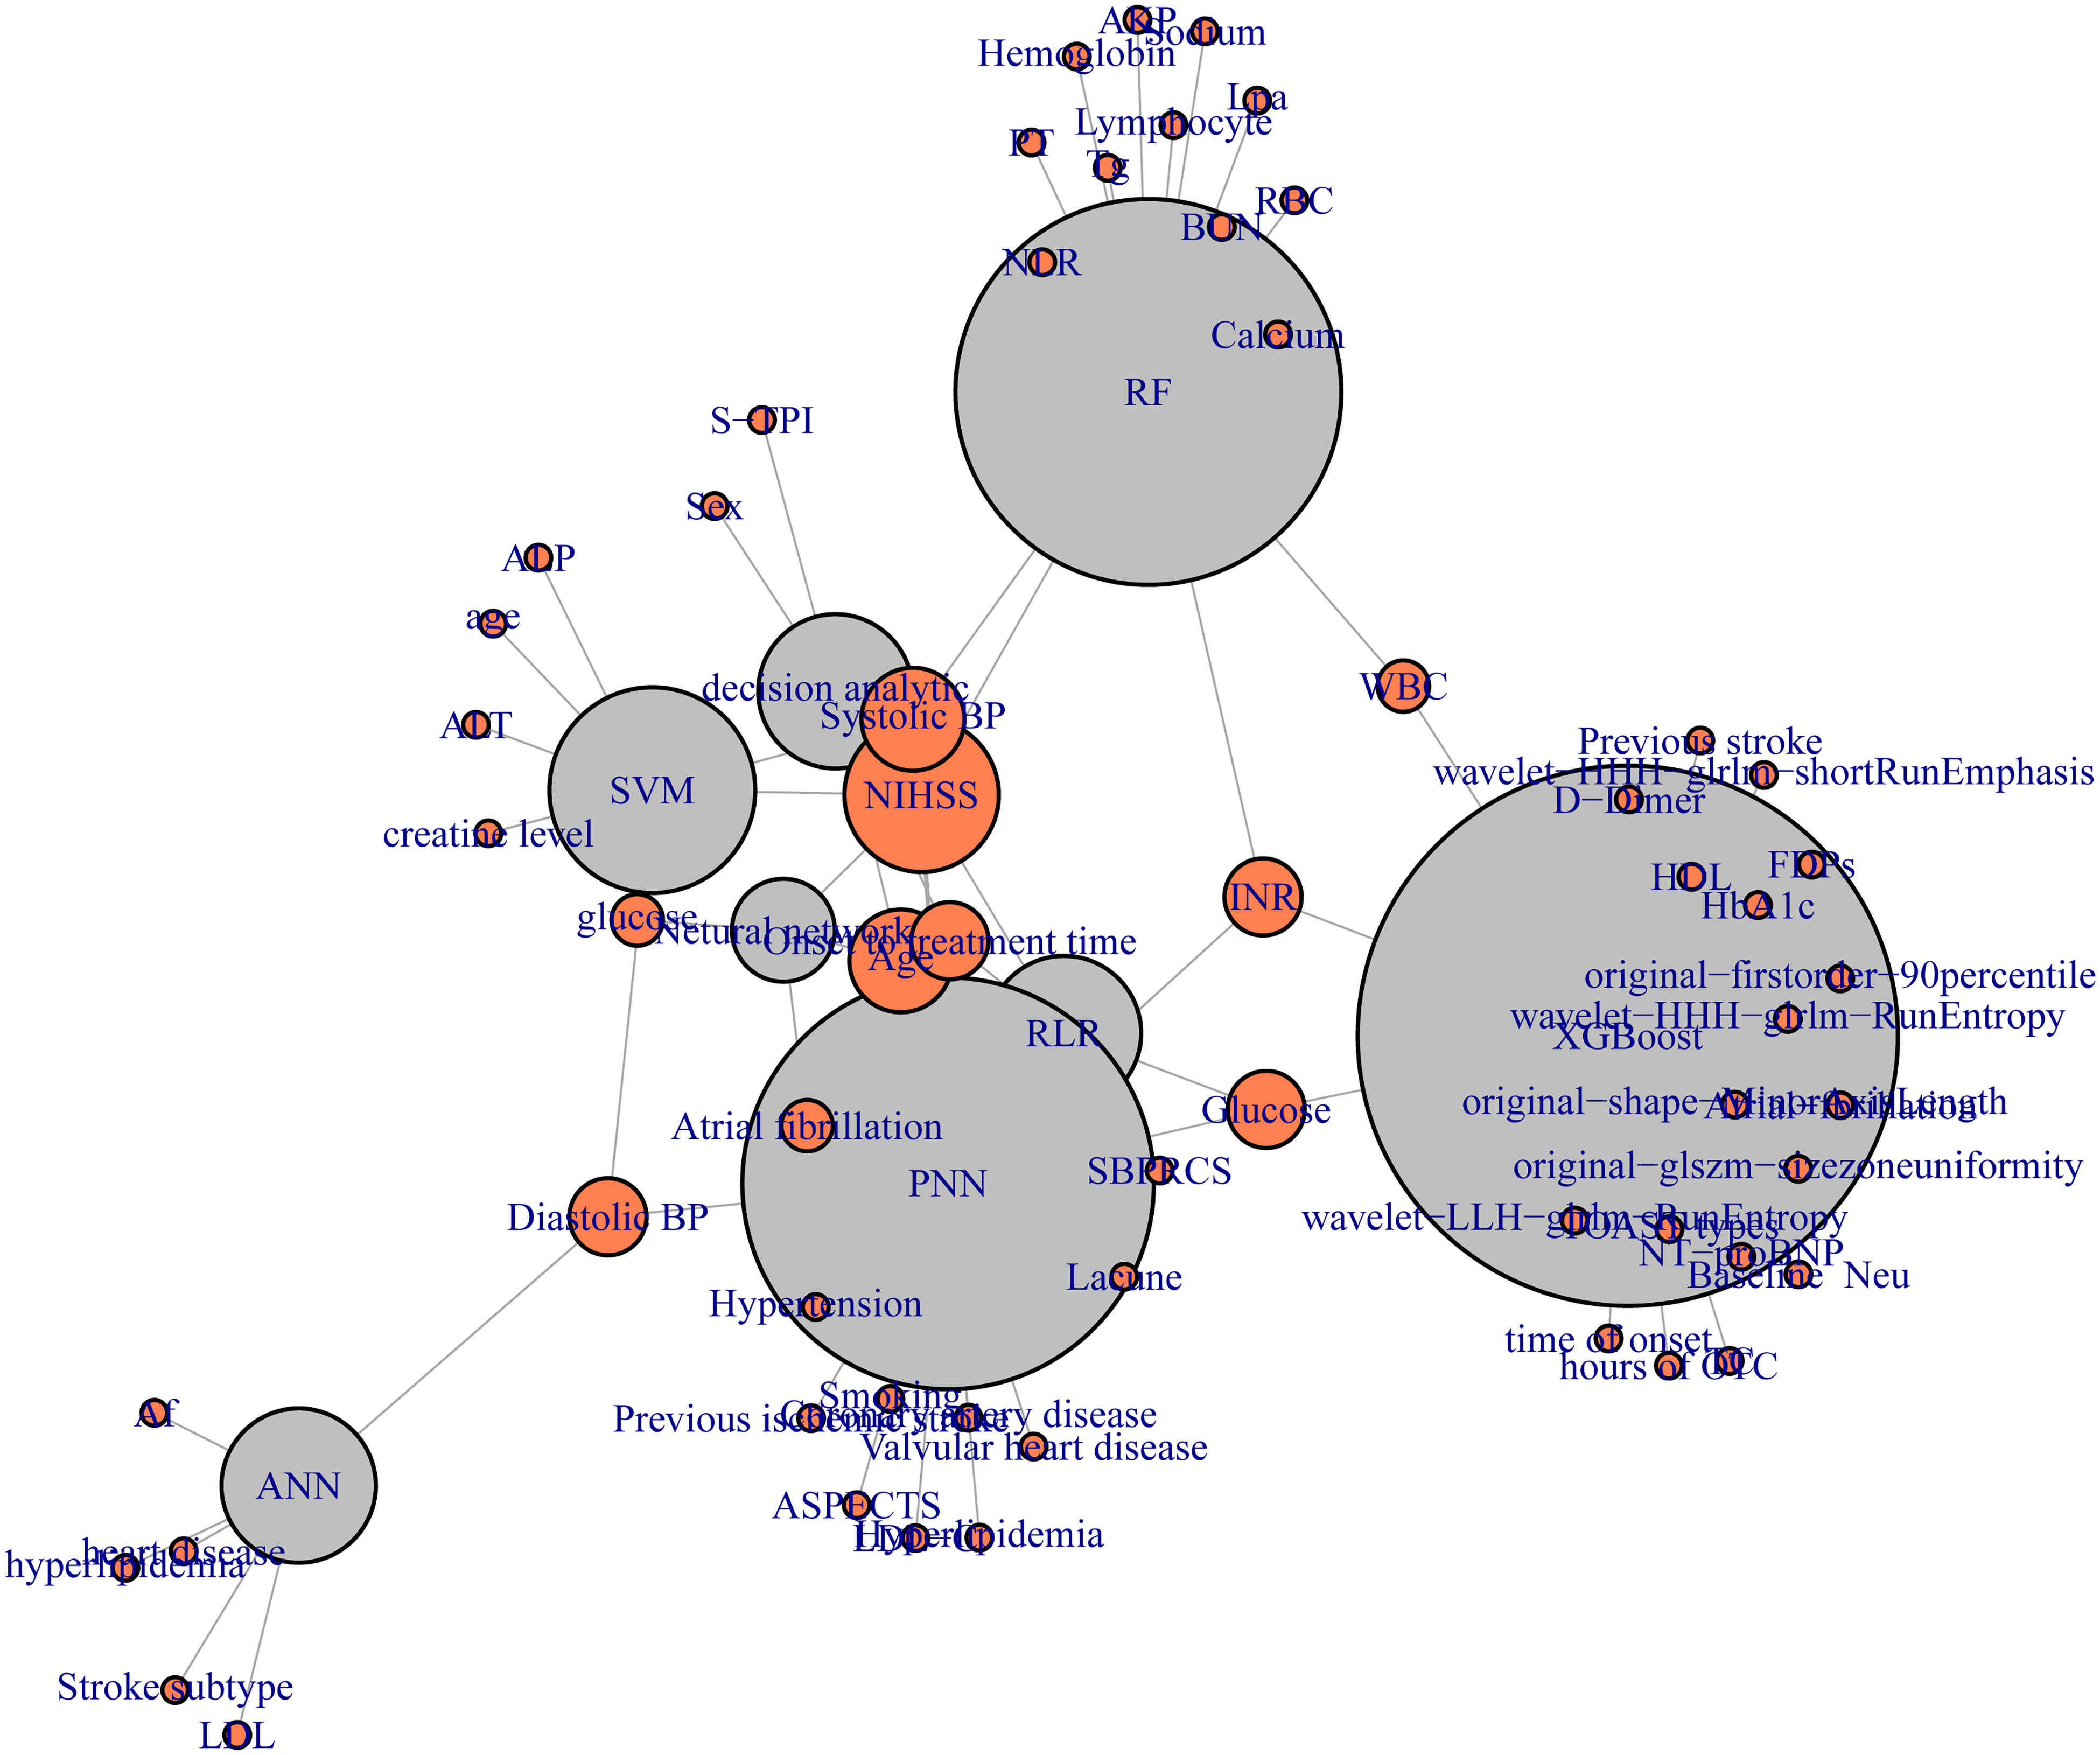
Key Predictors identified in machine learning models.
All studies reported AUC values, and 7 studies fully reported confidence intervals and SE,13–15,17,18,21,24 1 article only reported SE,
20
and the remaining 4 studies reported data that can be used to calculate SE and confidence intervals.16,19,22,23 We used the following formulas to further calculate, and finally obtained the 95% confidence intervals of SE and AUC in the study:

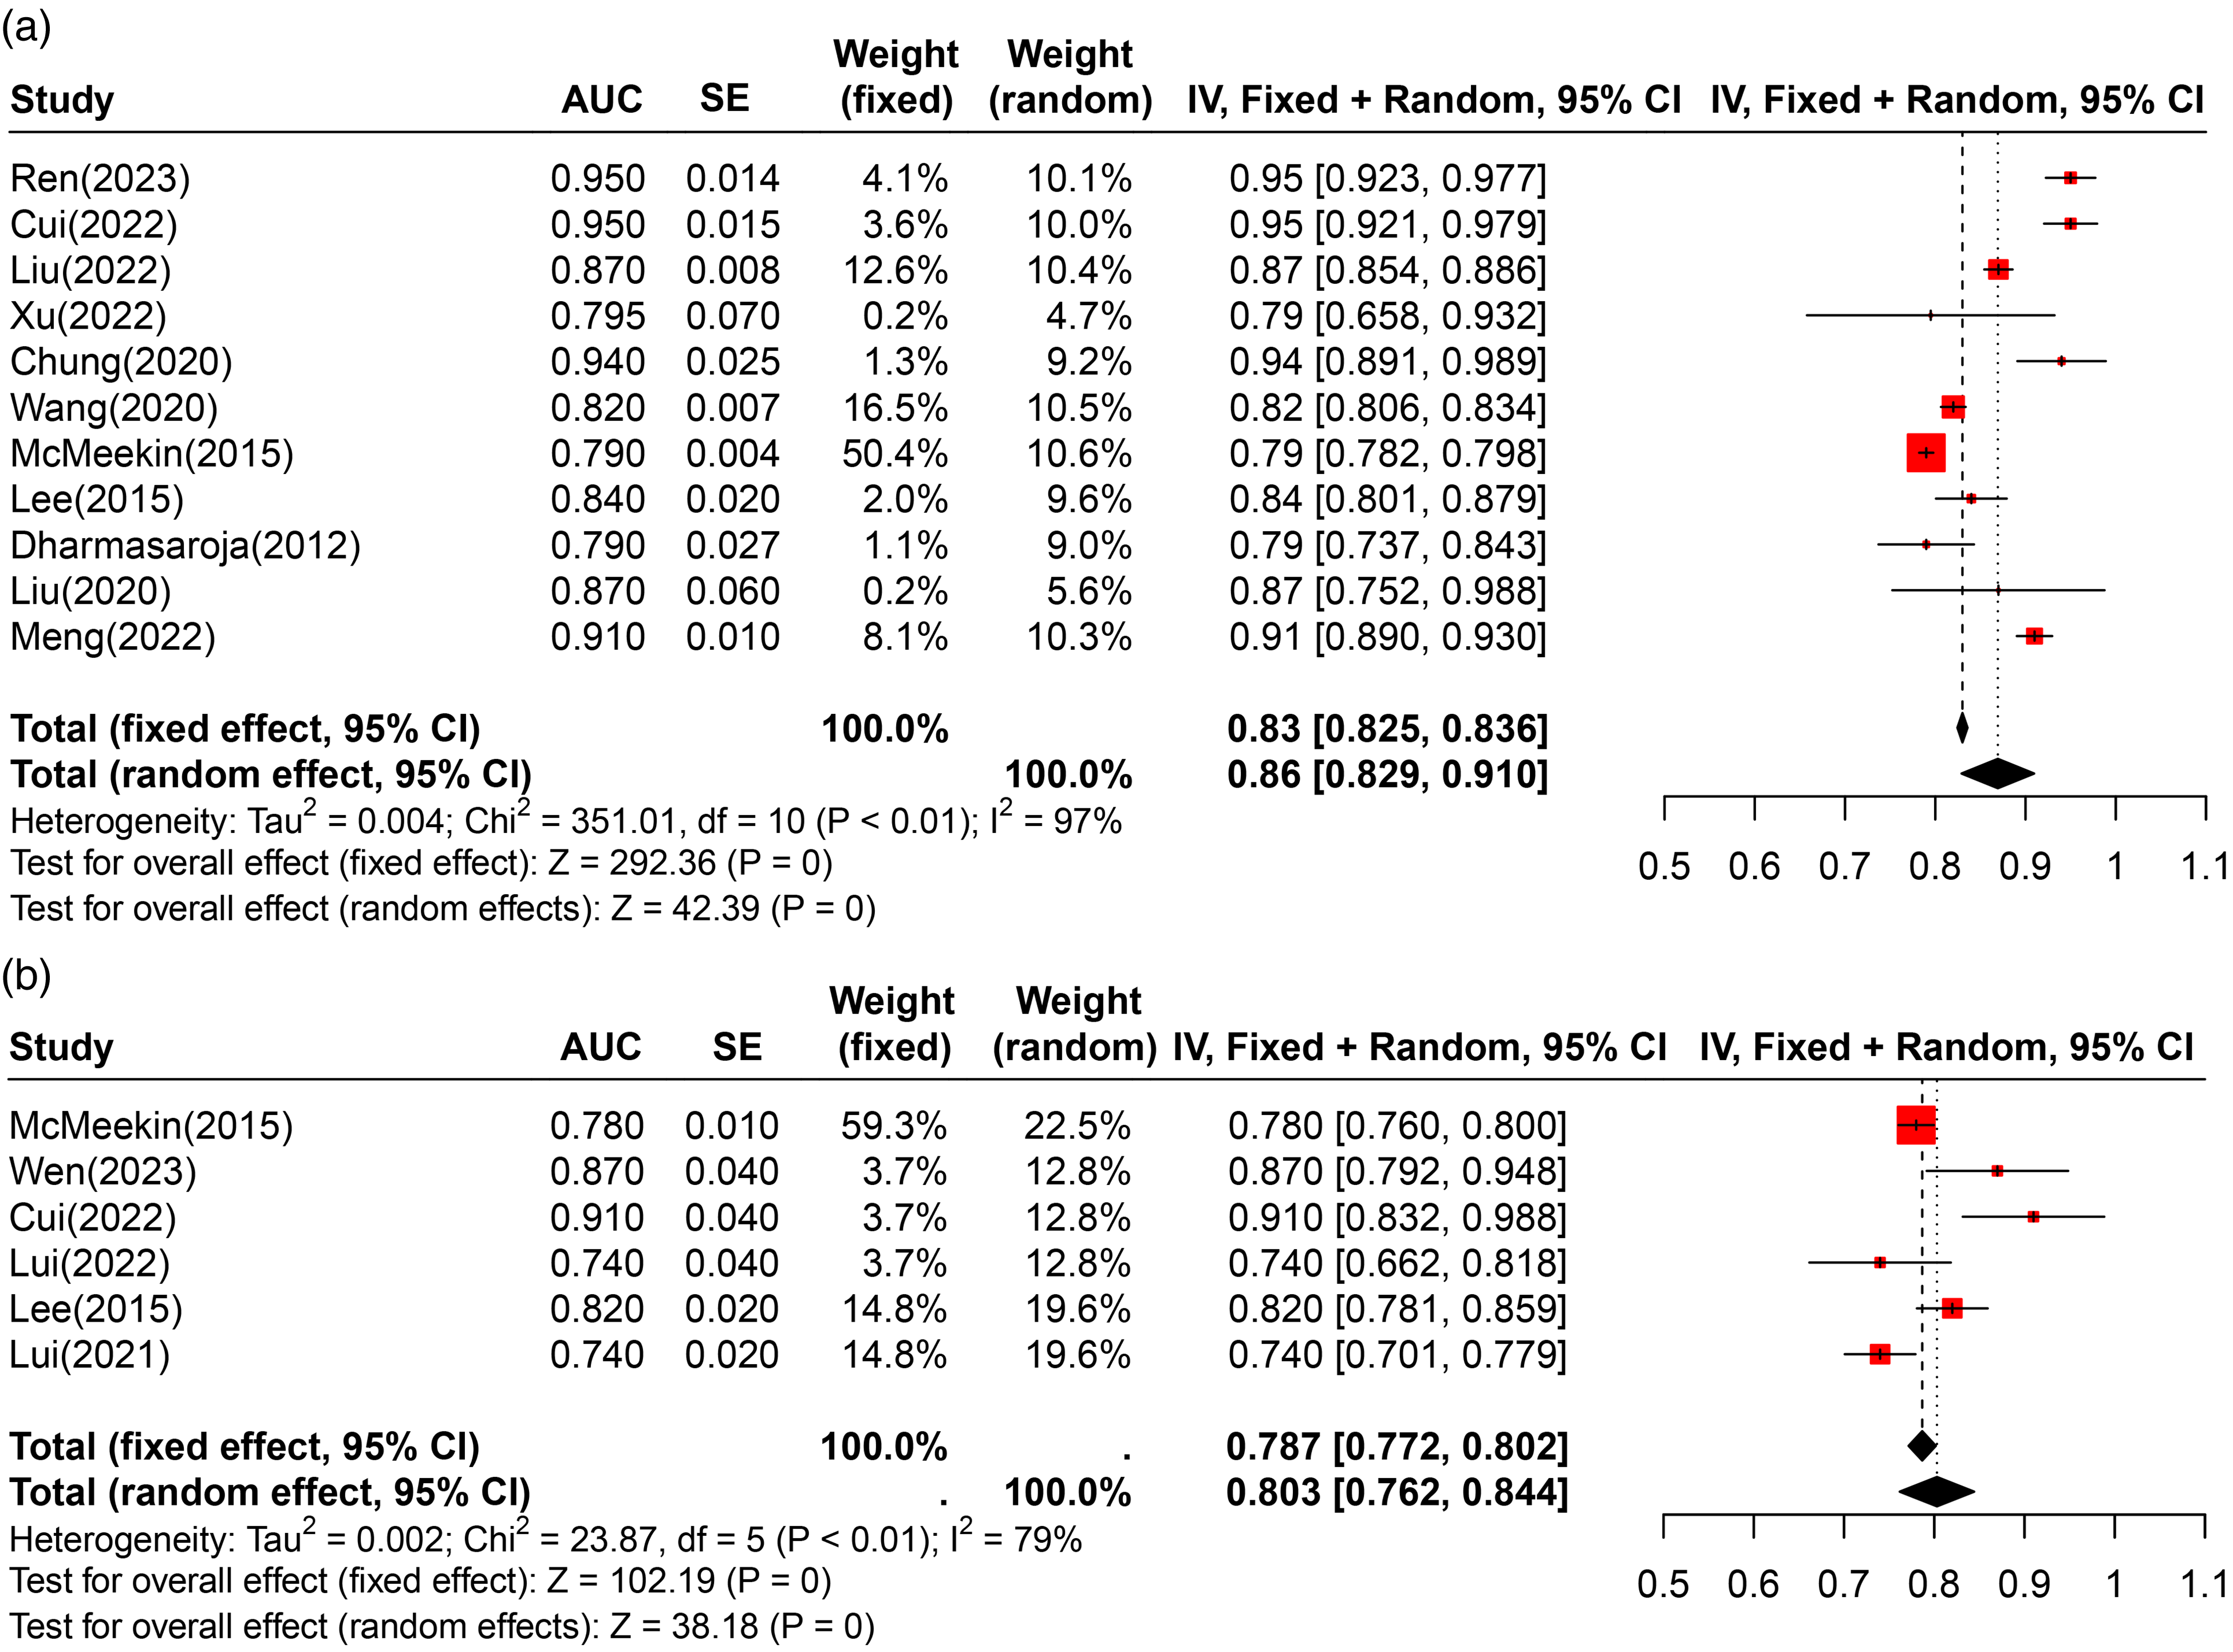
Forest plots illustrating the AUC values for internal validation (a) and external validation (b) cohorts, highlighting the discriminative ability and robustness of the machine learning models across different datasets.
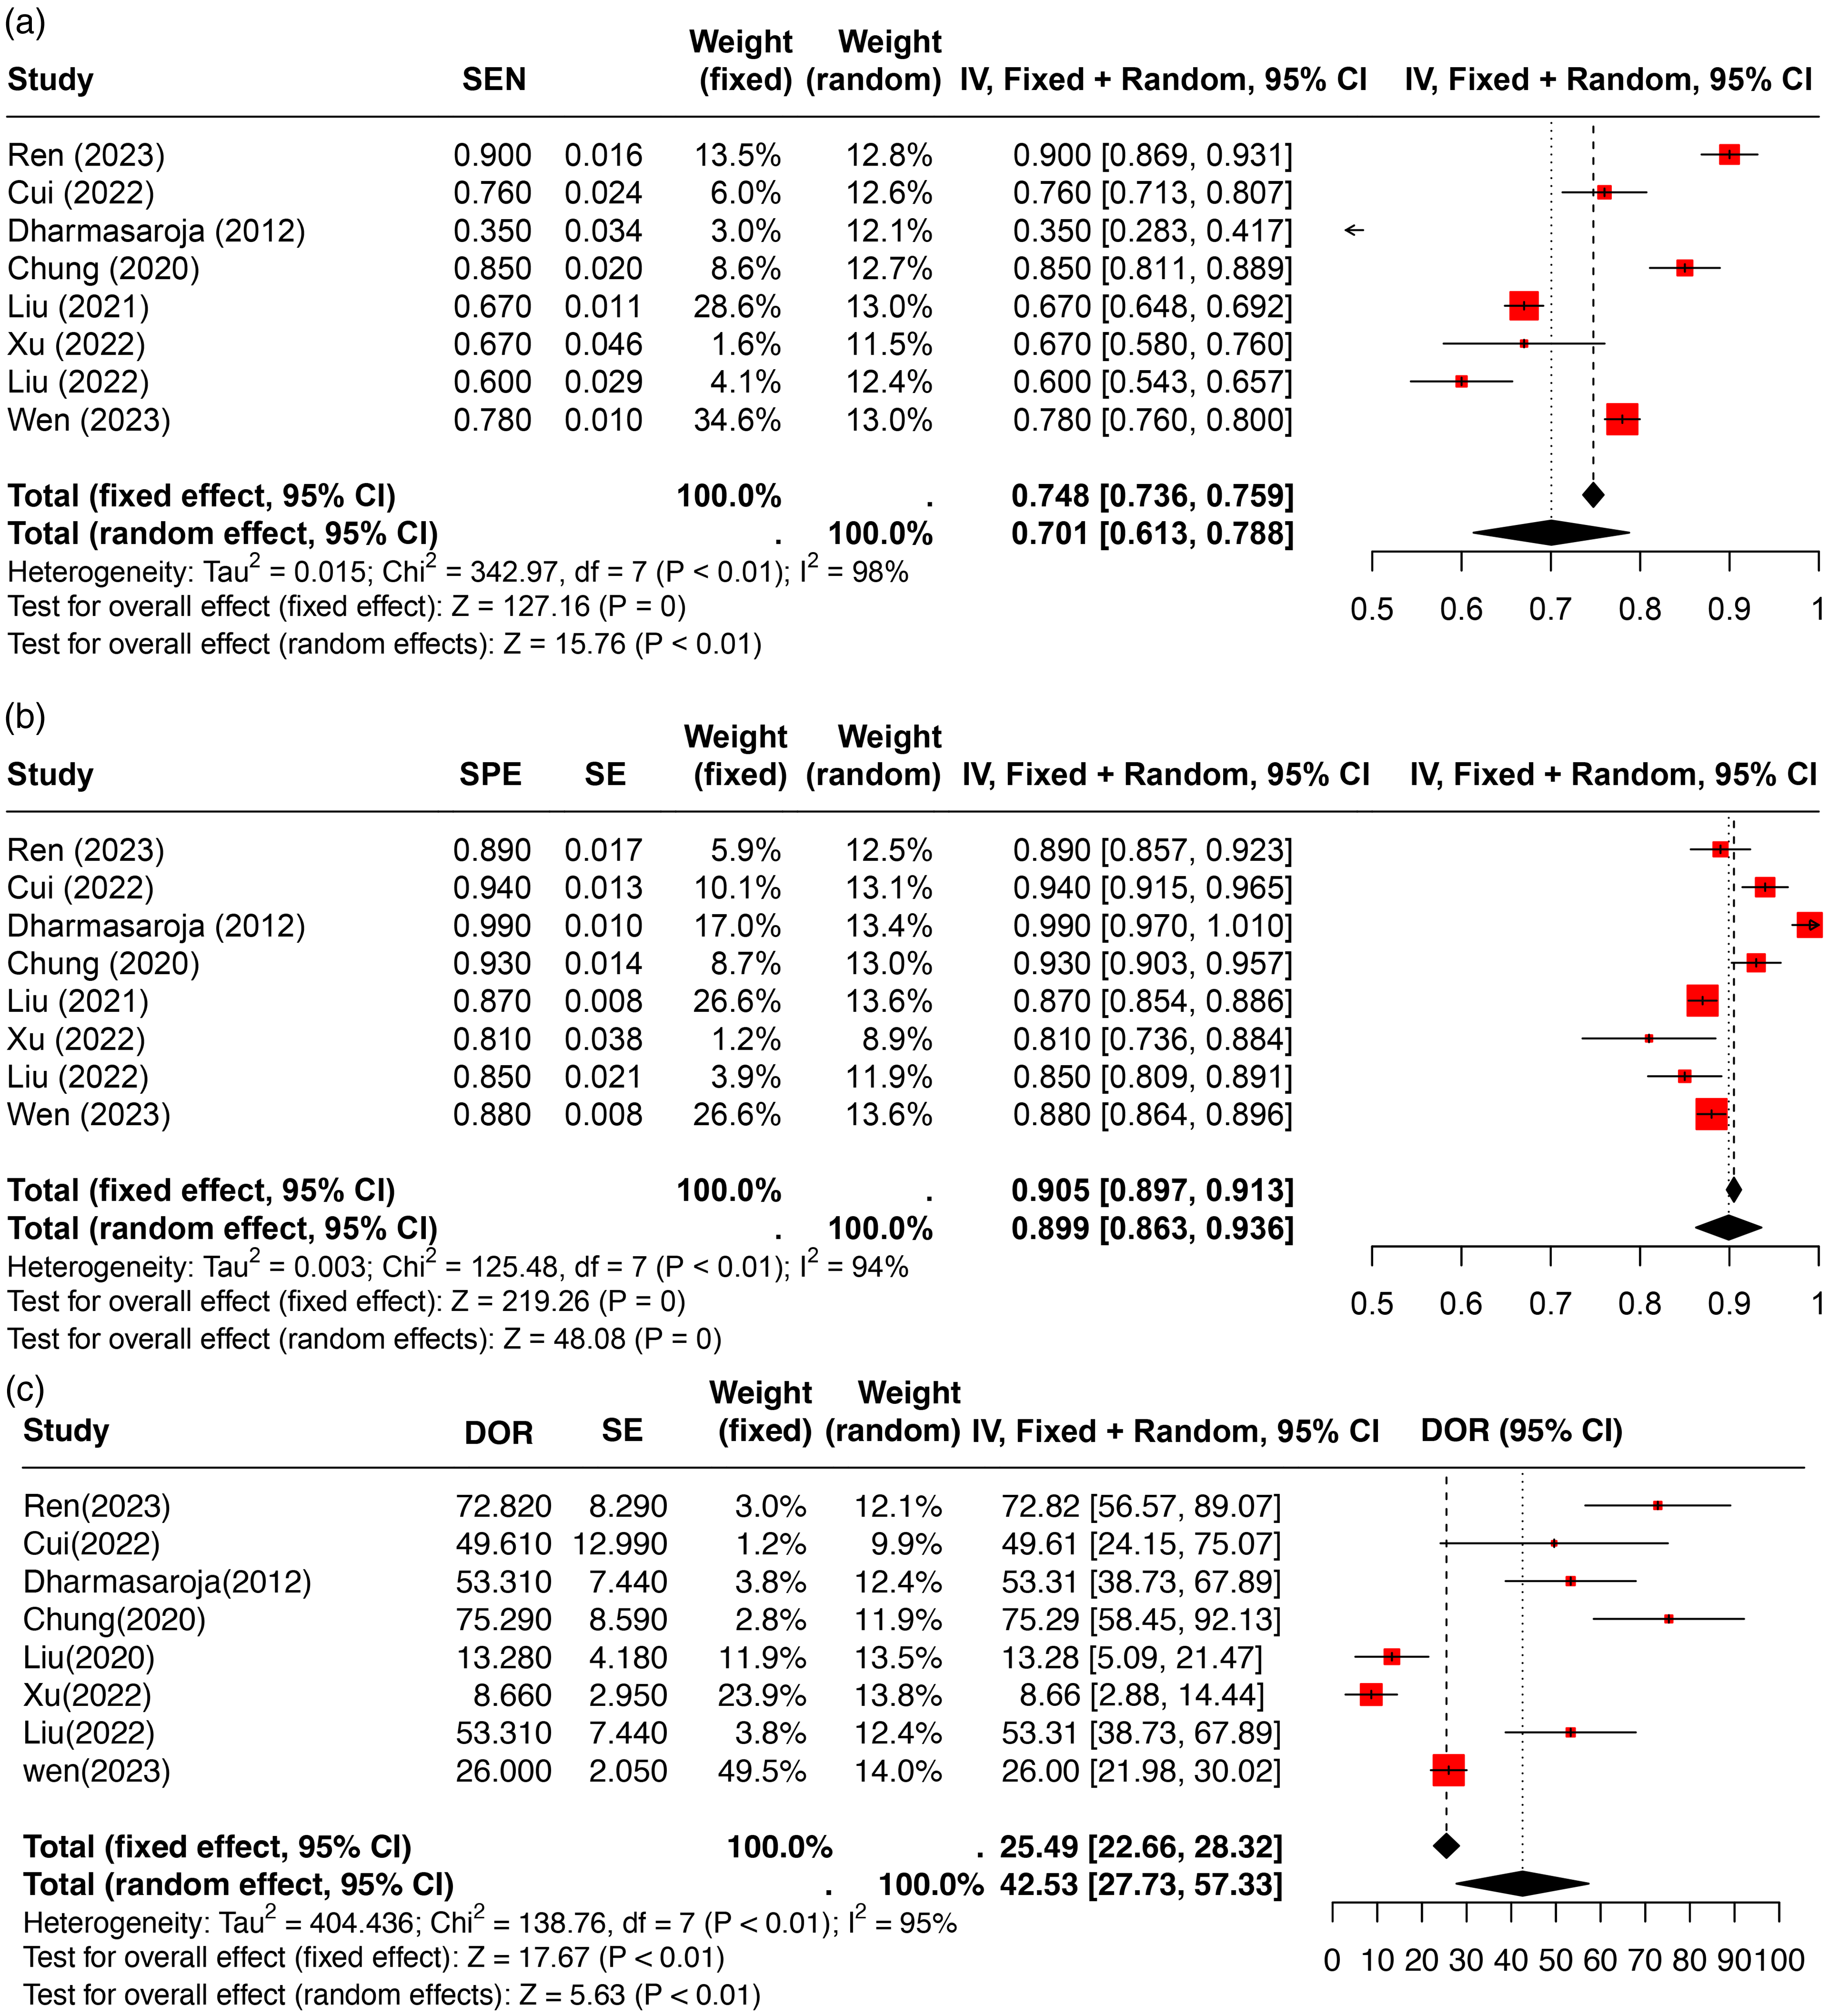
Forest plots of model performance metrics, including sensitivity (a), specificity (b), and diagnostic odds ratio (DOR) (c), demonstrating the variability and precision of the predictive models’ performance.
The highest sensitivity was observed in Ren 21 with 0.90 (95% CI: 0.869, 0.931), while the pooled sensitivity was 0.701 (95% CI: 0.613, 0.788). Specificity peaked in Dharmasaroja 19 at 0.99 (95% CI: 0.970, 1.010) and in Cui 22 at 0.94 (95% CI: 0.915, 0.965), with a pooled specificity of 0.905 (95% CI: 0.897, 0.913). DOR further highlighted the variability in model performance. Ren 21 demonstrated the highest DOR of 72.82 (95% CI: 56.57, 89.07), followed by Wen 14 with a DOR of 26.00 (95% CI: 21.98, 30.02). These results underscore the variability in model performance across studies, with Ren 21 and Chung (2022) standing out due to their high AUCs, sensitivity, specificity, and DOR values, suggesting robust diagnostic capabilities in predicting post-thrombolysis hemorrhagic transformation in acute ischemic stroke patients (Figure 4).
Risk of Bias and Reporting Quality
Upon evaluating the risk of bias, five ML-based studies14,15,17,23,24 and one DL-based study 20 showcased a low risk across all domains, as detailed in Supplementary Table S5. Conversely, some studies presented a high risk in domains such as missing data, variable outcome definitions, and validation methods. Nonetheless, the overall reporting quality was commendable, with a majority of studies adhering to over 70% of the “good” reporting criteria as per Supplementary Table S6. The funnel plot presented in Figure S1 shows variation in study outcomes, with some studies falling outside the expected range. This distribution hints at potential publication bias, where studies with positive or significant results may be more frequently published than those with negative or non-significant outcomes, potentially leading to an overestimation of the models’ effectiveness. The asymmetry observed in the funnel plot suggests small study effects or heterogeneity in methodologies and patient populations across the studies.
Discussion
Our meta-analysis underscores the significant potential of advanced ML techniques, such as XGBoost and ANN, in predicting HT following thrombolysis in patients with AIS. These ML models demonstrated excellent discriminative abilities, with high pooled AUC values, sensitivity, and specificity, indicating robust predictive capabilities. For instance, XGBoost models achieved the highest predictive performance, while ANN-based models also showed strong validity, effectively distinguishing patients with higher and lower risks of HT, which is crucial for clinical decision-making.20,22 The variability in DOR underscores the diagnostic robustness of advanced ML models. For example, Chung et al achieved a DOR of 75.29, indicating a strong association between predicted risks and actual outcomes. 20 However, significant differences in the effectiveness of various ML models are evident, with DOR values ranging widely. The integration of comprehensive patient data has been shown to significantly enhance the predictive performance of machine learning models. Ren et al successfully combined radiomics data with clinical data, leveraging radiomics features to provide detailed insights into tissue characteristics and vascular health, thus offering a more holistic view of the patient's condition. 21 This fusion of clinical and imaging data underscores the potential of advanced ML models to assimilate various data types and improve overall prediction accuracy and reliability. 22
When comparing different algorithmic frameworks, advanced models like XGBoost and ANN demonstrate superior capabilities over simpler models such as LR and SVM. 25 XGBoost, a gradient boosting framework, excels at capturing complex, non-linear relationships in data through its iterative approach of building and combining multiple decision trees. 26 This allows XGBoost to handle interactions between variables more effectively and improve predictive performance. 26 ANNs, with their multi-layered architecture, are particularly adept at learning intricate patterns within data through backpropagation and non-linear activation functions. 27 This deep learning approach enables ANNs to model complex relationships that simpler algorithms might overlook. The flexibility of ANNs in adjusting weights and biases through extensive training processes results in high sensitivity and specificity, making them highly reliable in clinical applications. 28 In contrast, models like LR and SVM, while useful for linear and binary classification problems, often fall short in handling the complexity and variability inherent in medical data. LR assumes a linear relationship between predictors and outcomes, which limits its ability to model non-linear interactions effectively. 29 SVM, though powerful in finding optimal hyperplanes for classification, can struggle with large, high-dimensional datasets and may require extensive tuning of parameters. 17 The advanced architectures of XGBoost and ANN, combined with their ability to integrate diverse data sources, make them particularly robust and reliable for clinical applications.22,23 These models have demonstrated high performance metrics, including AUC, sensitivity, specificity, and DOR values, indicating their strong diagnostic capabilities. This makes them crucial for improving the prediction of HT after thrombolysis in AIS patients, enabling more accurate risk stratification, better-informed clinical decisions, and ultimately improved patient outcomes. 26
The integration of comprehensive patient data has been shown to significantly enhance the predictive performance of these models. For instance, Ren et al successfully integrated radiomics data with clinical data, leveraging radiomics features to provide detailed insights into tissue characteristics and vascular health, thereby supplementing clinical predictors and offering a more comprehensive view of the patient's condition. 21 The fusion of clinical and imaging data underscores the potential of ML models to assimilate various data types and improve overall prediction accuracy and reliability. Combining clinical variables such as age, blood glucose level, NIHSS score, international normalized ratio, systolic blood pressure, diastolic blood pressure, treatment start time, and white blood cell count with radiomics features has proven to be a powerful approach to enhancing model performance. 30 This comprehensive data integration allows for a more nuanced understanding of the patient's condition, capturing complex patterns and relationships that may not be apparent through clinical data alone. Significant predictors identified in these models highlight the multifactorial nature of HT risk, underscoring the necessity for integrating diverse data types in predictive modeling. 31 Advanced ML algorithms, such as XGBoost and ANN, have demonstrated excellent performance metrics, including high AUC, sensitivity, specificity, and DOR values, indicating their robustness and reliability in clinical applications. 27 These findings suggest that integrating clinical and radiomics data using advanced ML algorithms is crucial for improving the prediction of HT after thrombolysis in AIS patients. This approach enables more accurate risk stratification, better-informed clinical decisions, and ultimately improved patient outcomes. 26
Our comprehensive review reveals significant methodological disparities in the reporting of HT outcomes across studies, emphasizing the need for standardized reporting practices to improve the comparability and reproducibility of predictive models. Current inconsistencies in the classification of HT categories, such as symptomatic forms like PH2 and those aggregated under categories HT1, HT2, and H, compromise the accuracy of model predictions. 32 This variability, along with limited details on key variables such as the timing and severity of HT occurrences, underscores the necessity for detailed documentation, uniform classification methods, and clear reporting to optimize model validation in clinical settings. 33 Future research must prioritize enhanced methodological transparency and strict adherence to established guidelines to improve the reliability and reproducibility of ML models in clinical practice. 34
Furthermore, our review identifies critical barriers to the widespread adoption of ML in clinical practice, including limited external validation and a lack of transparency in model development. With only half of the models externally validated, there is a clear need for more rigorous external data to test models across varied patient demographics and clinical settings, ensuring their applicability and robustness. 35 The opacity surrounding these models, with few studies disclosing complete details on their algorithmic configurations, hampers the ability of other researchers to verify or adapt these models independently. 36 This lack of transparency can lead to difficulties in assessing the true performance and generalizability of ML models, thereby limiting their integration into clinical workflows. 37
To bridge the gap between promising research findings and tangible clinical impact, we advocate for a shift towards prospective research designs. Integrating ML-based assessments into routine risk evaluation protocols for patients undergoing AIS thrombolysis can enhance personalized treatment strategies. 28 This integration should be supported by policy changes that promote the inclusion of ML assessments in clinical workflows, ensuring that advancements in ML are effectively translated into practice. By addressing these challenges and implementing the recommended improvements, we can advance the development of reliable and clinically viable prediction models, thereby enhancing the quality of care and patient outcomes in thrombolytic therapy. 25 By fostering a collaborative effort towards methodological rigor, transparency, and comprehensive validation, the clinical community can harness the full potential of ML models, transforming stroke management and improving patient prognoses. 38 This collaborative approach is essential for overcoming existing barriers and ensuring the integration of ML models into clinical practice, ultimately leading to more effective and personalized stroke care.
Our study has several limitations. Firstly, not all included studies reported sensitivity and specificity, which constrained our ability to comprehensively evaluate the predictive performance of the models. To mitigate this, we calculated sensitivity and specificity from available positive and negative predictive values, and we attempted to contact the original researchers for additional data. Secondly, while a bivariate meta-analysis would have been more appropriate for this type of study, we were unable to perform it due to data constraints. Nevertheless, we rigorously collected and calculated metrics such as AUC, sensitivity, specificity, and DOR to provide a robust assessment of model effectiveness. Additionally, the heterogeneity in study methodologies and patient populations may impact the generalizability of our findings. Future research should aim to standardize reporting practices and conduct bivariate meta-analyses to enhance the robustness and clinical applicability of conclusions.
Conclusion
Our meta-analysis underscores the significant potential of advanced ML techniques, such as XGBoost and ANN, in predicting HT following thrombolysis in AIS patients. These models demonstrate robust predictive capabilities, enhancing clinical decision-making and patient outcomes through high sensitivity and specificity. Integrating diverse data types, including clinical and radiomic data, significantly improves predictive accuracy. However, methodological disparities and limited external validation challenge the reliability and reproducibility of these models. Future research should emphasize prospective study designs, standardized reporting practices, and policy changes to integrate ML assessments into routine clinical workflows. By prioritizing methodological rigor and transparency, the clinical community can fully leverage ML models to transform AIS management and improve patient prognoses.
Supplemental Material
sj-pdf-2-cat-10.1177_10760296241279800 - Supplemental material for Advanced Machine Learning Models for Predicting Post-Thrombolysis Hemorrhagic Transformation in Acute Ischemic Stroke Patients: A Systematic Review and Meta-Analysis
Supplemental material, sj-pdf-2-cat-10.1177_10760296241279800 for Advanced Machine Learning Models for Predicting Post-Thrombolysis Hemorrhagic Transformation in Acute Ischemic Stroke Patients: A Systematic Review and Meta-Analysis by You-li Jiang, Qing-shi Zhao, Ao Li, Zong-bi Wu, Lin-lin Liu, Fu Lin and Yan-feng Li in Clinical and Applied Thrombosis/Hemostasis
Supplemental Material
sj-docx-3-cat-10.1177_10760296241279800 - Supplemental material for Advanced Machine Learning Models for Predicting Post-Thrombolysis Hemorrhagic Transformation in Acute Ischemic Stroke Patients: A Systematic Review and Meta-Analysis
Supplemental material, sj-docx-3-cat-10.1177_10760296241279800 for Advanced Machine Learning Models for Predicting Post-Thrombolysis Hemorrhagic Transformation in Acute Ischemic Stroke Patients: A Systematic Review and Meta-Analysis by You-li Jiang, Qing-shi Zhao, Ao Li, Zong-bi Wu, Lin-lin Liu, Fu Lin and Yan-feng Li in Clinical and Applied Thrombosis/Hemostasis
Footnotes
Acknowledgments
We extend our deepest gratitude to Professor Qingshi Zhao and Professor Yanfeng Li for their invaluable guidance throughout this study. We are also immensely grateful to Director Zongbi Wu for his insightful assistance, particularly in the methodological facet of our research.
Author Contributions
Z. W. and Q.Z. designed this study. Y.J., A.L., F.L., and L.L. extracted data. Y.J. and A.L. performed the statistical analyses. Y.L. and Q.Z. performed the literature search, collected the data. Y.J. wrote the manuscript. All authors provided critical feedback and contributed to the final manuscript. Correspondence and requests for materials should be addressed to Y.J.
Declaration of Conflicting Interests
The authors declare that there are potential conflicts of interest with respect to the research, authorship, and publication of this article.
Funding
The author(s) disclosed receipt of the following financial support for the research, authorship, and/or publication of this article: the project “the Scientific Research Projects of Medical and Health Institutions of Longhua District, Shenzhen” with grant number 2020101.
Supplemental Material
Supplemental material for this article is available online.
References
Supplementary Material
Please find the following supplemental material available below.
For Open Access articles published under a Creative Commons License, all supplemental material carries the same license as the article it is associated with.
For non-Open Access articles published, all supplemental material carries a non-exclusive license, and permission requests for re-use of supplemental material or any part of supplemental material shall be sent directly to the copyright owner as specified in the copyright notice associated with the article.