
Abstract
This study aimed to create machine learning models for predicting early neurological deterioration and risk classification in acute ischemic stroke (AIS) before intravenous thrombolysis (IVT). The study included 704 AIS patients categorized into END and non-END groups. The least absolute shrinkage and selection operator (LASSO) regression was employed to select the best predictors from clinical indicators, leading to the creation of Model 1. Univariate and multivariate logistic regression analyses identified independent predictive factors for END from inflammatory cell ratios. These factors were combined with clinical indicators, forming Model 2. Receiver operating characteristic (ROC) curves assessed the models’ predictive performance. Key variables for Model 1 included the NIHSS score, systolic blood pressure, and lymphocyte percentage. Neutrophil-to-Lymphocyte ratio, Platelet-to-Neutrophil ratio, and Platelet-to-Lymphocyte ratio independently predicted END. Model 1 exhibited moderate predictive ability (AUC 0.721 in training, AUC 0.635 in test). Model 2, which integrated clinical indicators and inflammatory cell ratios, demonstrated strong performance in both training (AUC 0.862) and test (AUC 0.816). Machine learning models, combining clinical indicators and inflammatory cell ratios before IVT, accurately predict END and associated risk in AIS.
Introduction
Acute ischemic stroke (AIS) has emerged as a leading cause of mortality and disability in the human population. 1 Intravenous thrombolysis (IVT) has gained widespread acceptance as a primary therapeutic approach for AIS, owing to its broad availability and convenience.2,3 However, a subset of patients may encounter early neurological deterioration within the critical 24–72 h window following IVT, marked by a progressive worsening of symptoms. 4 END is typically characterized by a notable surge of either 2 or 4 points in the National Institutes of Health Stroke Scale (NIHSS) score during this critical period.5–8 This deterioration often results in severe neurological dysfunction and unfavorable clinical outcomes,4,6,9,10 underscoring the imperative need for early detection of END in AIS patients to inform treatment decisions and prognosis.
Clinical predictive factors for END in AIS encompass the NIHSS score at admission, diabetes, hypertension, history of atrial fibrillation, and high-density lipoprotein-cholesterol.11–13 Additionally, a range of biomarkers, including total cholesterol, triglycerides, white blood cells, and blood glucose, have been identified as indicators associated with a heightened risk of END. 14 The pivotal role of neuronal inflammatory response in the pathophysiology of ischemic stroke has been extensively documented.15–17 Peripheral inflammatory processes involving white blood cells, neutrophils, monocytes, and macrophages contribute to cerebral ischemic injury through diverse mechanisms, including hampered red blood cell flow, intensified vascular constriction, inflammatory mediator release, and platelet aggregation. 18 Recent investigations have unveiled noteworthy connections between the NLR (neutrophil-to-lymphocyte ratio), PLR (platelet-to-lymphocyte ratio), LMR (lymphocyte-to-monocyte ratio), and the occurrence of END following IVT.19,20 Intertwining these inflammatory cell ratios with clinical indicators has the potential to heighten the precision of END prediction subsequent to thrombolysis.
Machine learning, a vital component of Artificial Intelligence, aims to construct efficient models to classify, predict, and estimate by learning from extensive and complex datasets. 21 In recent years, the medical research field has extensively explored and adopted machine learning techniques, including their application in predicting the prognosis and forecasting bleeding transformation in AIS patients undergoing endovascular treatment and rt-PA thrombolysis.22–24 These studies have achieved significant advancements, offering novel approaches and perspectives to enhance patient prognosis and treatment decision-making.
The core objective of this study was to construct a machine-learning model capable of integrating patient-specific clinical indicators and inflammatory cell ratios before thrombolysis. Furthermore, we sought to significantly elevate the accuracy in forecasting the risk of END among patients with AIS.
Methods
Patient Selection
The study followed the Declaration of Helsinki and received approval from the Ethics Committee of our hospital (approval code: 2019A062). A retrospective analysis was conducted on AIS patients who underwent rt-PA intravenous thrombolysis at the Stroke Center of our hospital during the period from January 1, 2019, to July 31, 2022. The inclusion criteria encompassed individuals aged ≥18 years with a confirmed diagnosis of AIS based on CT or MRI, who received IVT within 4.5 h of stroke onset. Patients were excluded if they received bridging endovascular treatment after IVT, had incomplete clinical and laboratory data, or were discharged or deceased within 24 h.
Clinical Indicators and Inflammatory Cell Ratios
Demographics: age, gender, height, weight, and BMI;
Comorbidities: prior stroke, atrial fibrillation, diabetes, hypertension, coronary artery disease, and myocardial infarction;
Personal history: smoking and drinking habits (smoking refers to current smokers or those who quit smoking less than 6 months ago; drinking refers to current drinking habits).
Clinical assessment: temperature, heart rate, SBP, DBP, DNT, OTT, baseline NIHSS score.
Medication history: antiplatelet agents, antihypertensive agents, antidiabetic agents, lipid-lowering agents.
Initial laboratory tests: white blood cell count, red blood cell count, platelet count, lymphocyte count, monocyte count, neutrophil count, eosinophil count, basophil count, monocyte percentage, lymphocyte percentage, neutrophil percentage, eosinophil percentage, basophil percentage, creatinine, glucose, glycated hemoglobin, sodium, potassium, chloride, calcium, magnesium, phosphorus, alkaline phosphatase, cholinesterase, and lipid panel: triglycerides, total cholesterol, high-density lipoprotein cholesterol, low-density lipoprotein cholesterol, apolipoprotein A1, apolipoprotein B, lipoprotein(a), homocysteine.
Inflammatory cell ratios: NLR (neutrophil-to-lymphocyte ratio), PNR (platelet-to-neutrophil ratio), NER (neutrophil-to-eosinophil ratio), PLR (platelet-to-lymphocyte ratio), and LMR (lymphocyte-to-monocyte ratio).
These comprehensive data sets were essential for the study's analysis and predictive modeling.
Definition of END
Stroke seriousness was assessed using the NIHSS score. In this research, END was determined as an NIHSS score rise of ≥2 points within 72 h of hospitalization.7,25 We specifically chose this criterion for END due to its reduced susceptibility to inter-rater variability and its ability to differentiate END from subsequent neurological declines primarily caused by stroke-related factors, such as aspiration pneumonia or stroke recurrence. 25
Variable Selection and Establishment of Machine Learning Models
The study participants were randomly divided into training and testing groups at a 7:3 ratio. Following this, the clinical indicators underwent standardization, and the LASSO (Least Absolute Shrinkage and Selection Operator) method was applied. This involved incorporating a 10-fold cross-validation procedure with the goal of maximizing the area under the Receiver Operating Characteristic (ROC) curve. This approach facilitated the identification and selection of the most optimal clinical indicators for further analysis.
The selected clinical indicators were integrated into a machine learning model that utilized a logistic regression classification algorithm, resulting in the creation of Model 1. Additionally, inflammatory cell ratios (including NLR, PNR, NER, PLR, and LMR) were manually computed based on laboratory results of inflammatory cell counts. Univariate and multivariate logistic regression analyses were conducted to pinpoint independent predictors of early neurological deterioration, with statistical significance set at P < .05. Subsequently, the selected inflammatory cell ratios were incorporated with the chosen clinical indicators to construct a combined model (Model 2). Finally, a nomogram was generated for further analysis.
Statistical Analysis
The analysis was conducted using R software (version 4.2.2). Continuous variables were presented as either mean ± SD or median with interquartile ranges (IQRs), while categorical variables were expressed as percentages (n, %). The assessment of continuous variables included both t-tests and non-parametric Mann-Whitney U tests, while chi-square tests were used for categorical variables to discern any differences in baseline characteristics between the distinct END and non-END groups. The calibration effect was examined using the Hosmer-Lemeshow test. Machine Learning models were established utilizing a logistic regression classification algorithm implemented in Python 3.9. ROC curves were generated, and a calibration curve was employed to assess the agreement between the nomogram-predicted and actual risks. Model performance was evaluated using key metrics such as AUC, accuracy, sensitivity, and specificity.
Results
We gathered data on 771 individuals who received rt-PA intravenous thrombolysis between January 2019 and July 2022. However, 67 patients were excluded for the following reasons: bridged to endovascular treatment (n = 23), incomplete clinical data (n = 24), and discharge or death within 24 h of admission (n = 20). Consequently, we enrolled 704 patients who met the study criteria, and Figure 1 illustrates the patient inclusion process.
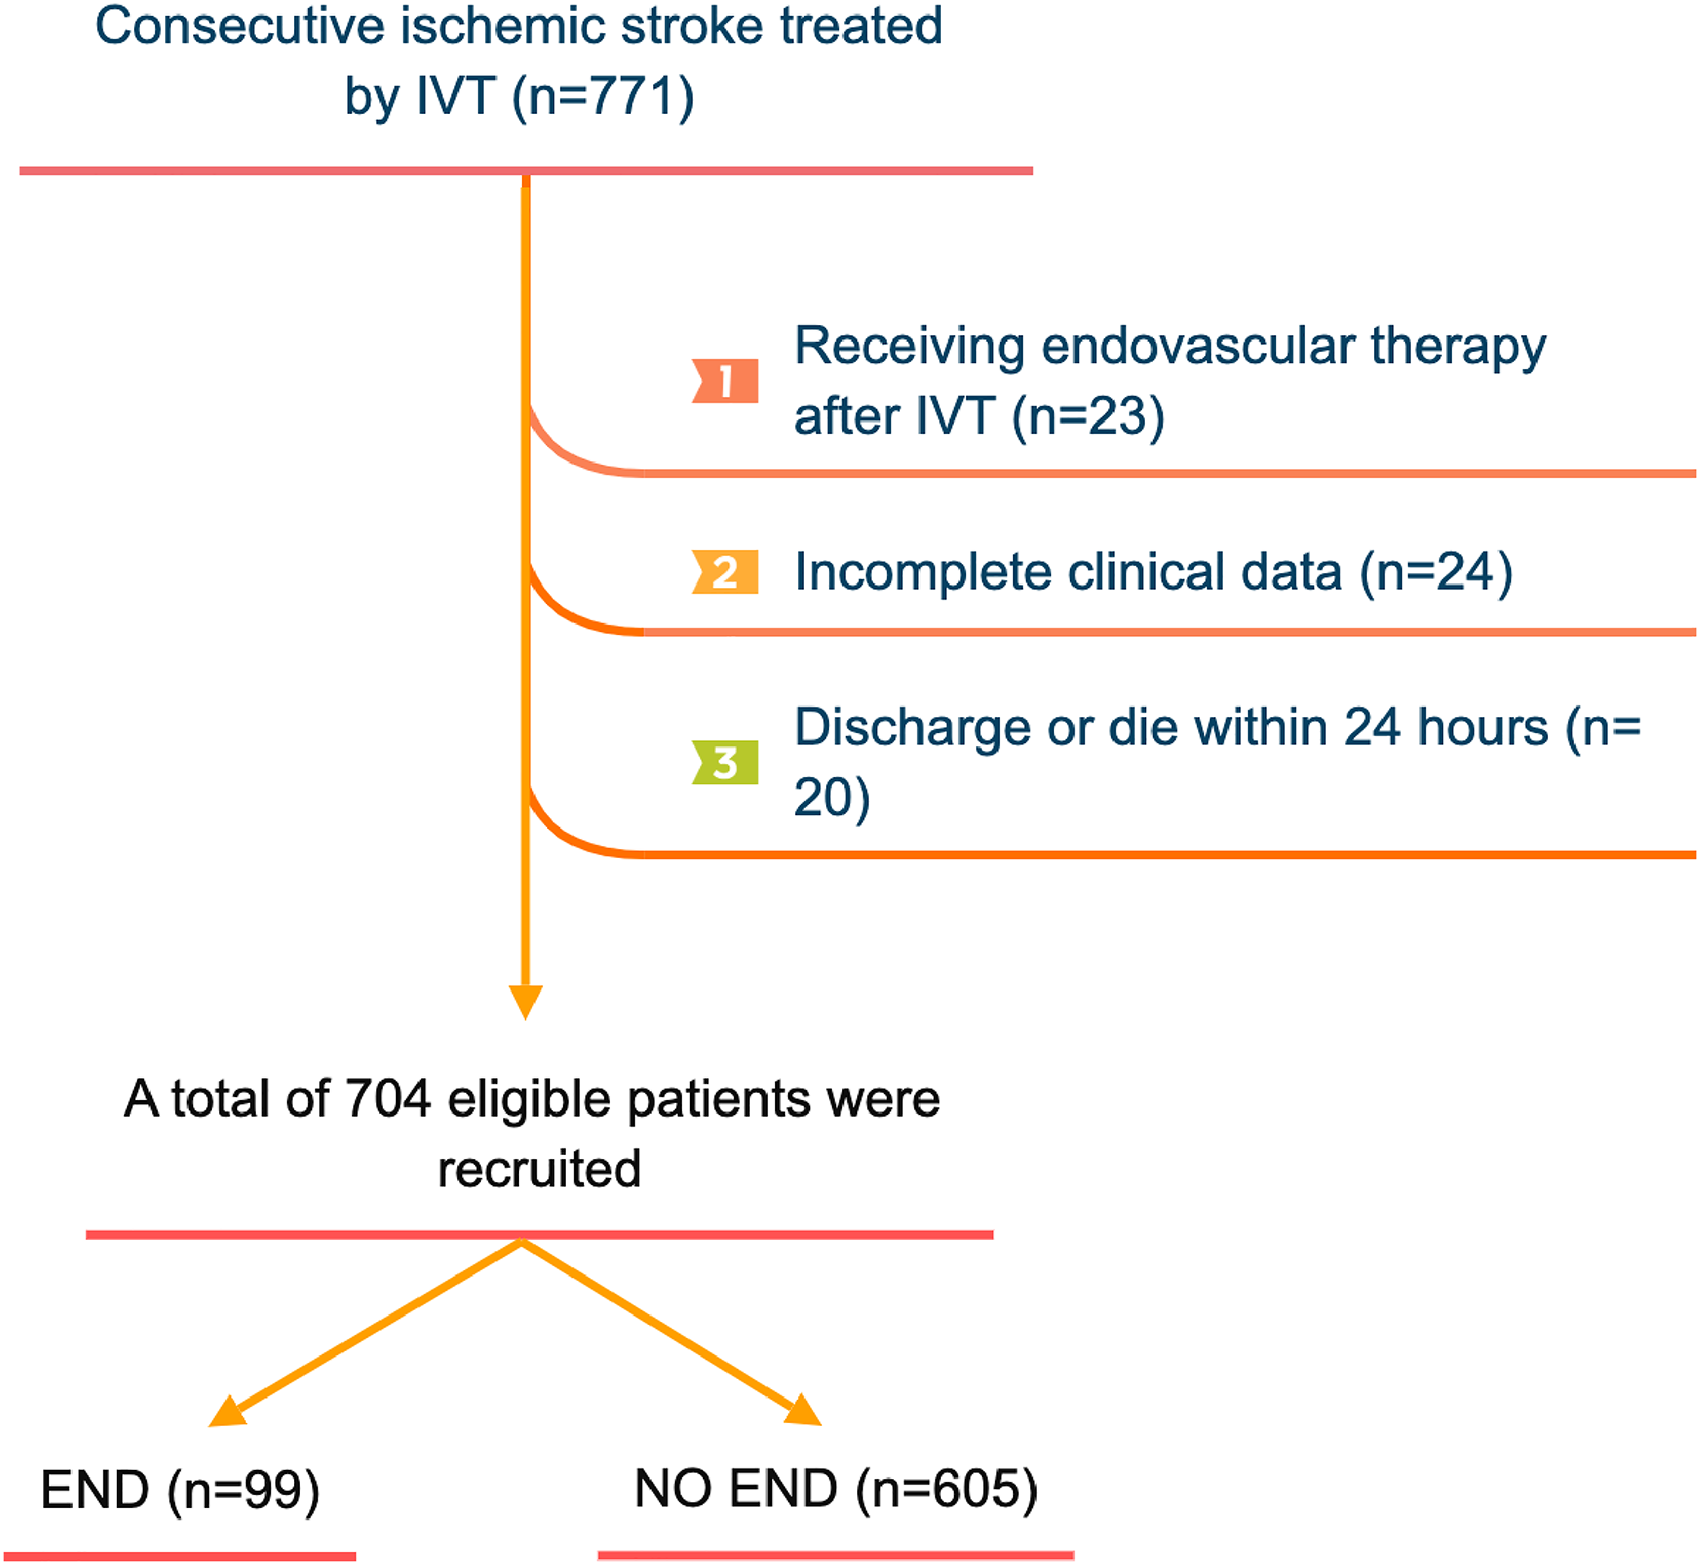
Flow chart for patients’ selection. IVT, intravenous thrombolysis; END, early neurological deterioration.
The non-END group comprised 605 patients, with a median age of 63 years and a male composition of 69.42%. The END group included 99 patients, with a median age of 67 years and a male composition of 73.74%. Table 1 presents the baseline characteristics of the patients in both groups.
Comparing Baseline Characteristics Between END and Non-END Groups in Patients.

Abbreviations: END, early neurological deterioration; BMI, body mass index; SBP, systolic blood pressure; DBP, diastolic blood pressure; DNT, door to needle time; OTT, onset to treatment time; NIHSS, National Institute of Health Stroke Scale; HbA1c, glycated hemoglobin; ApoA1, Apolipoprotein A1; Apo B, Apolipoprotein B; Hcy, Homocysteine; ALP, Alkaline phosphatase; CHE, Cholinesterase; NLR, Neutrophil-to-Lymphocyte ratio; PNR, Platelet-to-Neutrophil ratio; NER, Neutrophil-to-Eosinophils ratio; PLR, Platelet-to-Lymphocyte ratio; LMR, Lymphocyte-to-Monocyte ratio; A statistically significant disparity emerged between the two groups (P < .05).
LASSO regression was employed to identify the optimal clinical indicators. Figure 2 shows the coefficient trends of the LASSO regression feature (or variable) selection. The λ value, set at 0.03 in our study, strikes a balance between model complexity and predictive accuracy. Three features with non-zero coefficients and the largest absolute values were finally selected as variables, including NIHSS score, systolic blood pressure (SBP), and lymphocyte percentage (LYM%), as shown in Figure 3.

Feature selection based on the LASSO regression. (A) LASSO coefficient profiles. Coefficient trends plot illustrating the changes in the regression coefficients of the selected features over different values of the regularization parameter λ in LASSO regression. (B) Error bar plot depicting the variation of cross-validated errors across different values of the regularization parameter λ in LASSO regression. The vertical dashed line represents the selected λ value of 0.03 based on the 1 standard error of the minimum criteria.

Feature weight coefficient diagram.
Through rigorous univariate and multivariate logistic regression analyses, three inflammatory cell ratios were conclusively identified as independent predictors of END following intravenous thrombolysis: NLR [odds ratio (OR), 0.236; 95% confidence interval (CI), 0.202-0.337; P < .001]; PNR (OR, 0.900; 95% CI, 0.883-0.925; P < .001); and PLR (OR, 1.044; 95% CI, 1.035-1.050; P < .001) (Table 2).
Univariate and Multivariate Logistic Regression Analyses of Composite Inflammatory Ratios for Post-Thrombolysis EN.
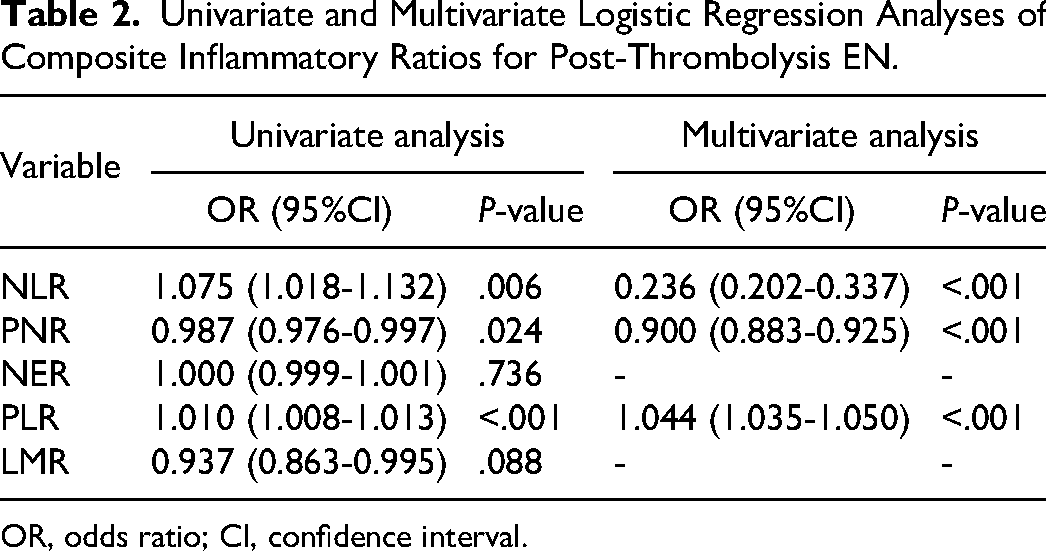
OR, odds ratio; CI, confidence interval.
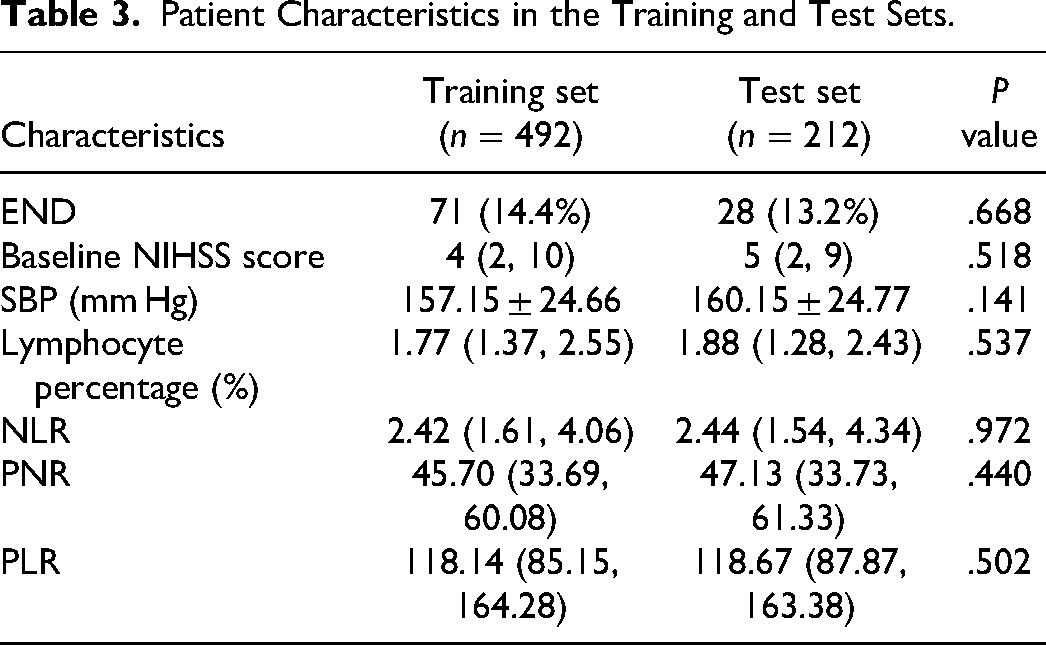
The study participants were randomly divided into training and testing groups at a 7:3 ratio. Patient characteristics in the training and test sets, respectively, are provided in Table 3. To ensure robust model assessment, we adopted a 5-fold cross-validation strategy. This involved dividing the dataset into five exclusive subsets, with four used for model training and one reserved for evaluation in each iteration. The cross-validation outcomes revealed that, within this framework, Model 2 achieved an average score of 0.857, surpassing Model 1, which scored 0.850 (refer to Table 4). This approach enhances the reliability and generalizability of our model assessments.
Patient Characteristics in the Training and Test Sets.
Cross-Validation Results for Model Performance.

The two models’ propensity to forecast END following IVT in AIS patients was evaluated using ROC curves (Figure 4). The AUC values of training and test sets for the model 1 based on NIHSS score, systolic blood pressure, and lymphocyte percentage were 0.721 (95% CI, 0.651-0792; sensitivity, 54.9%; specificity, 83.1%), 0.635 (95% CI, 0.518-0752; sensitivity, 39.3%; Specificity, 85.9%), respectively. The training and test set AUC values of model 2, which combined the inflammatory cell ratios (NLR, PNR, and PLR), were 0.862 (95% CI, 0.806-0.917; sensitivity, 93.0%; specificity, 69.1%) and 0.816 (95% CI, 0.717-0.915; sensitivity, 85.7%; specificity, 74.5%, respectively (Table 5).
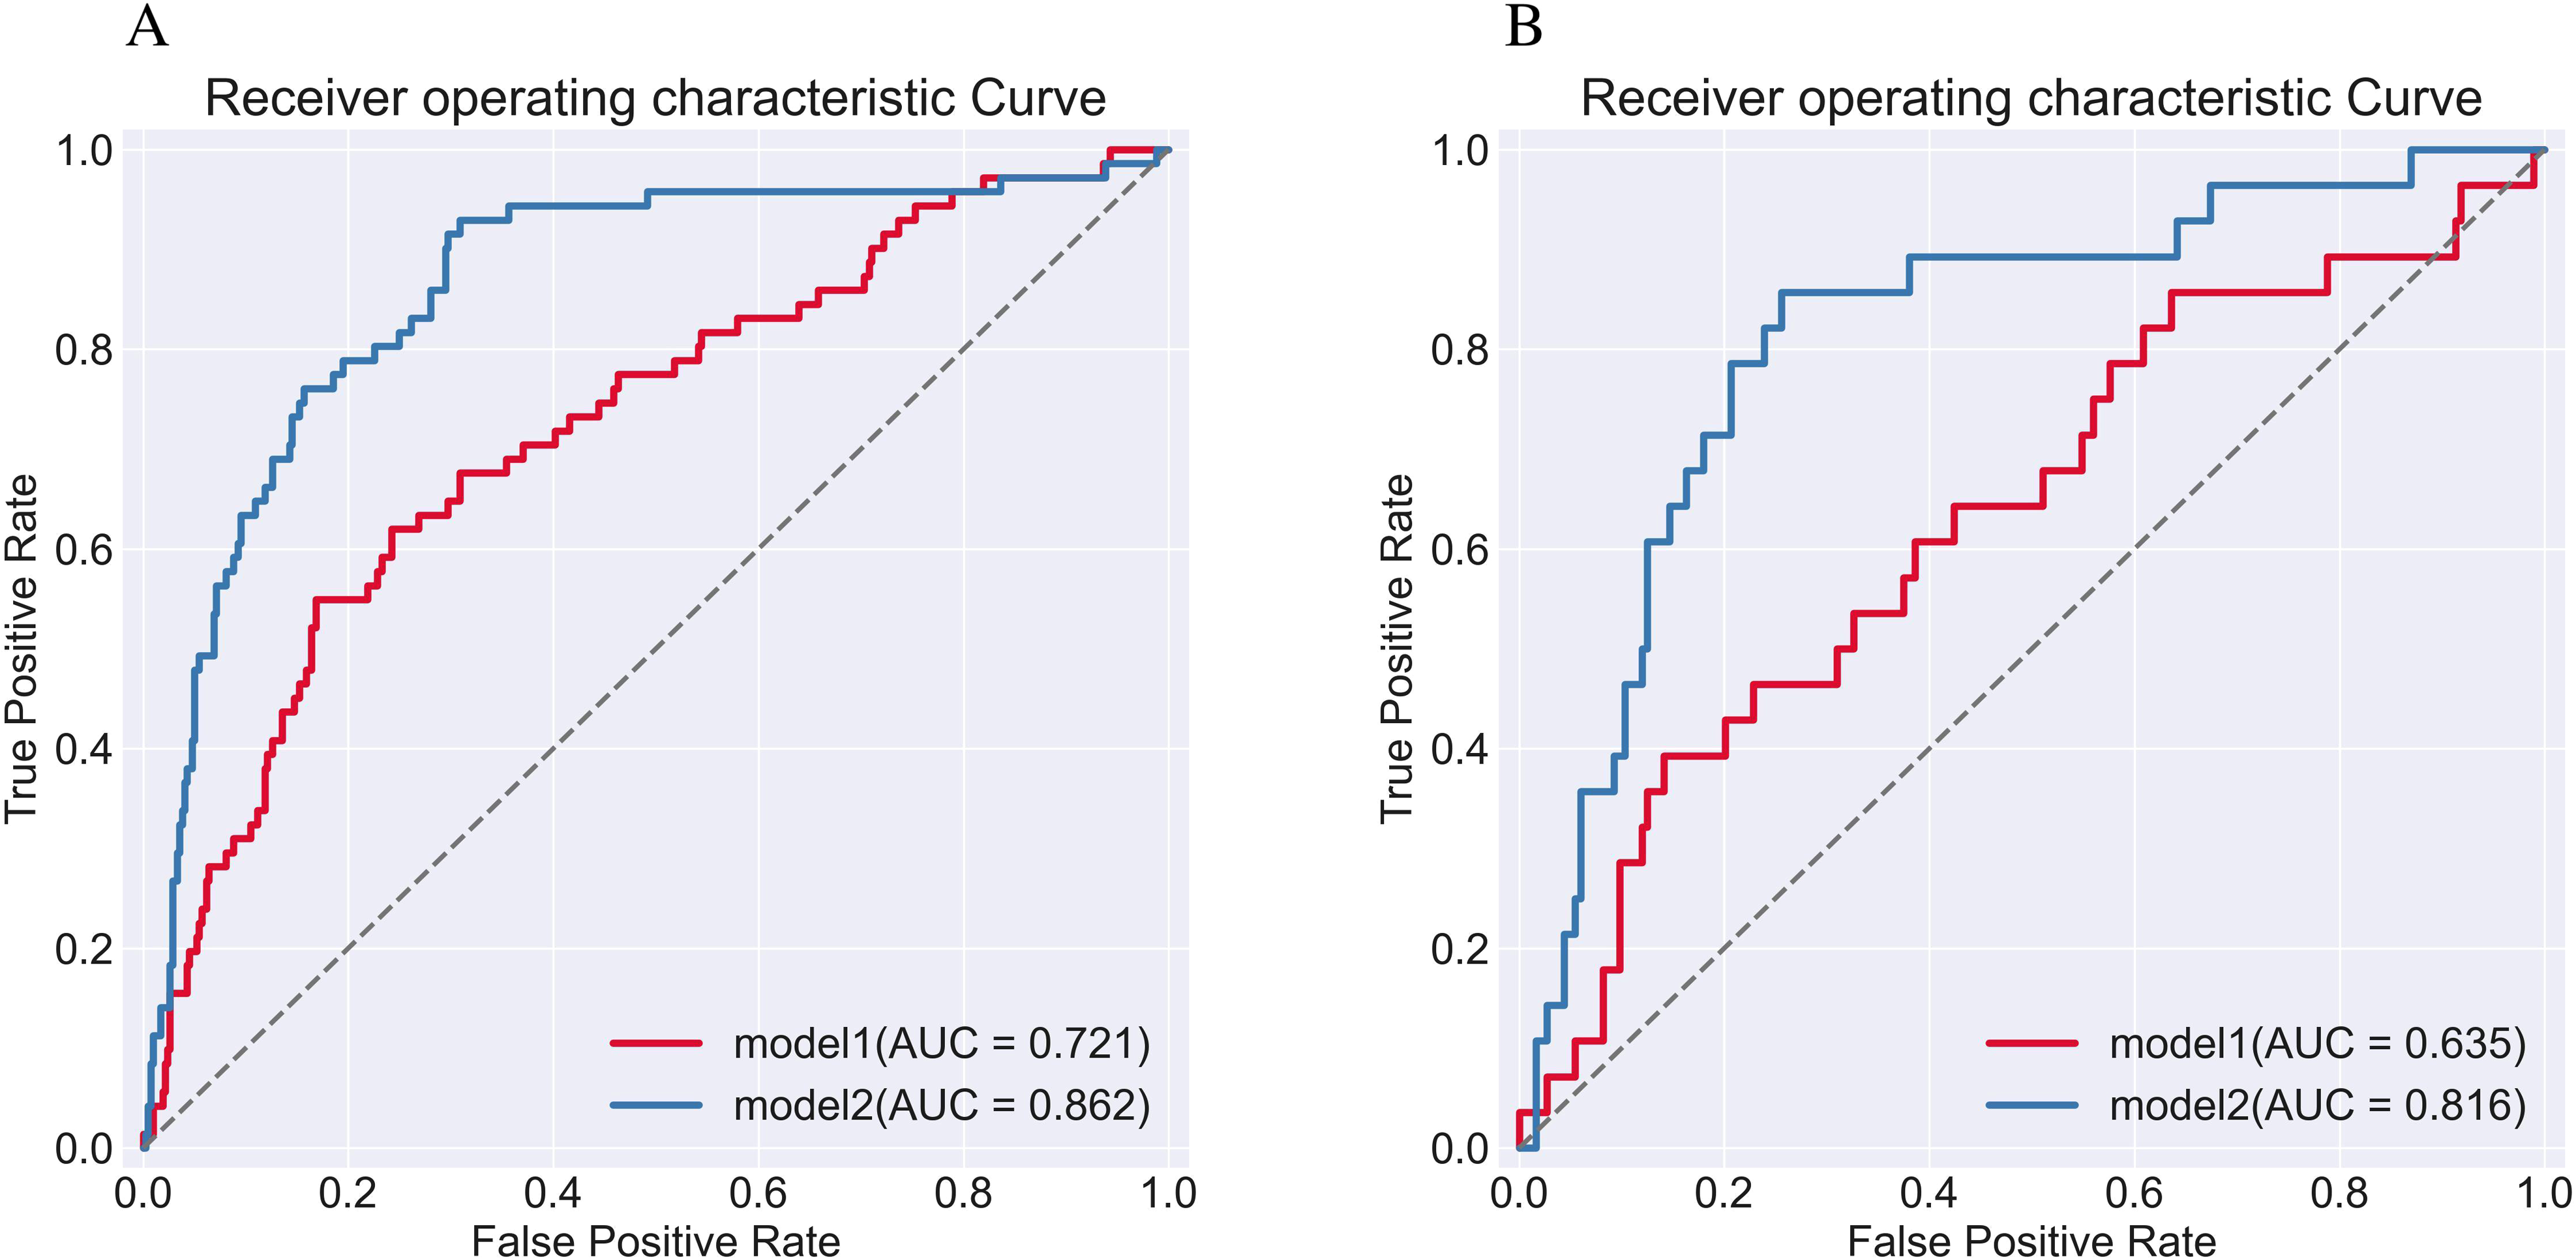
ROC curves for two predictive models: model 1 utilizing clinical indicators alone and model 2 combining clinical indicators with inflammatory cell ratios, in the prediction of post-thrombolysis END. Panels A and B display the ROC curves for the training and test sets.
Performance of the Machine Learning Models for Each Dataset.

Figure 5 shows the nomogram established based on the six predictors in model 2, and the sum of the scores allowed the researcher to independently predict the risk of END. The calibration curve fits the probabilities well (Hosmer-Lemeshow test, P = .449) (Figure 6).

Nomogram for predicting risk classification of post-thrombolysis END. The nomogram was built with the NIHSS, systolic blood pressure (SBP), lymphocyte percentage (LYM%), NLR, PNR, and PLR. The probability associated with each predictor can be translated into scores based on the top scale points of the nomogram. By summing up the scores from all predictors, the corresponding prediction probability is obtained at the bottom of the nomogram.
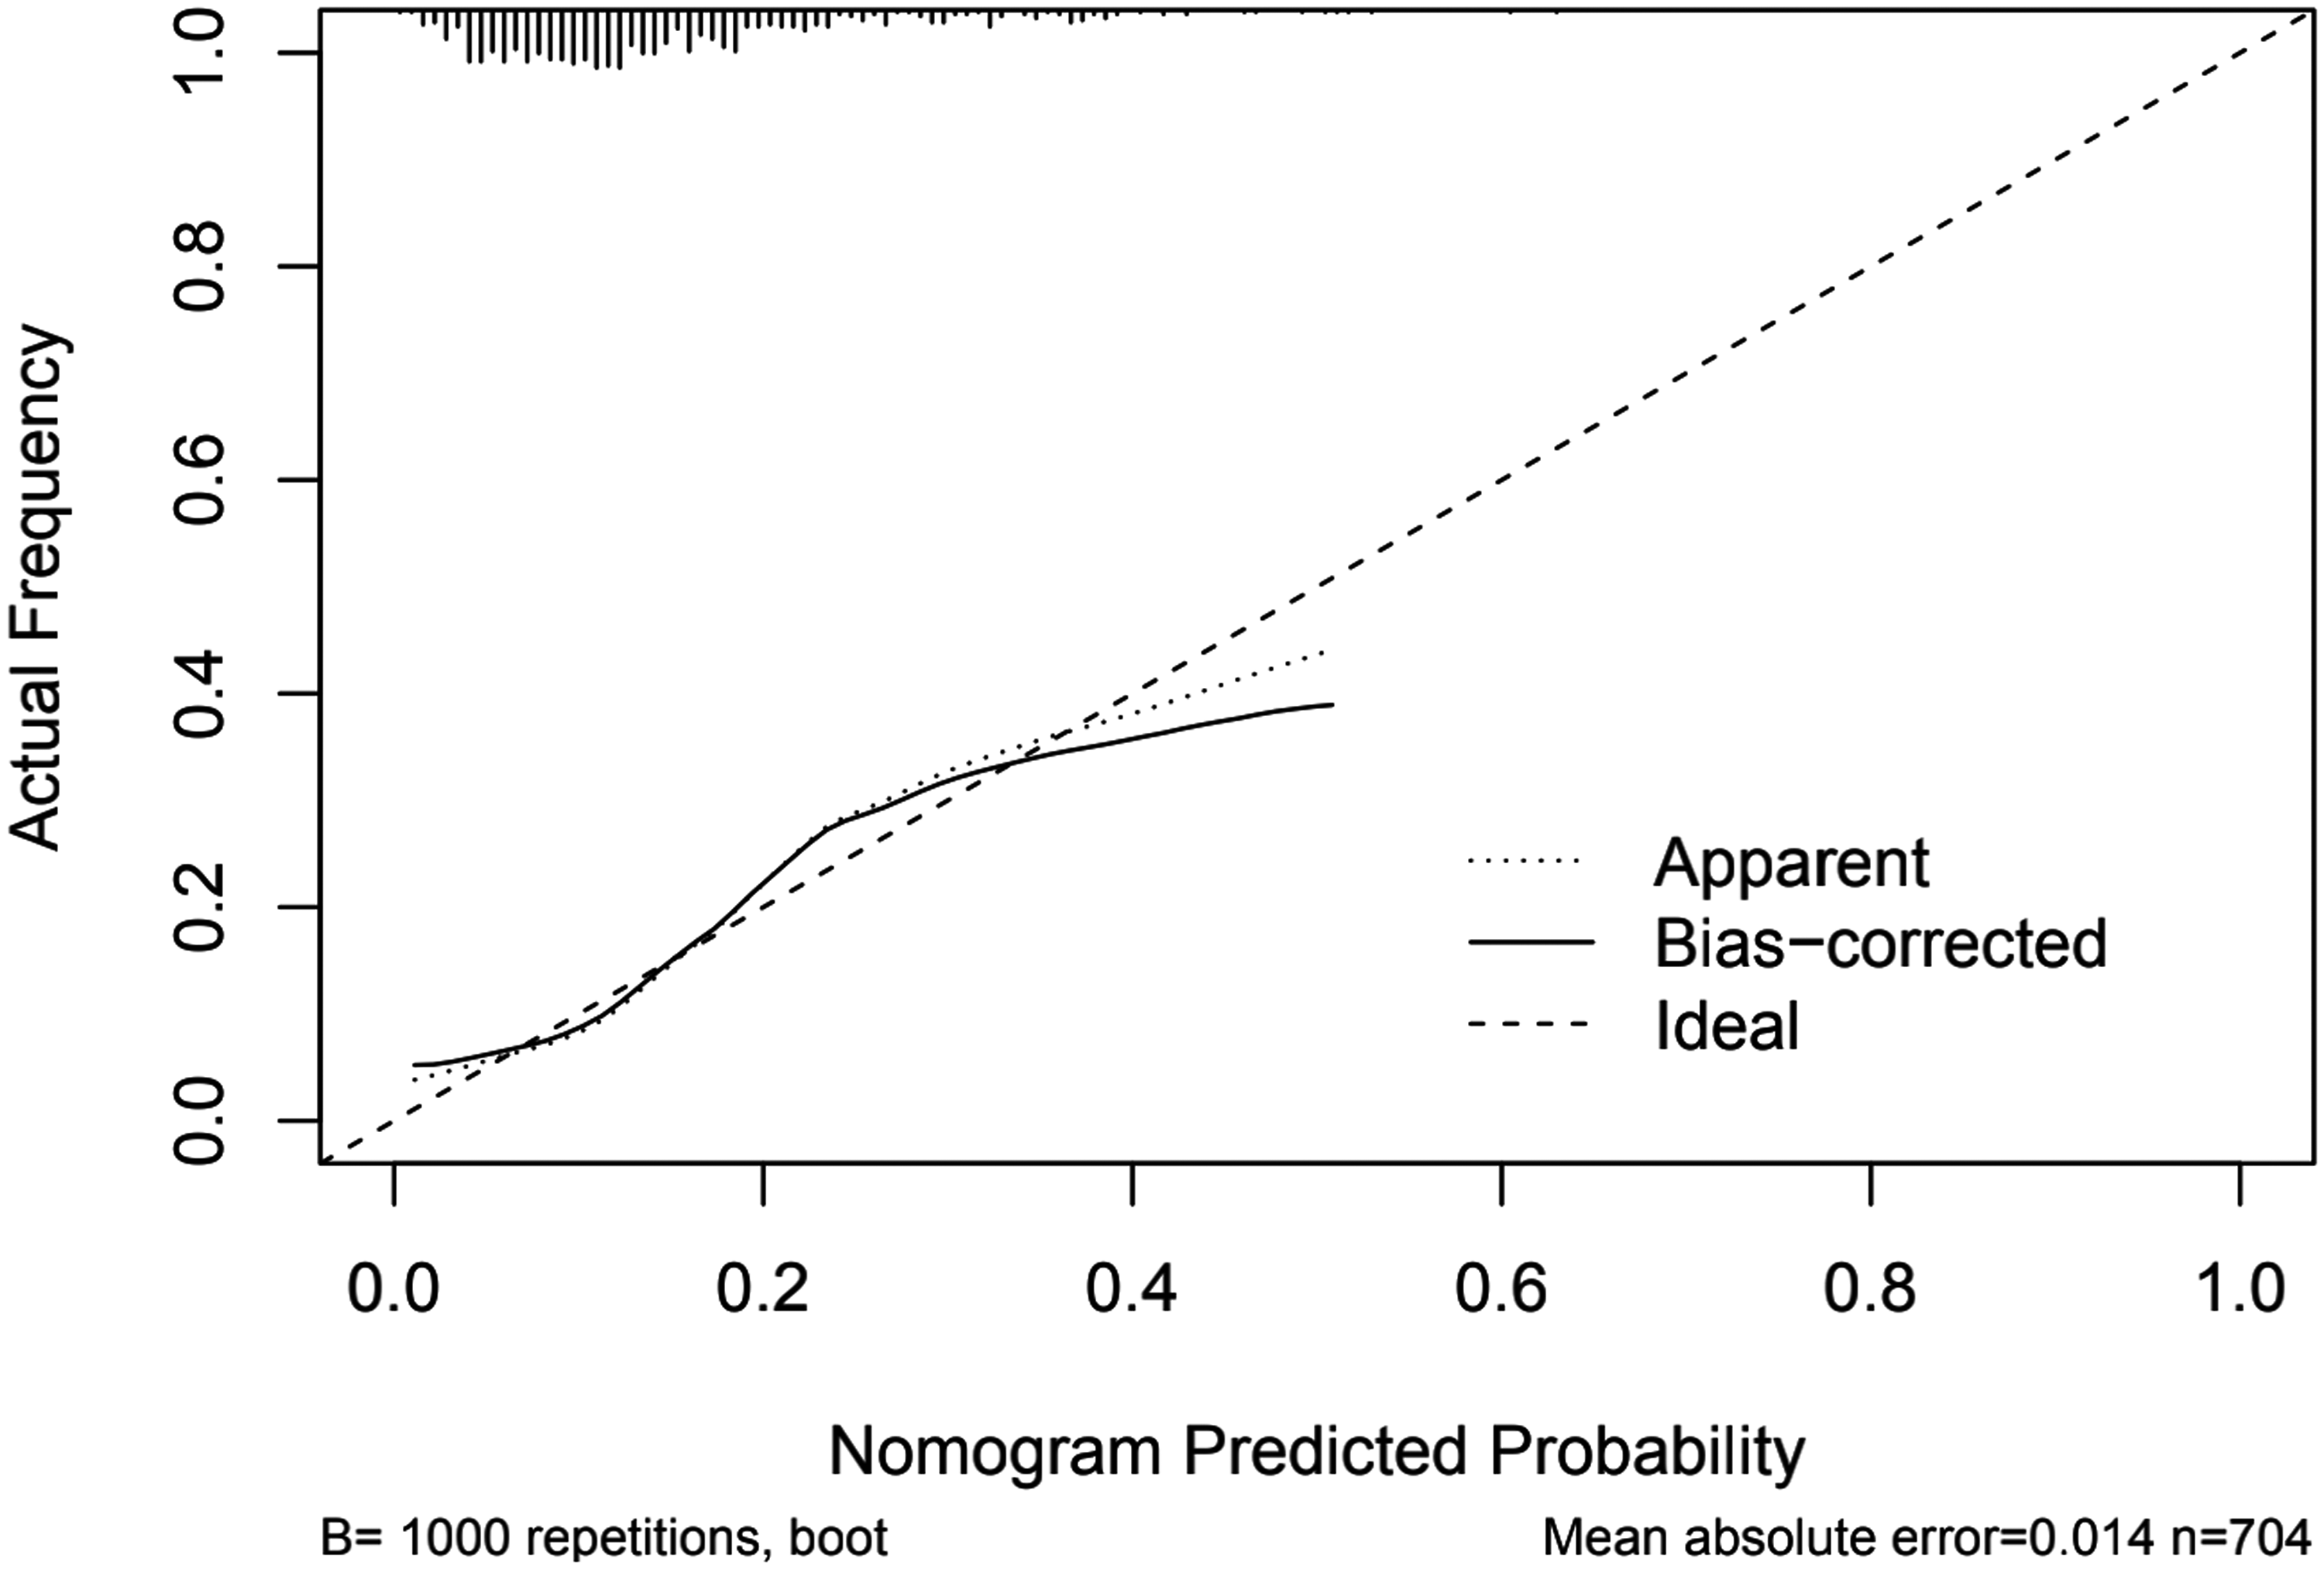
Calibration curve based on the entire dataset. The calibration curve visually evaluates the predictive model's alignment and accuracy by comparing the predicted probabilities with the actual outcomes. A well-calibrated curve with points close to the diagonal line indicates accurate predictions, while deviations suggest potential bias or miscalibration.
Discussion
In this retrospective study, we developed and validated two machine learning models, utilizing clinical indicators and inflammatory cell ratios, to predict END following IVT treatment in patients with AIS. The findings indicate that the combined model (Model 2), which incorporates both inflammatory cell-related ratios and clinical indicators, can effectively predict the risk of END in AIS patients prior to IVT administration. This novel approach holds promising potential for enhancing risk assessment and patient management in the context of AIS treatment.
We employed the LASSO regression method to identify the most significant clinical indicators associated with the risk of END as variables to construct Model 1. Specifically, the variables selected for inclusion in Model 1 were the NIHSS score at admission, systolic blood pressure, and lymphocyte percentage. These three variables emerged as the key determinants that significantly contribute to the prediction of END, effectively enhancing the model's predictive accuracy and clinical relevance. The rigorous use of LASSO regression in the variable selection process ensures the optimal subset of predictors, enabling a more focused and refined prediction of END risk in patients under investigation.
In our study, lymphocyte percentage is an important predictor. Based on previous research, it is postulated that lymphocytes possess neuroprotective properties and contribute to the enhancement of cerebral function. 26 Lymphocytes control the inflammatory pathway by coordinating, healing, and repairing inflammation, infiltrating ischemic tissue, and mediating inflammatory reactions. Enhancing anti-inflammatory cytokine levels and suppressing the production of pro-inflammatory cytokines may mitigate blood-brain barrier damage, decrease the risk of cerebral edema, and attenuate infarct volume. 27 An elevated lymphocyte count can enhance the anti-inflammatory impact of interleukin (IL)-10 and suppress pro-inflammatory cytokines, such as IL-6 and TNF-α, thus offering neuronal protection. 28 On the other hand, lower lymphocyte count and percentage are linked to a worse functional prognosis in AIS patients.28,29
The NIHSS is extensively employed as a standardized tool to comprehensively evaluate the clinical severity of stroke cases. Several studies have demonstrated that the initial NIHSS score autonomously functions as a risk factor for END subsequent to IVT, whereby elevated scores exhibit a direct correlation with escalated risk of END occurrence. 30 Recently, a comprehensive analysis further reinforced the significance of the initial NIHSS score as a crucial clinical feature influencing END, which aligns with the outcomes observed in our present investigation. 31
Following an ischemic stroke, the body may increase systolic blood pressure to ensure constant cerebral perfusion. 32 While the mechanism by which SBP promotes the onset of END is unclear, one study discovered that MMP-9 and AQP-4 levels were proportional to 24 h of blood pressure after IVT, therefore, they hypothesized that the onset of END may be related to the disruption of the blood-brain barrier induced by oxidative stress and the upregulation of AQP-4. 33 Conversely, elevated SBP poses a heightened risk of cerebral edema, hemorrhagic transformation, and stroke recurrence, all of which are closely linked to an unfavorable prognosis in individuals with ischemic stroke. 34 Additionally, previous studies have reported that an elevated baseline SBP is associated with a heightened risk of END in AIS patients, 35 a correlation that aligns with the results of our current study.
Although Model 1 demonstrated certain predictive capability for assessing the risk of END after intravenous thrombolysis (IVT) in AIS patients, with respective AUC values of 0.721 and 0.635 in the training and test sets, we sought to further enhance the diagnostic power of the model by incorporating inflammatory cell ratios. Through univariate and multivariate logistic regression analyses, we identified NLR, PNR, and PLR as independent predictors of END after IVT (OR, 0.236, 0.900, 1.044). The integration of these inflammation cell ratios into Model 2 significantly improved its predictive performance, resulting in an AUC value of 0.862 in the training set and 0.816 in the test set.
The precise mechanism underlying END in ischemic stroke remains ambiguous. After a stroke, the inflammatory response is promptly triggered by the release of inflammatory mediators from damaged brain tissue. Microglia, acting as resident macrophages in the brain, become activated, and circulating immune cells are recruited to the site of injury. 36 One of the earliest events in the inflammatory cascade is the significant influx of polymorphonuclear cells and monocytes, which subsequently differentiate into macrophages within the brain. During the acute phase, these infiltrated leukocytes produce inflammatory cytotoxic mediators that induce cellular injury, increase capillary permeability, and activate pro-thrombotic pathways, ultimately exacerbating ischemic injury, promoting edema development, and contributing to the secondary progression of tissue damage.37,38 However, evidence points to neutrophils as the primary peripheral immune cells infiltrating the ischemic region. 39 Once activated, neutrophils secrete harmful substances and inflammatory mediators, intensifying ischemic injury and potentially leading to hemorrhagic transformation. Additionally, elevated neutrophil levels have been associated with an unfavorable prognosis in cases of mild ischemic stroke.40,41 Platelets undergo activation in response to multiple stimuli, such as inflammation and atherosclerosis. This activation prompts the aggregation of platelets at sites of injured endothelial cells, where they release pro-inflammatory mediators. Furthermore, activated platelets contribute to the progression of atherosclerosis, culminating in the rupture of atherosclerotic plaques and the initiation of ischemic events. 42 Numerous studies have provided insights into the process whereby activated platelets release specific chemicals, leading to leukocyte aggregation and interactions with leukocytes and neutrophils. 43 Consequently, this cascade exacerbates both inflammation and thrombosis. It has also been shown that AIS may lead to abnormal platelet function and that excessive platelet activation and accumulation may impede stroke recovery. 44 Acute brain injury elevates catecholamine and cortisol levels, leading to peripheral lymphocyte apoptosis and functional deactivation. 45 Lymphocyte loss impairs host defense, increasing susceptibility to infections—a common post-stroke complication that worsens the clinical course.46,47 Specific regulatory lymphocyte subsets maintain immune balance, acting as neuroprotective modulators by countering pro-inflammatory mediators, modulating microglia activation, restraining autoreactive cells, and promoting neurogenesis and repair processes in the ischemic region.48–50
Hence, single biochemical indicators have limitations in accurately reflecting the progression of AIS. NLR, PLR, and PNR serve as robust indicators of cellular immune activity, encompassing thrombosis formation, immune-inflammatory pathways, and systemic inflammatory response. As comprehensive measures, they hold promising potential for achieving strong predictive effects. Lattanzi et al observed that the Systemic Inflammatory Response Index (SIRI) serves as a predictor of futile endovascular reperfusion, and there is an increased risk of END with rising NLR. The optimal predictive cut-off value for NLR was determined as 6.4, with an END incidence of 24.1% for patients with NLR ≥ 6.4 and 3.9% for those with NLR < 6.4.51,52 NLR and PLR have been linked to an elevated risk of hemorrhagic transformation and unfavorable prognosis in AIS patients.53–55 Gong et al identified that PLR and NLR independently predicted END post-IVT. 19 Additionally, Wang et al reported an independent association between PNR and END in the IVT group, 56 corroborating our perspective.
It is important to note that there are certain limitations to this particular study. Firstly, it is a single-center retrospective study, and it would be ideal to validate the findings with a larger data set from various sources. Secondly, only a few biochemical indicators were considered during admission, and this may have resulted in some important data being omitted during feature selection.
Conclusion
The integration of a machine learning model and nomogram, which incorporate clinical indicators and inflammatory cell ratios before IVT, exhibits a remarkable capacity to accurately predict the occurrence of END and assess its associated risk probability in AIS patients. This approach holds significant clinical relevance as it empowers clinicians to make informed and precise treatment decisions, potentially leading to more tailored and effective management strategies for AIS patients. The predictive power of these models represents a promising advancement in stroke care, offering valuable insights into the individualized risk assessment and prognosis evaluation for patients undergoing IVT therapy.
Footnotes
Acknowledgments
We gratefully thank all the patients and all the staff associated with this study.
Declaration of Conflicting Interests
The authors declared no potential conflicts of interest with respect to the research, authorship, and/or publication of this article.
Funding
The authors received no financial support for the research, authorship, and/or publication of this article.
Ethics Approval and Consent to Participate
This study received ethical approval from the Ethics Committee of the First Hospital of Qinhuangdao (approval code:2019A062) on December 26, 2018. This is a retrospective study, all patient information was deidentified and patient consent was not required.
Data Availability Statement
The datasets generated and/or analyzed during the present study are available from the corresponding author upon reasonable request.