
Abstract
We aimed to explore the relationship between pulmonary artery distensibility obtained from computed tomography pulmonary angiography (CTPA) and short-term adverse clinical outcomes in patients with acute pulmonary embolism (APE). We included patients who underwent retrospective electrocardiogram-gated CTPA and were subsequently diagnosed with APE. Patients were categorized into good and poor outcome groups based on short-term clinical outcomes. Pulmonary artery distensibility (AD), right ventricle/left ventricle (RV/LV) ratio, and pulmonary artery obstruction index (PAOI) were measured, and the receiver operating characteristic curves were constructed. Sixty-four patients with APE (good outcome, 46; poor outcome, 18) were enrolled. AD, RV/LV ratio, and PAOI differed significantly between groups (P < 0.05). Pulmonary artery AD in the good outcome group was greater than that in the poor outcome group (P < 0.001). The poor outcome group exhibited a higher RV/LV ratio and PAOI than the good outcome group (P < 0.05). AD and PAOI were independent predictors of adverse clinical outcomes. Areas under the curve for AD and PAOI were 0.860 (95% confidence interval [CI]: 0.750–0.934) and 0.675 (95%CI: 0.546–0.786), and the combined curve of the AD and RV/LV ratio was 0.906 (95%CI: 0.806–0.965). The calibration curve showed a combined curve superior to the other curves. The decision curve showed high clinical application value of the combined curve. Retrospective electrocardiogram-gated CTPA-derived AD could serve as an indicator for predicting short-term adverse clinical outcomes in APE. Combining AD and PAOI has a high predictive value for short-term adverse clinical outcomes.
Keywords
Introduction
Acute pulmonary embolism (APE) is a critical clinical condition with a mortality rate of 18%, ranking second in prevalence to acute myocardial infarction and stroke. 1 Computed tomography pulmonary angiography (CTPA) is the recommended initial diagnostic test for APE. CTPA can also be used to evaluate the severity and clinical prognosis of APE. The 2019 European Society of Cardiology (ESC) guidelines clearly indicate that a right ventricle/left ventricle (RV/LV) ratio greater than or equal to 1.0 is considered a reliable indicator of right heart dysfunction 1 ; this ratio has been widely recognized as a reliable indicator for poor prognosis in patients with APE. 2 The ability of the pulmonary artery obstruction index (PAOI) to accurately assess the severity and adverse clinical outcomes of APE remains controversial. Research suggests that CTPA-derived PAOI can only provide morphological information about emboli. As such, establishing a direct link between the PAOI and right ventricular load to reliably evaluate the prognosis of patients with APE remains challenging. 3
The pulmonary artery, similar to the aorta, exhibits elasticity. Few researchers have performed studies on noninvasive radiologic techniques to evaluate pulmonary artery elasticity because most studies focus on the aorta and carotid arteries.4–6 Some researchers have used ultrasound or magnetic resonance imaging (MRI), whereas few have reported using CT.7–9 Retrospective electrocardiogram-gated CTPA enables clinicians to observe changes in the cross-sectional area of the pulmonary artery during systole and diastole which can be quantitatively analyzed. Consequently, the AD, which serves as a measure of pulmonary artery elasticity, can be calculated. Our previous study confirmed that retrospective electrocardiogram-gated CTPA is a viable method for assessing pulmonary artery distensibility. 10 The purpose of the current study was to explore the prognostic value of the pulmonary artery distensibility, RV/LV ratio, and PAOI in evaluating short-term adverse clinical outcomes of APE using the noninvasive retrospective electrocardiogram-gated CTPA technique. The study aim was to offer a prompt and dependable radiological foundation for the prognostic evaluation of patients with APE in a clinical setting.
Materials and Methods
Study Population
This study was approved by the ethics committee of our hospital and the requirement for informed consent was waived due to the retrospective nature of the study (approval number: k2021017). Data were collected from patients diagnosed with APE who underwent retrospective electrocardiogram-gated CTPA using a 320-row CT scanner between August 2021 and July 2022.
The diagnostic criteria for APE on CTPA included: pulmonary artery lumen showing a low-density filling defect, stenosis, or occlusion on more than two consecutive slices, 11 excluding the possibility of chronic pulmonary embolism. 12
Exclusion criteria were as follows: previous pulmonary embolism or pulmonary hypertension; severe cardiac conditions, such as valvular disease and cardiomyopathy; history of iodine contrast allergy; hyperthyroidism; pregnancy; severe renal insufficiency; and other factors preventing completion of the CTPA examination; incomplete clinical data; and unacceptable CTPA images.
Patients diagnosed with APE were categorized into two distinct groups based on clinical outcomes: poor and good. Patients assigned to the poor outcome group exhibited at least one of the following indicators within 30 days of APE occurrence: death within 30 days; admission to the intensive care unit; cardiopulmonary resuscitation; mechanical ventilation; reperfusion therapy; emergency thrombolysis or thrombectomy; and shock or systolic blood pressure < 90 mm Hg.13,14
CTPA Acquisition
Data were collected from patients diagnosed with APE who underwent CTPA using a 320-row CT scanner (Aquilion ONE, Toshiba Medical Systems Corporation) in a retrospective electrocardiogram-gated low-dose mode. Patients were trained to maintain their breathing intensity during the scans. Scanning parameters were as follows: tube voltage of 100 kV and tube current set using sure-exposure three-dimensional (3D) automatic tube current modulation technology. The monitoring layer was set at the pulmonary trunk, and the sure-start software automatically triggered the scan at a trigger threshold value of 200 HU. If a patient exhibited significant hemodynamic changes, the scan was manually triggered using automated monitoring. The X-tube rotational speed was set at 0.35 s/rot with D-FOV of 320 mm. The adaptive iterative noise reduction algorithm technique was used for reconstruction. The FC03 algorithm was used for reconstruction with 1 mm thickness and a 0.8 mm interval. Prior to the procedure, all patients received an injection of 1.0 mL/kg iodixanol (concentration: 320 mg iodine/mL) administered as a 4 mL/s injection, followed by 30 mL of 0.9% physiological saline.
Measurements of CTPA Images
Raw data obtained from 0% to 100% at 10% cardiac cycles were subsequently transmitted to an image postprocessing station (Vitrea FX, Version 6.7.2). To ensure objectivity, the measurements were performed blindly (ie, without knowledge of the patients) by two experienced radiologists.
Measurements of AD
AD was used to assess the elasticity of the main pulmonary artery (MPA) based on the following definition
15
:

The evaluation involved determining the midpoint of the MPA from its origin to the bifurcation in axial images, aligning it perpendicular to the long axis in both axial and sagittal images, and subsequently measuring the obtained coronal images (Figure 1) using the measurement technique described in our previous publication. 16 This process was repeated for the remaining nine sets of images to consistently measure the MPA.
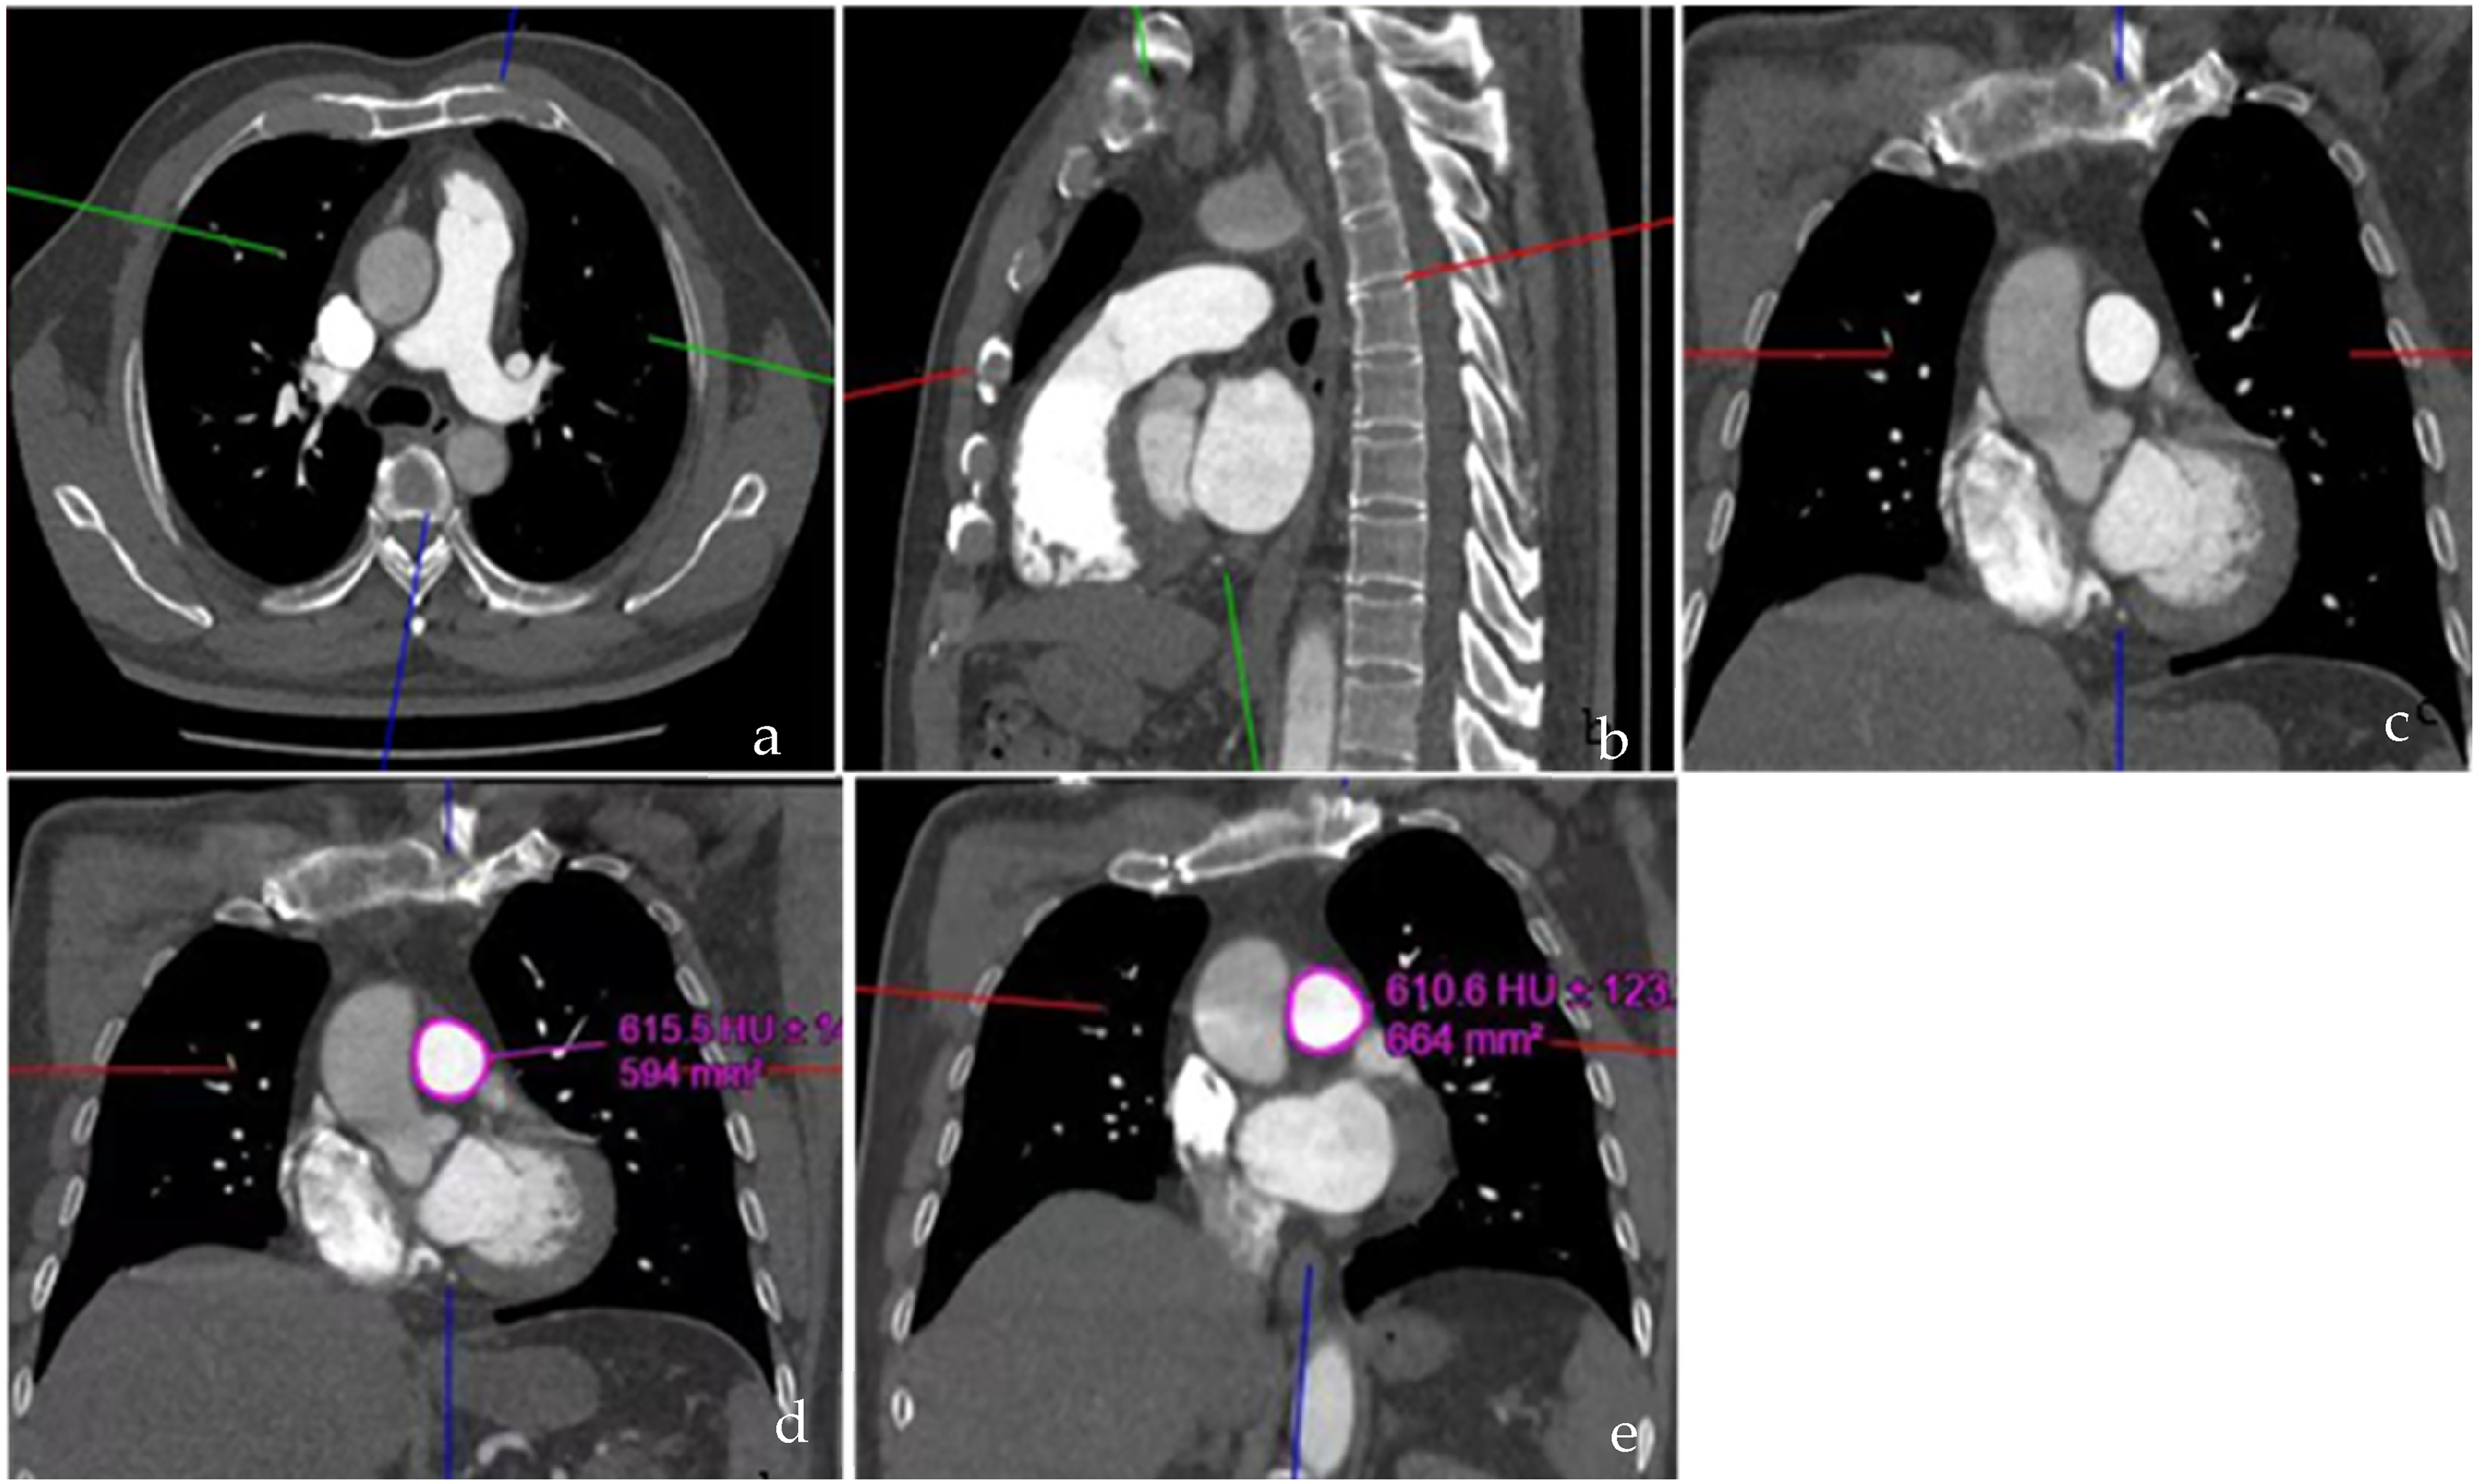
Measurements of SS and SD. (a, b) The cross-line was adjusted perpendicular to the MPA at the midpoint from the origin to the bifurcation point of the MPA on the axial and sagittal images; (c) Coronal image adjusted by a and b; (d, e) SS and SD were measured on the acquired coronal image. SS, SD, maximum and minimum luminal areas; MPA, main pulmonary artery.
Measurements of PAOI
The Qanadli index was used to evaluate the PAOI.
17
The calculation of the pulmonary artery obstruction percentage involved dividing the patient score by the maximal total score and multiplying the result by 100. Consequently, PAOI can be expressed as follows:

Measurements of RV/LV Ratio
The maximum distance between the RV and LV free wall medial to the interventricular septum was measured on axial images at the widest part of the tricuspid and mitral valves, respectively, and the RV/LV ratio was obtained (Figure 2).
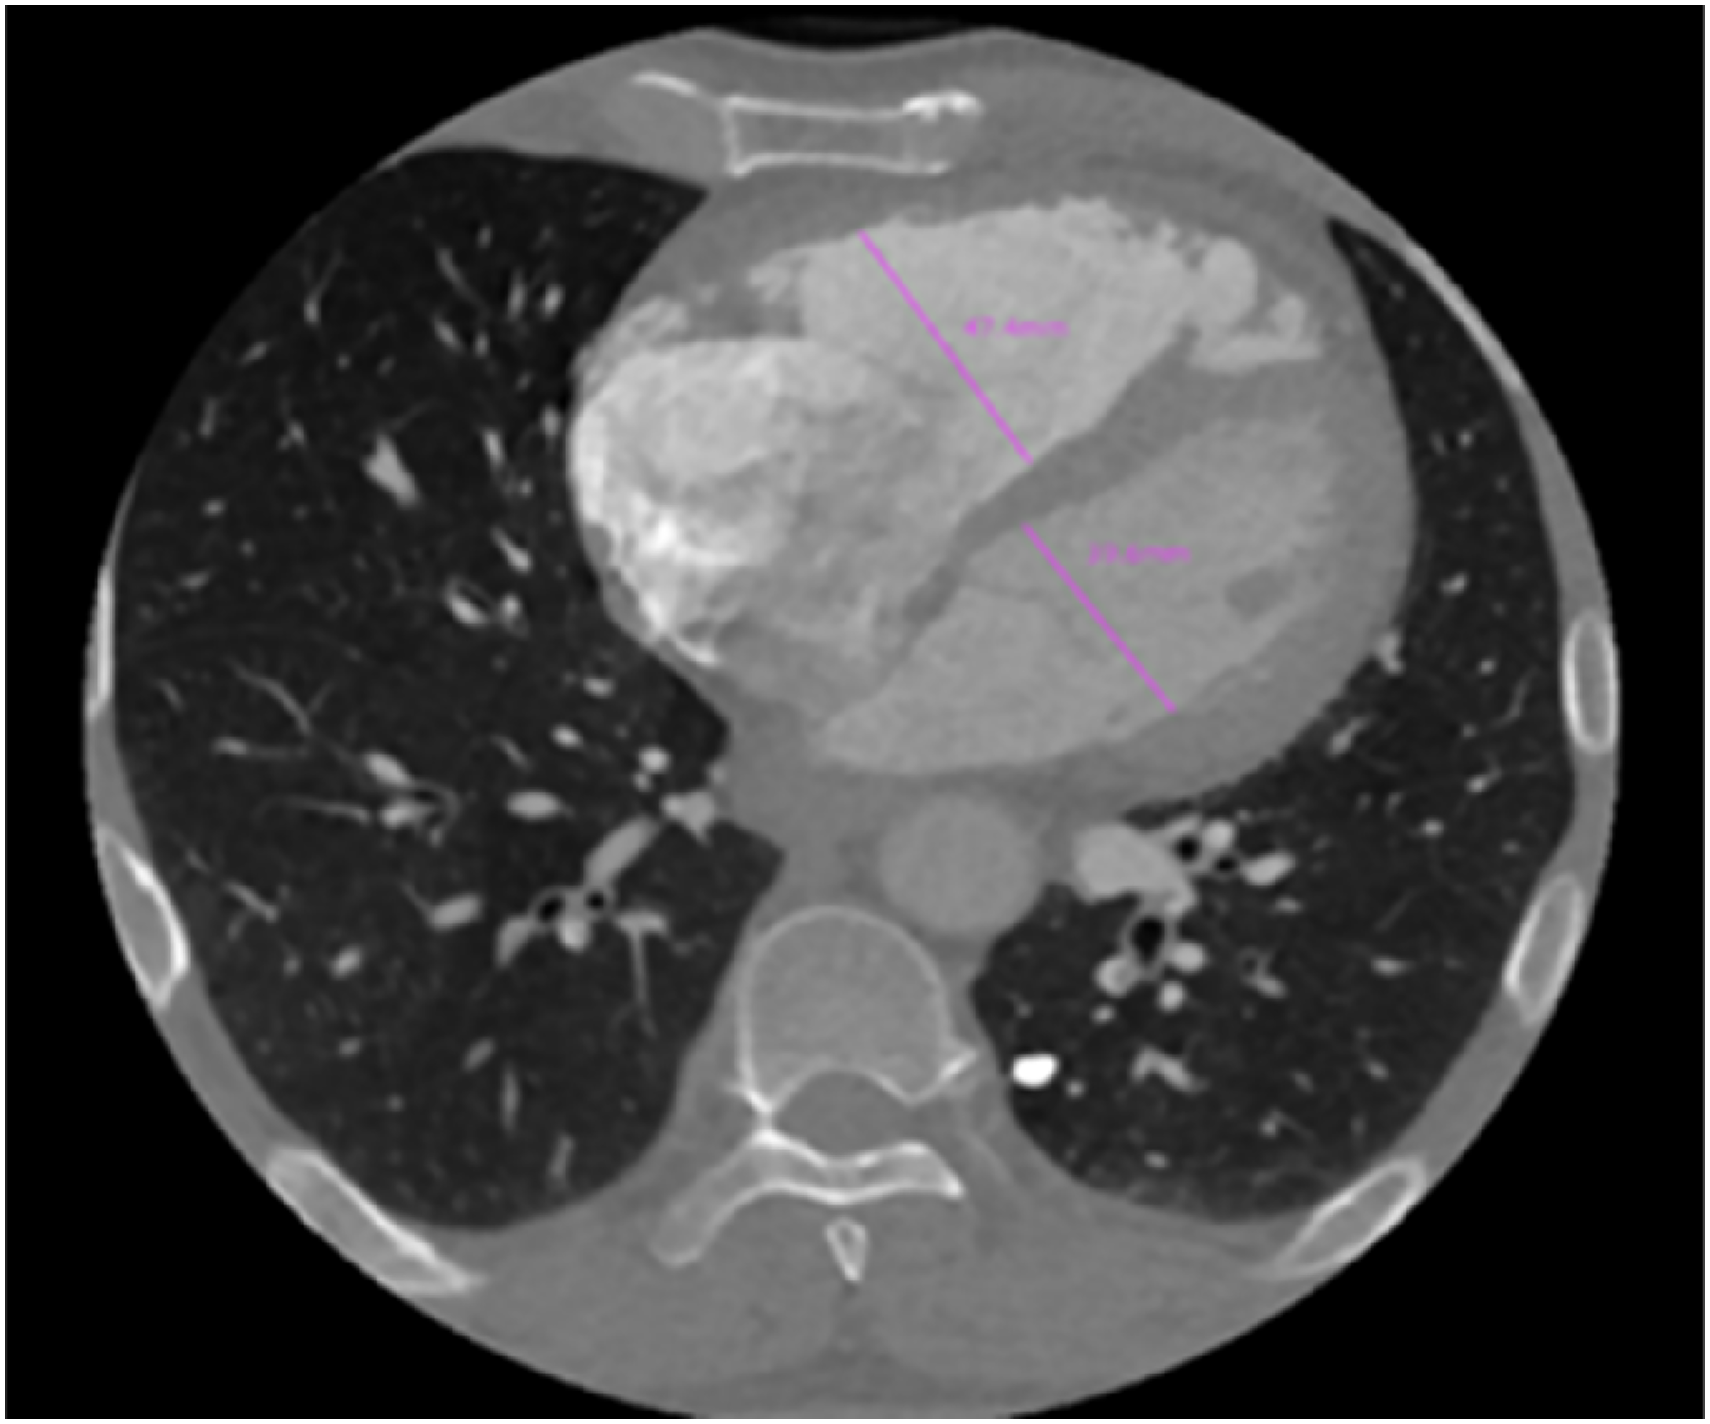
Measurements of the diameters of RV and LV. RV, right ventricle; LV, left ventricle.
Statistical Methods
Statistical analyses were conducted using SPSS software (version 26.0). The normal distribution of the data was evaluated using the Shapiro-Wilk test. Group comparisons were performed using independent or Fisher exact tests. Univariate and multivariate logistic regression, calibration, and decision curves were constructed using R statistical software (https://journal.r-project.org). Receiver operating characteristic (ROC) curves were generated using the MedCalc software (https://www.medcalc.org) and subsequently compared using the Delong test. Statistical significance was established at P < 0.05.
Results
Patient Characteristics
Sixty-four patients with APE (36 men (56.3%); 28 women (43.7%]) were included. The poor outcome group comprised 18 patients (nine men; nine women), whereas the good outcome group comprised 46 patients (27 men; 19 women). Among these patients, six experienced blurred consciousness, five required emergency thrombolysis, five exhibited hemoptysis, and nine required mechanical ventilation or were transferred to the intensive care unit. Sex, age, smoking status, hypertension, and diabetes did not differ significantly between the good and poor outcome groups (P > 0.05) (Table 1).
Patient Characteristics of the Two Groups.
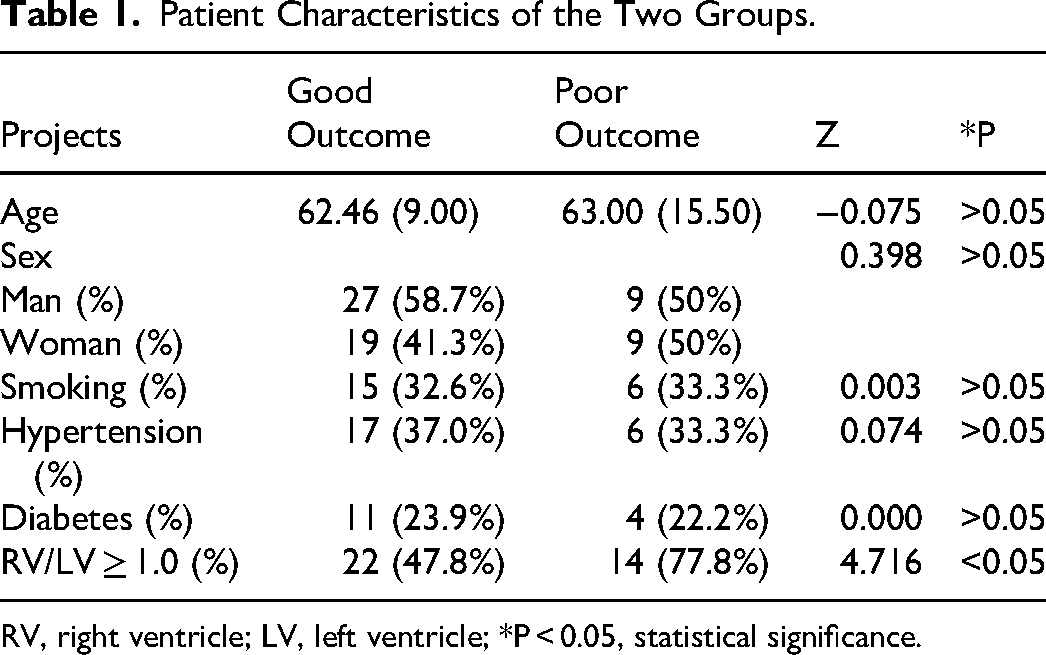
RV, right ventricle; LV, left ventricle; *P < 0.05, statistical significance.
Comparison of AD, RV/LV Ratio, and PAOI Between the Two Groups
The AD, RV/LV ratio, and PAOI exhibited statistically significant differences between the two groups (P < 0.05). Specifically, the ADs in the good outcome group ([5.76 ± 1.870] × 103 mm Hg−1) were significantly greater than those in the poor outcome group ([3.278 ± 1.280] × 103 mm Hg−1) (P < 0.001). The poor outcome group exhibited a higher RV/LV ratio and PAOI than those in the good outcome group (P < 0.05) (Table 2).
Comparison of AD, RV/LV Ratio and PAOI Between the Two Groups.
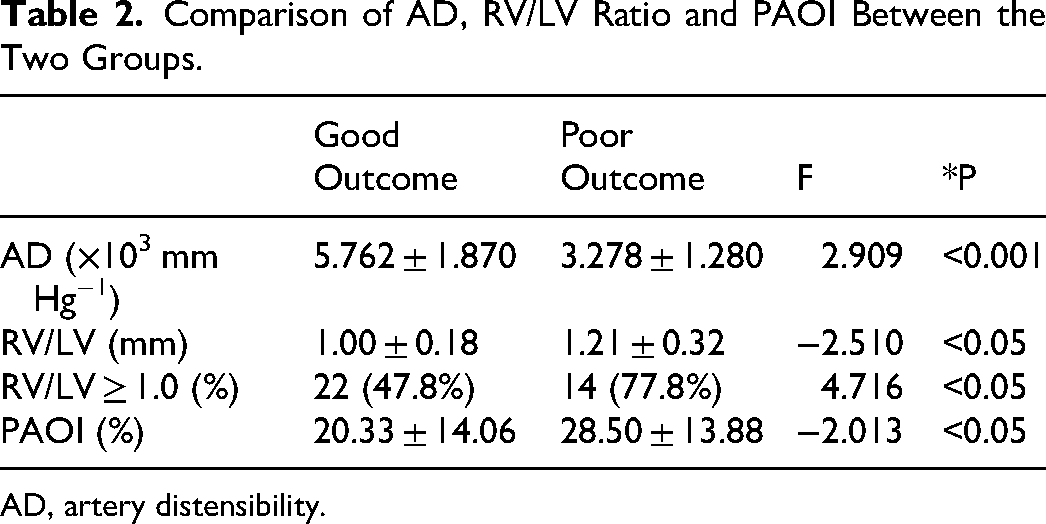
AD, artery distensibility.
Univariate and Multifactor Analyses
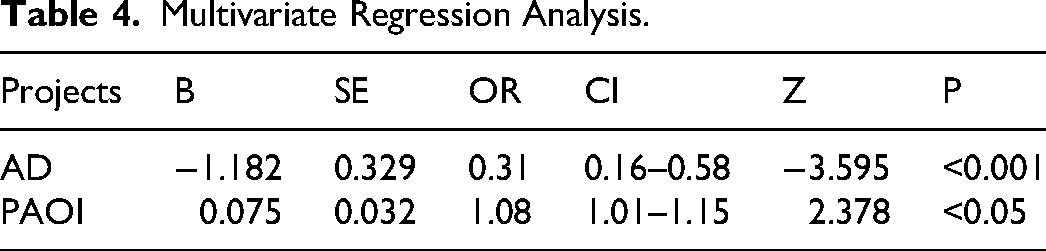
Univariate and multivariate logistic regression analyses demonstrated that AD and PAOI were independent prognostic indicators of short-term adverse clinical outcomes in patients with APE (P < 0.05) (Tables 3 and 4).
Univariate Regression Analysis.
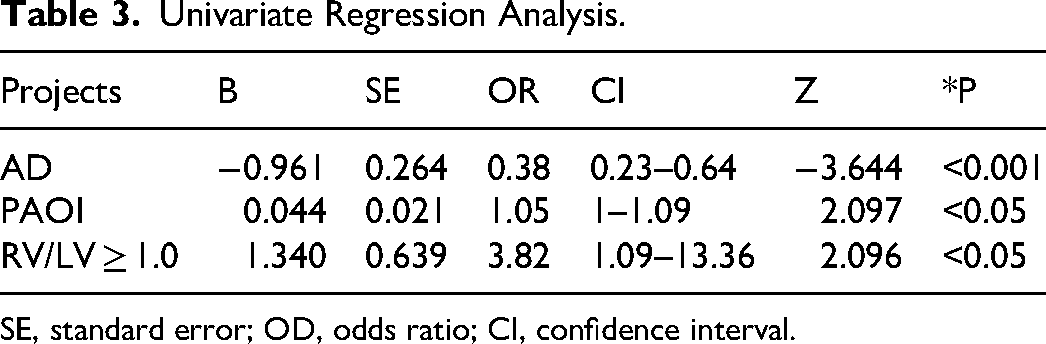
SE, standard error; OD, odds ratio; CI, confidence interval.
Multivariate Regression Analysis.
ROC Curve Analysis for Predicting Poor Short-Term Outcome in Patients with APE
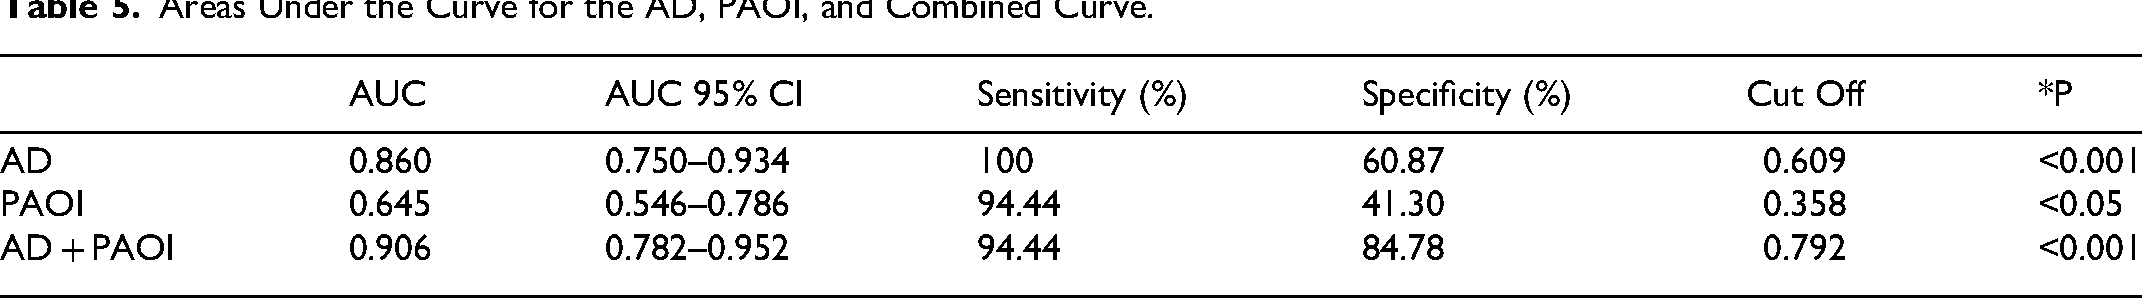
The areas under the curve (AUC) for the AD and PAOI were 0.860 (95% confidence interval [CI]: 0.750–0.934) and 0.675 (95% CI: 0.546–0.786), respectively. Additionally, the combined curve of the AD and PAOI yielded an AUC of 0.906 (95% CI: 0.806–0.965) (Figure 3, Table 5). Notably, the predictive value of the combined curve was significantly higher than those of the curves for the single indicators (AD or PAOI alone) (P < 0.001). The goodness-of-fit for the three indicators ranged from 0.107 to 0.550. The combined calibration curve was superior to the calibration curves for the AD and PAOI alone, suggesting a more consistent prediction of poor short-term outcomes in APE (Figure 4). The clinical decision curve showed that the combined curve had a high clinical application value when the threshold probability ranged from 0.01 to 0.69 (Figure 5).
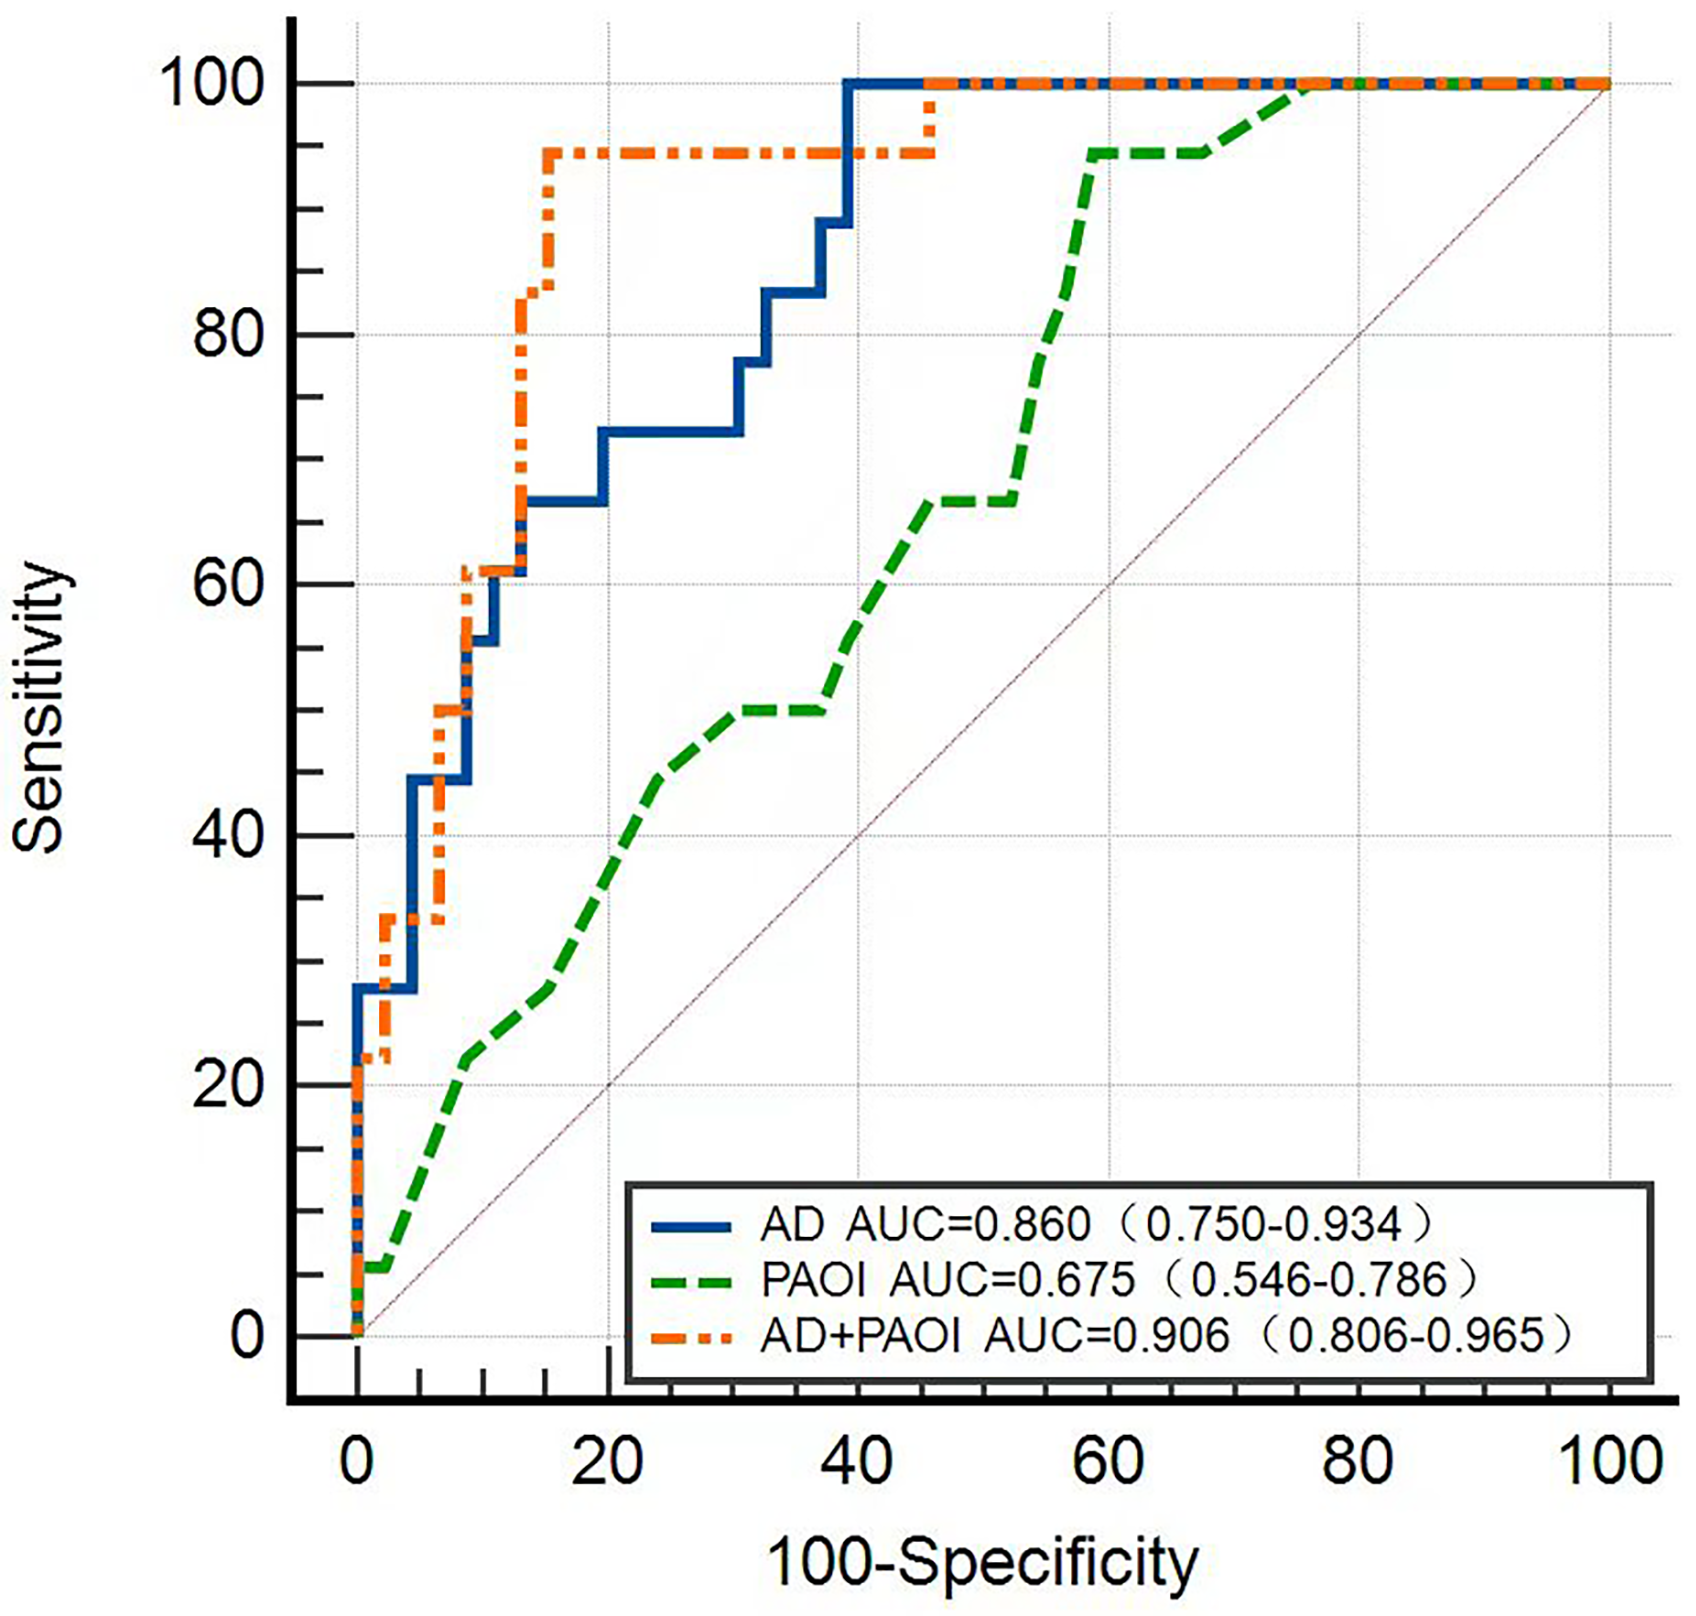
AD, PAOI, and combined (AD + PAOI) ROC curves. ROC, receiver operating characteristic.
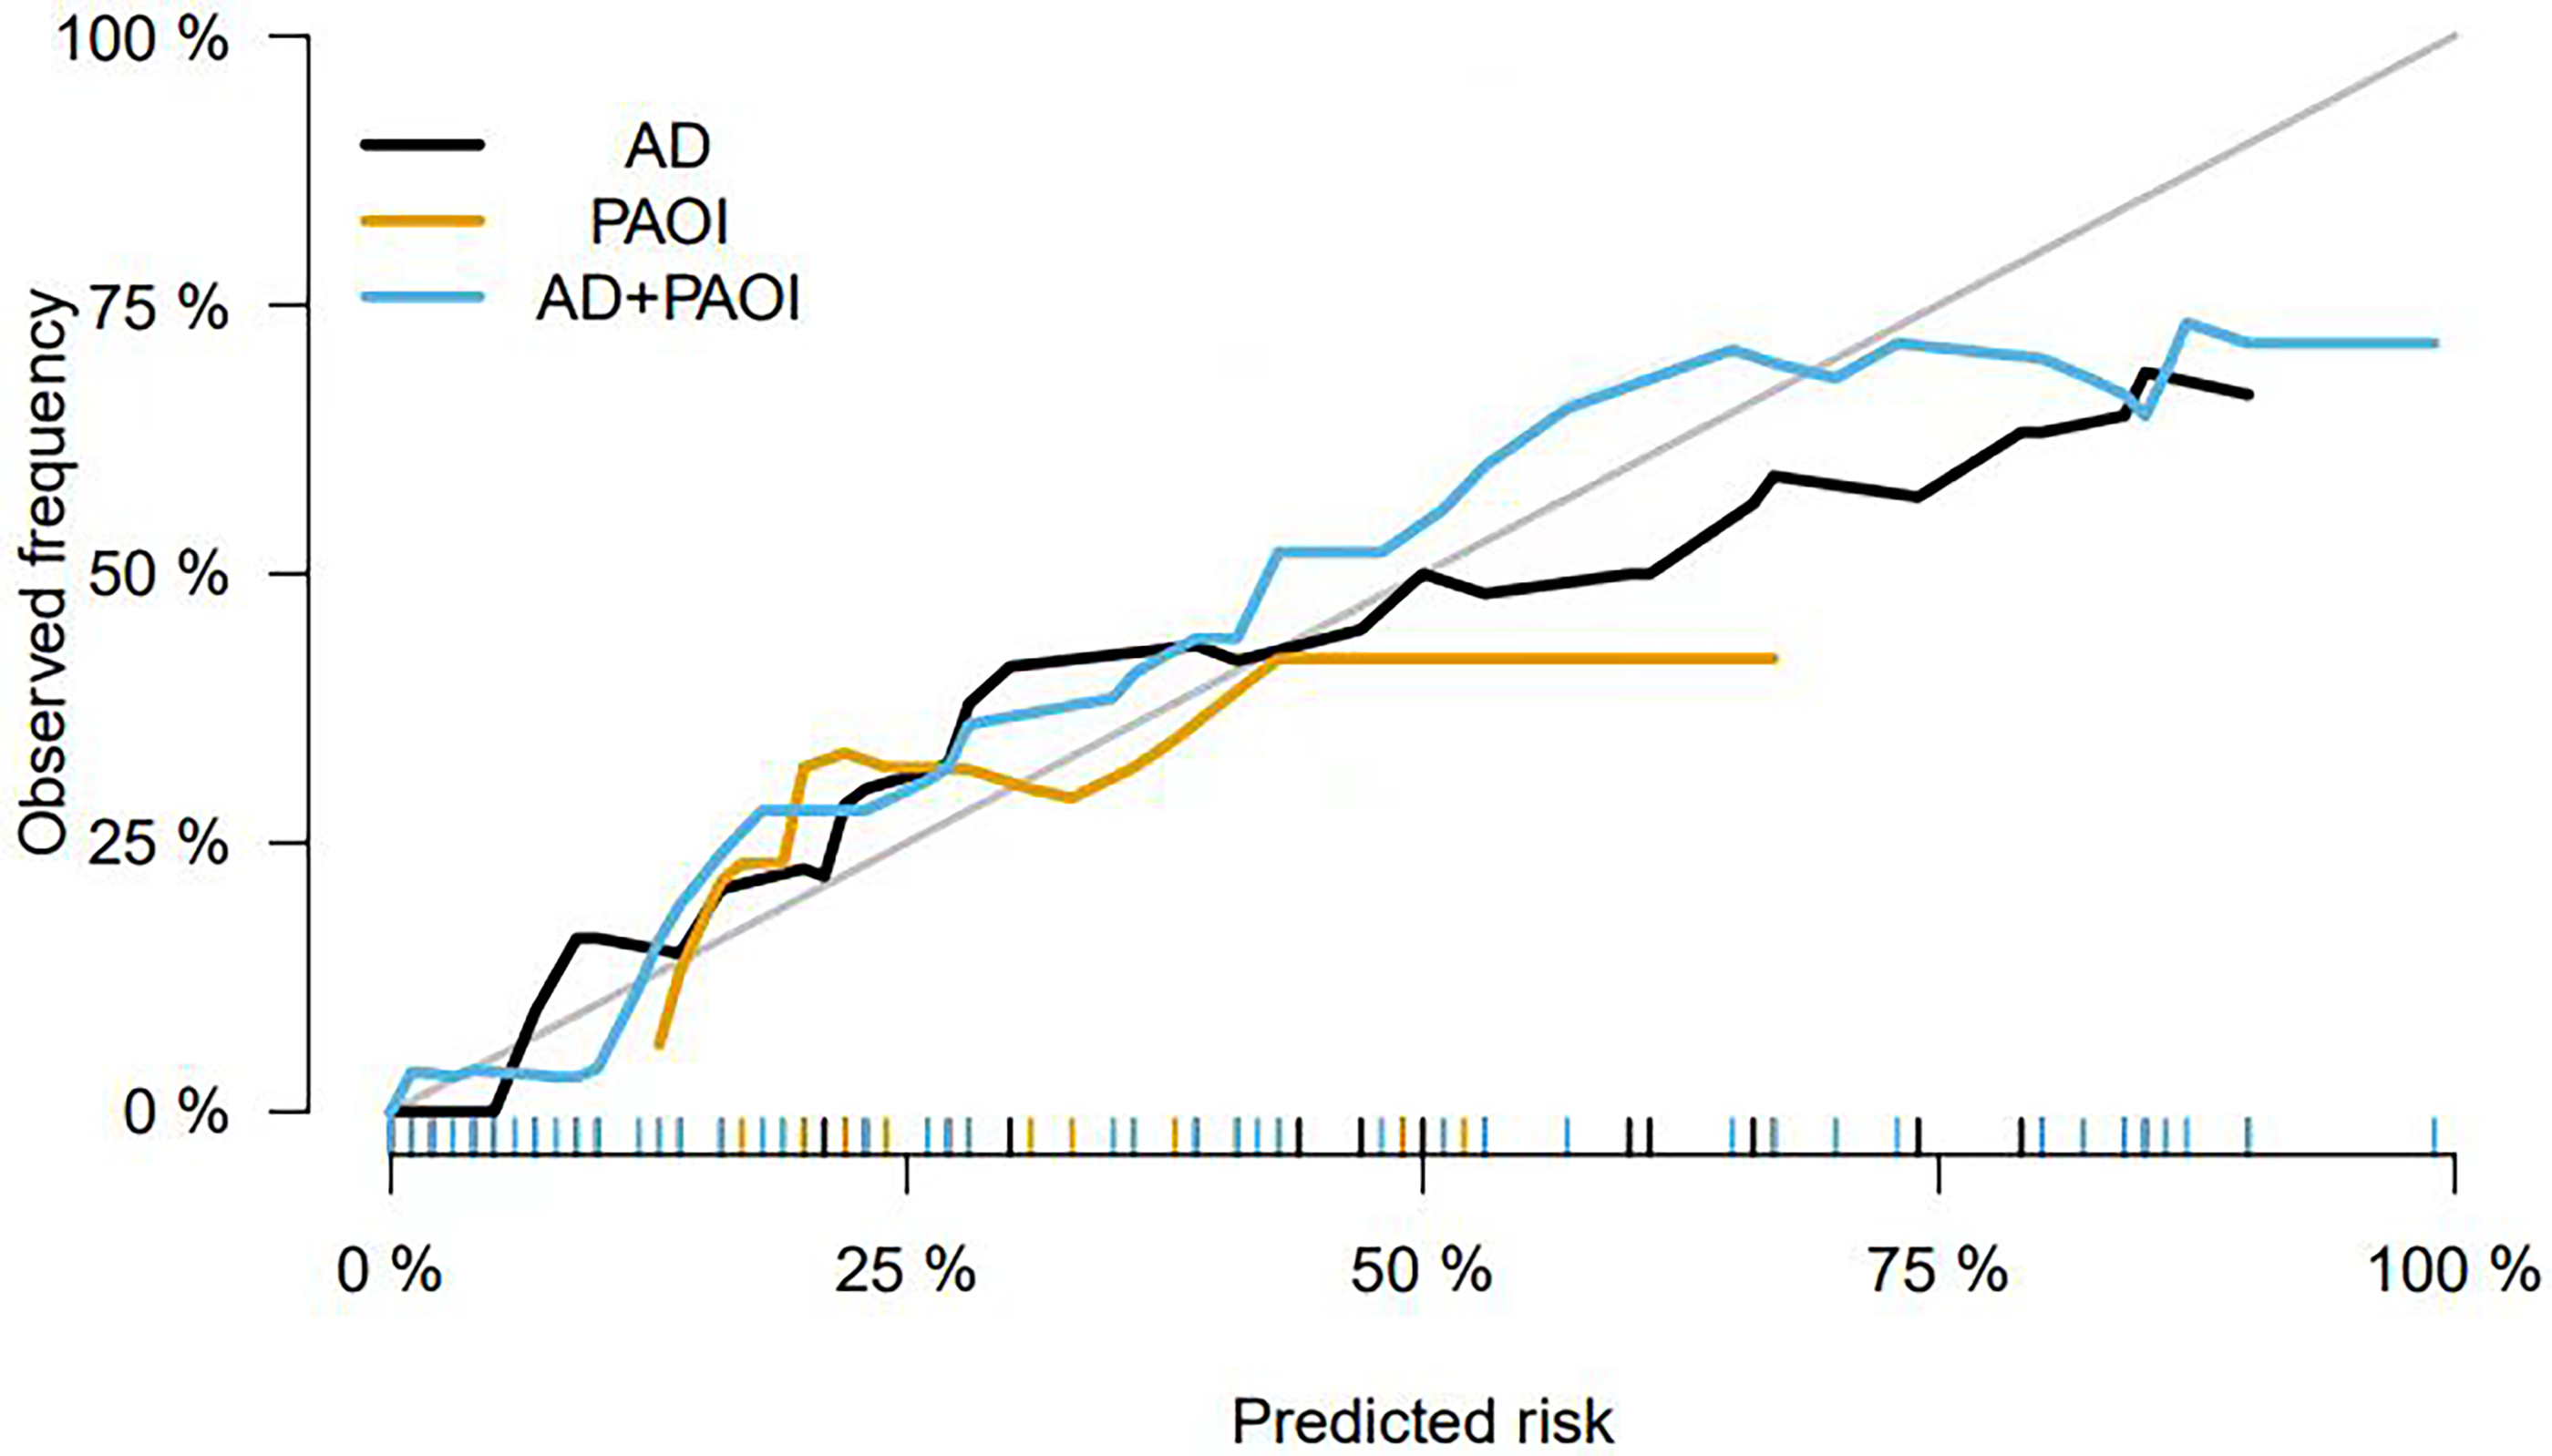
Comparison of the calibration curve.
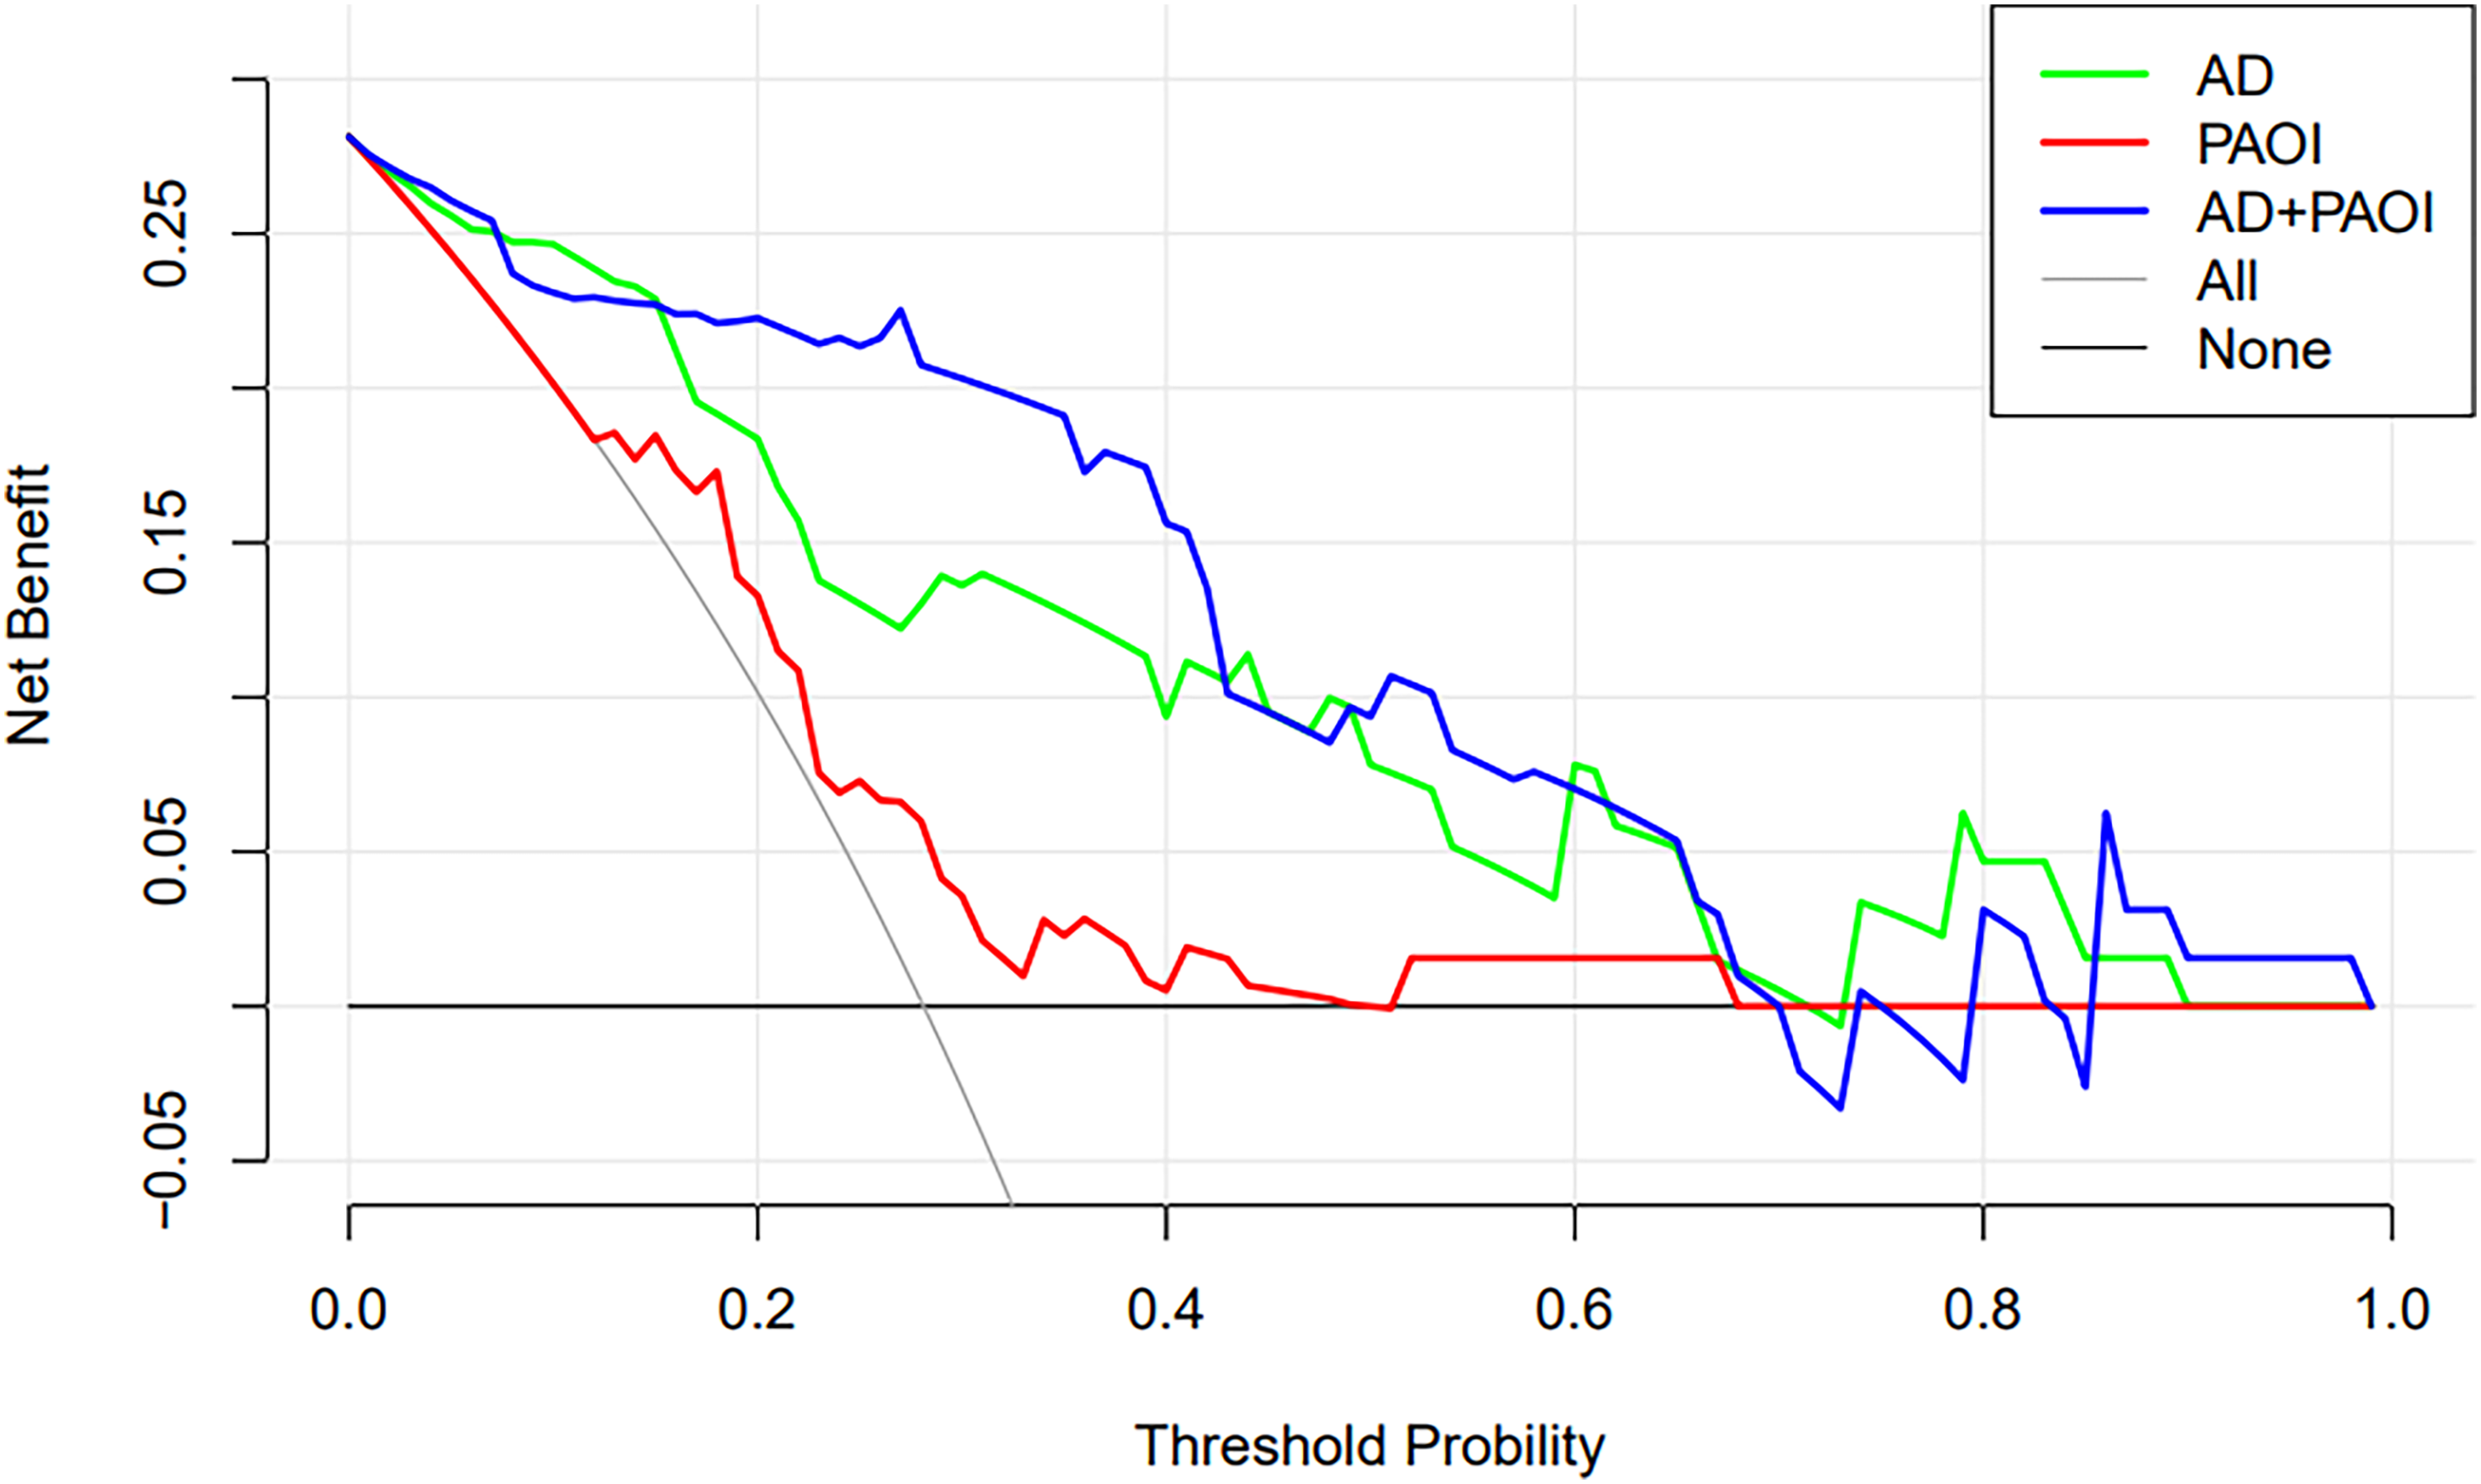
Comparison of clinical decision curve comparison.
Areas Under the Curve for the AD, PAOI, and Combined Curve.
Discussion
To our knowledge, this is the first study to apply CTPA-obtained measures of pulmonary artery distensibility to predict a poor short-term outcome in patients with APE. Our study yielded two primary and important findings. First, retrospective electrocardiogram-gated CTPA-derived AD serves as an independent risk indicator for unfavorable short-term outcome of APE while simultaneously providing an accurate APE diagnosis. Second, the amalgamation of AD and PAOI exhibits a substantial predictive capacity for adverse clinical outcomes, thereby potentially facilitating timely clinical intervention and ultimately enhancing the prognosis of patients with APE.
Previous studies have indicated a reduction in pulmonary AD during APE, which subsequently improves after treatment. 18 Our investigation revealed that decreased pulmonary AD was an independent predictor of unfavorable short-term outcomes in APE. Moreover, there was a statistically significant difference (P < 0.001) between the poor and good outcome groups. This confirms that pulmonary AD derived from CTPA serves as an independent risk indicator for short-term adverse clinical outcomes of APE while improving the accuracy of diagnosing APE. This is consistent with previous research showing that pulmonary artery stiffness measured noninvasively using MRI as an indicator of pulmonary artery elastic function could be utilized as a prognostic marker for mortality in individuals with pulmonary hypertension. 19 The results of the ROC curves in our study also showed that AD has a reliable predictive effect in clinical practice with high sensitivity and can be used as a reliable indicator for assessing the short-term adverse clinical outcomes of APE.
The results of this study indicate that PAOI is an independent risk factor for predicting the short-term adverse clinical outcomes of APE. Specifically, the index exhibited a significantly greater value in the cohort of patients with a poor outcome than that in those with a favorable outcome (P < 0.05). This is consistent with the findings of other studies.20,21 Hajiahmadi et al. found that the PAOI obtained through CTPA is a sensitive and specific predictor of long-term complications, including pulmonary hypertension and right heart dysfunction, during the initial diagnosis of APE. 21 A higher PAOI is associated with a higher pulmonary artery thrombus burden, which can lead to pulmonary hypertension and reduced pulmonary artery compliance, ultimately impairing right ventricular function. 22 Research has also shown that the PAOI was not a reliable predictor of all-cause mortality, although it was linked to unfavorable clinical outcomes. 23
In addition, we found that PAOI predicted poor outcome in patients with APE with an AUC of 0.675, which was a low effect, with high sensitivity (94.44%) and low specificity (41.30%). This may be due to the insufficient detection of subsegmental and lower emboli using conventional CTPA to assess the impact of small emboli on cardiopulmonary function. 24 This thought is supported by the Perez-Johnston et al. study in which peripheral emboli that were below the resolution of CTPA still had an impact on pulmonary perfusion. 25 Therefore, the role of PAOI in assessing short-term adverse clinical outcomes of APE remains unclear. Our findings suggest that the addition of AD to PAOI on CTPA images improves the prediction of poor short-term outcome in APE, with a significant increase in the AUC.
Many recent studies have concluded that an RV/LV greater than or equal to 1.0 on CT images is closely related to adverse clinical outcomes in patients with APE.1,26 However, the aforementioned conclusions could not be made based on this study, which is similar to the findings of Lyhne et al. 27 Their research demonstrated that septal bowing and main pulmonary artery diameter, as measured using CTPA, exhibited significant correlations with short-term adverse outcomes among individuals diagnosed with APE, whereas an RV/LV greater than or equal to 1.0 was not correlated with short-term poor outcome. The previous study identified an RV/LV greater than or equal to 0.9 as a significant predictor of adverse short-term outcome in both the overall APE population and hemodynamically stable patients. 28 Furthermore, Liu et al. discovered that an RV/LV ratio exceeding 1.165 was predictive of adverse outcomes. 29 Therefore, the prognostic value of an RV/LV greater than or equal to 1.0 for the poor short-term outcome of APE remains controversial and should be further validated through additional clinical research.
However, the measurement of PAOI and AD is time-consuming and requires experienced radiologists. Therefore, although AD is undoubtedly an interesting concept, it remains to be further investigated whether the method can make a significant contribution to established clinical risk assessment methods in daily clinical practice.
The limitations of the present study must be acknowledged. First, the sample size was small. The small sample size in this study can be attributed to the implementation of specific inclusion and exclusion criteria and the inherent limitations of retrospective electrocardiogram-gated CTPA. Consequently, validating the findings of this study by conducting further studies with larger patient cohorts is imperative. Additionally, our measurement technique solely enables the assessment of the elastic properties of localized pulmonary arteries, rather than encompassing arterial distensibility as a whole. To enhance our understanding of the vascular distensibility characteristics in patients with APE, we will conduct further studies with larger sample sizes and include evaluation of different areas of the pulmonary artery.
In conclusion, the pulmonary artery distensibility derived from retrospective electrocardiogram-gated CTPA may serve as an indicator for assessing both short-term poor outcome and accurate diagnosis of APE. Furthermore, the AD and PAOI were identified as autonomous predictors of poor short-term outcome. The amalgamation of these two measures has the potential to enhance the precision of short-term prognostic evaluation in patients with APE, provide timely noninvasive guidance for clinical interventions, and ultimately improve patient prognosis.
Footnotes
Author Contributions
Conceptualization and design, Y.F. and W.D.W.; project administrative support, Y.F.; resources (provision of study materials/patients), Y.Y.X. and D.D.J.; data curation/collection and assembly of data, C.R. and Y.Y.; investigation/data analysis and interpretation, P.Z.Y., and Y.Z.X.; writing-original draft preparation/review and editing, all authors. All authors have read and agreed to the published version of the manuscript.
Data Availability
The datasets used and/or analyzed in the current study are available from the corresponding author upon reasonable request.
Declaration of Conflicting Interests
The authors declared no potential conflicts of interest with respect to the research, authorship, and/or publication of this article.
Funding
This study was supported by a grant from the Science and Technology Project of Hebei Provincial Science and Technology Department (21377769D).
Informed Consent Statement
Informed consent for patient information to be published in this article was not obtained because of the retrospective nature of this study in accordance with national legislation and institutional requirements
Institutional Review Board Statement
Ethical approval to report this case series was obtained from the Institutional Review Board of the First Affiliated hospital of Hebei North University. (APPROVAL NUMBER/ k2021017).