
Abstract
Statins not only have a lipid-lowering effect but also reduce inflammation and have an antithrombotic effect. Since hypercoagulability assessed by thrombin generation assay (TGA) and increased formation of neutrophil extracellular traps (NET) were demonstrated in diabetes, we investigated whether statin therapy in diabetes modifies coagulation status and NET formation. Twenty-five consecutive patients with diabetes were recruited. Global coagulation assays (prothrombin time [PT], activated partial thromboplastin time [aPTT], and TGA) and NET markers (DNA–histone complex, cell-free DNA, and neutrophil elastase) were measured before and after 3-month moderate-intensity statin therapy. In addition, all coagulation factors and 3 anticoagulation factors were measured. Statin therapy significantly reduced endogenous thrombin potential (ETP) value and blood lipids but did not change the PT and aPTT values or NET formation markers. Statin significantly decreased not only coagulation factors (II, V, VIII, IX, and X) but also the anticoagulation factor antithrombin. Statin-induced reduction of factor V and X significantly contributed to the reduction of ETP value. The extent of reduction in coagulation factors correlated with that of anticoagulation factors, but not that of cholesterol. It is possible to use TGA as a global coagulation assay that can detect coagulation status modified by statin therapy. Additional studies are needed to evaluate the clinical implications of statin-induced simultaneous reduction of coagulation and anticoagulation factors.
Keywords
Introduction
Diabetes mellitus is frequently associated with dyslipidemia, which is considered to contribute to vascular complications such as cardiovascular and cerebrovascular diseases. Therefore, treatment with 3-hydroxy-3-methylglutaryl-coenzyme A reductase inhibitors (statins) has been proposed to prevent vascular events in diabetes. 1
Statins not only have a lipid-lowering effect but also reduce inflammation and have vascular protective effects including an antithrombotic effect. 2 Statins prevent thrombosis through inhibition of tissue factor expression by endothelial cells and reduction in factor VII and V activity. 3 Although effects of statins on individual coagulation factors have been investigated in some studies, 2,4 there are no data about the ability of global coagulation assays to assess changes in the coagulation system during statin therapy in diabetes.
Clinical laboratories routinely use global coagulation assays such as prothrombin time (PT) and activated partial thromboplastin time (aPTT). These assays give only limited information needed to detect bleeding condition 5 and also little information about thrombotic condition. Recently, thrombin generation assay (TGA) has been introduced to assess global coagulation status. 6 –8 Endogenous thrombin potential (ETP) in TGA has been shown to be a good marker of thrombotic and bleeding conditions. 9 We recently demonstrated hypercoagulability in diabetes mellitus using TGA. 10
During inflammation, neutrophils eject nuclear contents into the extracellular space; the ejected material is called neutrophil extracellular traps (NET). 11 Hyperglycemia in diabetes can induce NET formation, which are composed of DNA, histone, and neutrophil elastase. 12,13 The NET components can aggravate inflammatory or thrombotic processes. 11 Since statins show an anti-inflammatory effect, 14 statin therapy may possibly reduce the NET formation in diabetes.
This study investigated whether moderate-intensity statin therapy can reduce global coagulation status (as measured by TGA) and NET formation in diabetic patients. We performed 3 global coagulation assays (PT, aPTT, and TGA) and assessed 3 NET markers (DNA–histone complex, cell-free DNA, and neutrophil elastase) before and after statin therapy. In addition, all coagulation factors and 3 anticoagulation factors were measured to explore the individual effect of each factor on TGA results.
Materials and Methods
Study Population
This prospective study was approved by the institutional review board of Ulsan University Hospital (UUH-IRB-12-003). Twenty-five consecutive patients with type 2 diabetes were recruited. Diabetes was diagnosed based on plasma glucose criteria (either fasting plasma glucose ≥126 mg/dL or the 2-hour plasma glucose value after a 75-g oral glucose tolerance test ≥200 mg/dL), hemoglobin A1c (HbA1c) criteria (≥6.5%), or through clinical use of oral hypoglycemic agents or insulin. Patients were enrolled if they had no statin therapy within 6 months before recruitment. They showed a low-density lipoprotein (LDL) cholesterol level >100 mg/dL and a triglyceride level <400 mg/dL. We excluded patients with coronary artery disease, active liver disease, or a venous thrombotic event, and we excluded patients taking anticoagulants such as heparin or warfarin or aspirin or novel oral anticoagulants. All patients provided signed informed consent. Peripheral venous blood was collected before and after 3 months of moderate-intensity statin therapy (simvastatin 20 mg/d, atorvastatin 10-20 mg/d, rosuvastatin 5-10 mg/d, pitavastatin 2 mg/d, or pravastatin 40 mg/d); within 1 hour of collection, whole blood was separated by centrifugation at 1550g for 15 minutes. The aliquots of plasma were stored at −70°C.
Thrombin Generation Assay
Thrombin generation assay was performed using a calibrated automated thrombogram (Thrombinoscope BV, Maastricht, the Netherlands) according to a previously described method. 10,15 Briefly, 20 μL of reagent containing 5 pM tissue factor (PPP Reagent; Thrombinoscope BV) or thrombin calibrators (Thrombinoscope BV) was dispensed into each microwell and then 80 μL of test plasma was added. After the addition of 20 μL of fluorogenic substrate with CaCl2, a fluorescent signal was observed in a Fluoroskan Ascent fluorometer (Thermo Labsystems OY, Helsinki, Finland). Thrombin generation curves were evaluated using the Thrombinoscope software (Thrombinoscope BV), producing lag time, peak thrombin, and ETP. Endogenous thrombin potential is the area under the thrombin generation curve and represents the total amount of generated thrombin.
Other Coagulation Assays
Both PT and aPTT were assayed using the RecombiPlasTin (Instrumentation Laboratory, Milan, Italy) and SynthASil (Instrumentation Laboratory) on an ACL 3000 (Instrumentation Laboratory). Fibrinogen was measured using the HemosIL Fibrinogen-C XL reagent (Instrumentation Laboratory SpA). Coagulation factors were assayed using a PT-based clotting assay with the HemosIL RecombiPlasTin reagent (for FII, FV, FVII, and FX) and an aPTT-based clotting assay using the SynthASil reagent (for FVIII, FXI, FXI, and FXII).
Measurements of NET Markers
The DNA–histone complex, cell-free DNA, and neutrophil elastase were measured using respective ELISA kits (Cell Death Detection, Roche Diagnostics; Quant-iT Picogreen dsDNA assay kit, Thermo Fisher Scientific; Human PMN Elastase Platinum, eBioscience, San Diego, California).
Statistical Analysis
Data were compared using the Mann-Whitney U analysis for continuous variables and the χ2 test for categorical variables. To assess the contributing effects of coagulation and anticoagulation factors on TGA parameters, multiple linear regression analysis was performed. Simple linear relationships between changes in blood lipids, coagulation factors, and anticoagulation factors were explored by the Spearman correlation analysis. All analyses were carried out using IBM SPSS Statistics version 21 (IBM Corporation, Armonk, New York). A P value of <.05 was considered significant.
Results
The mean age of patients was 58 years (49-62); 9 were men and 16 were women. The diagnosis rates for hypertension, diabetic retinopathy, neuropathy, and albuminuria were 40%, 24%, 52%, and 44%, respectively. Table 1 shows changes in various lipids and coagulation tests before and after 3-month moderate-intensity statin therapy. Three-month moderate-intensity statin therapy significantly decreased total cholesterol and LDL cholesterol levels and increased the HDL cholesterol level. It did not change fasting blood sugar and HbA1c levels (Table 1). There was no significant change in triglycerides. Both PT and aPTT were not changed by statin therapy. Circulating levels of 3 NET markers were also not significantly changed. As measured by TGA, ETP was significantly reduced by statin therapy. However, lag time was rather shortened.
Laboratory Tests in Diabetic Patients (n = 25) Before and After Statin Therapy.a
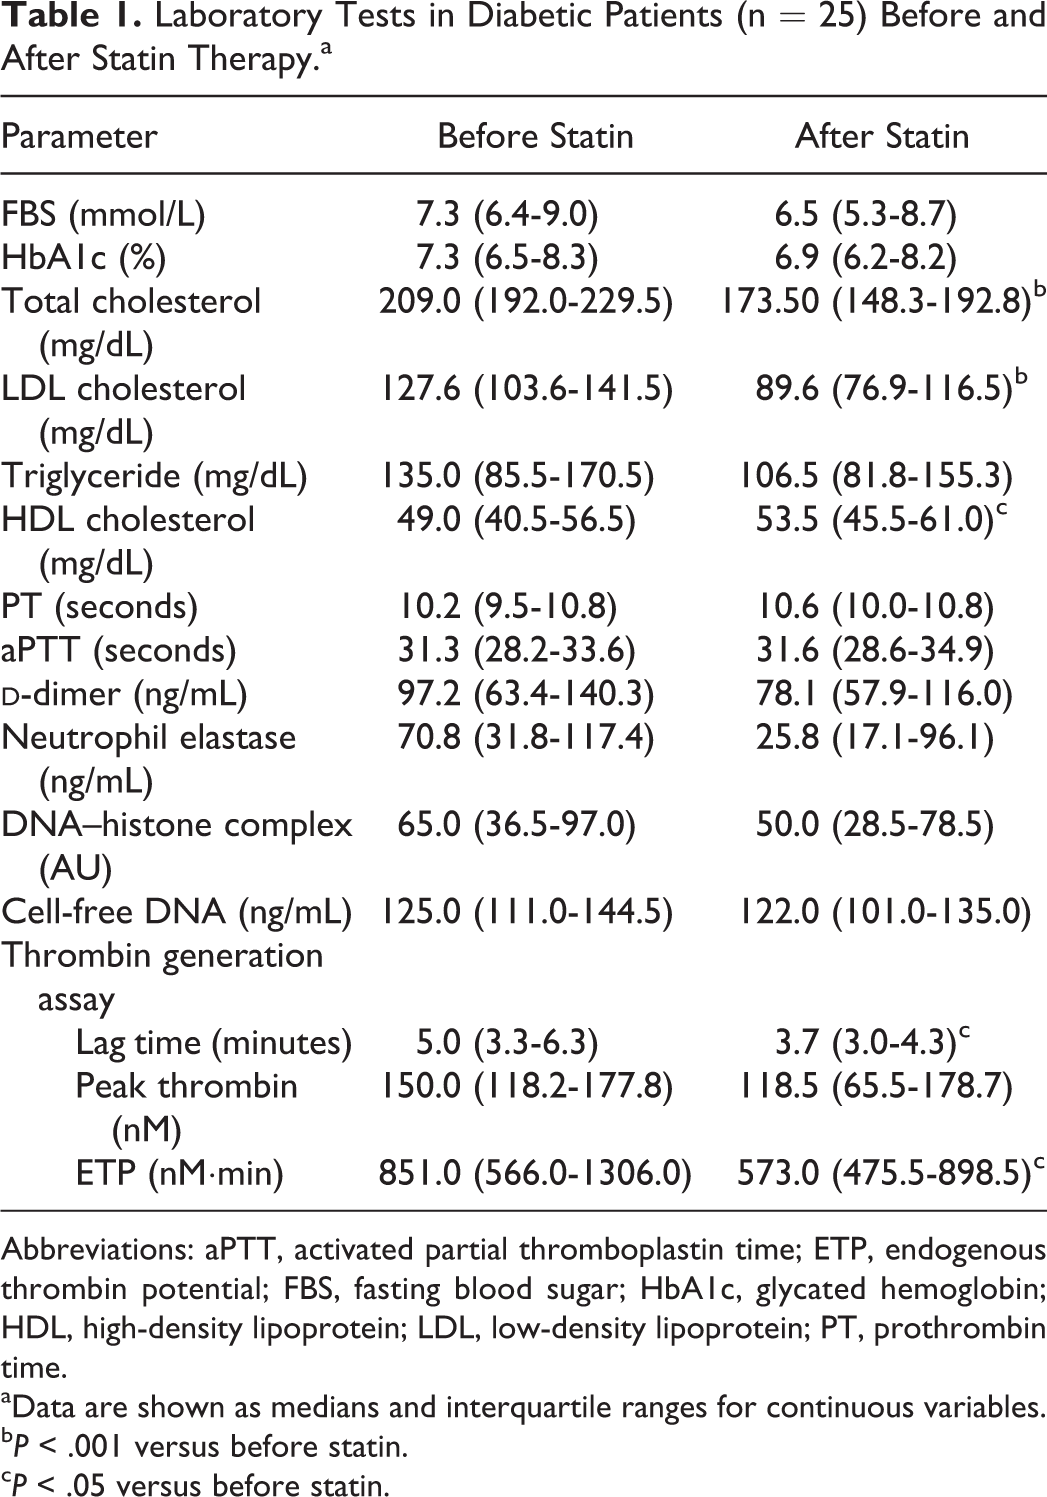
Abbreviations: aPTT, activated partial thromboplastin time; ETP, endogenous thrombin potential; FBS, fasting blood sugar; HbA1c, glycated hemoglobin; HDL, high-density lipoprotein; LDL, low-density lipoprotein; PT, prothrombin time.
aData are shown as medians and interquartile ranges for continuous variables.
b P < .001 versus before statin.
c P < .05 versus before statin.
To investigate the factors that affect statin-induced ETP reduction, we tested all coagulation factors and 3 anticoagulation factors (Table 2). After statin therapy, coagulation factors II, V, VIII, IX, and X were significantly decreased (Figure 1). Among those factors, reduction percentage of factor V was the highest (−12.15%). Among anticoagulation factors, antithrombin was significantly decreased by statin therapy. Protein C level tended to decrease, although the statistical significance was not reached.
Changes in Coagulation and Anticoagulation Factors in Diabetic Patients (n = 25) Before and After Statin Therapy.a
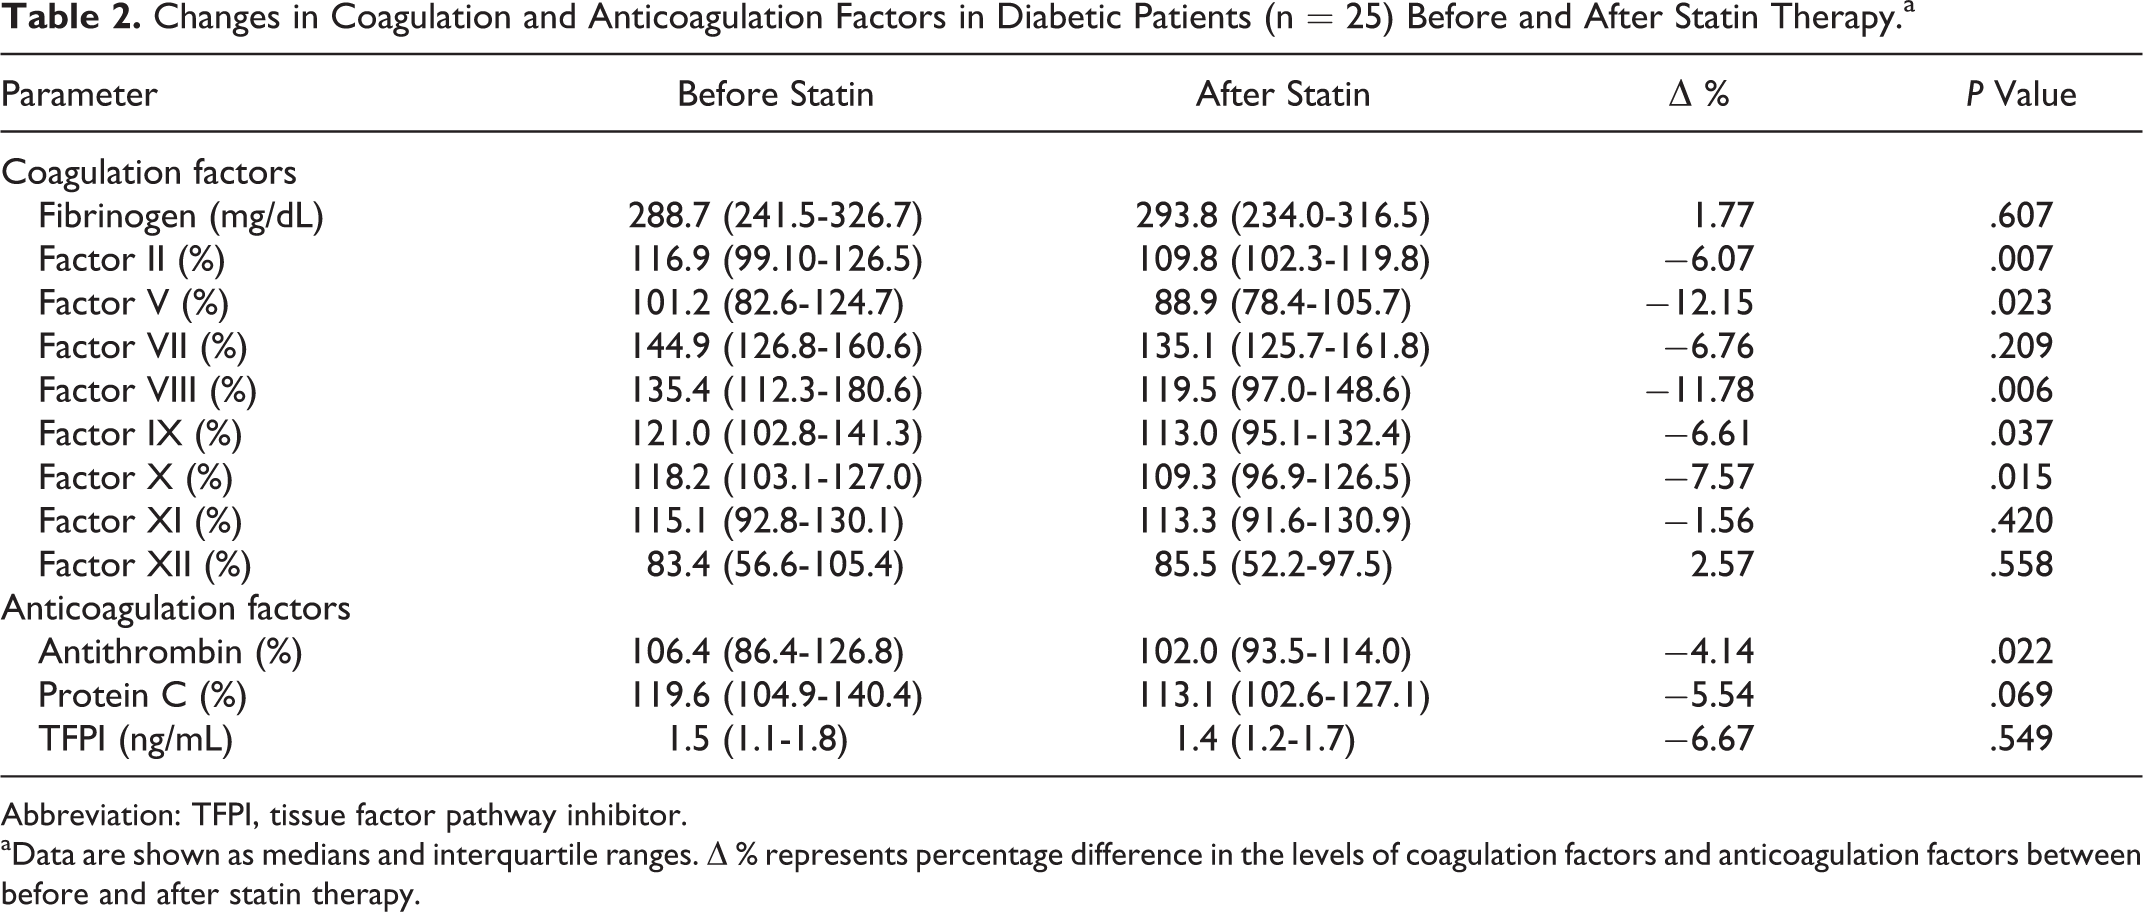
Abbreviation: TFPI, tissue factor pathway inhibitor.
aData are shown as medians and interquartile ranges. Δ % represents percentage difference in the levels of coagulation factors and anticoagulation factors between before and after statin therapy.
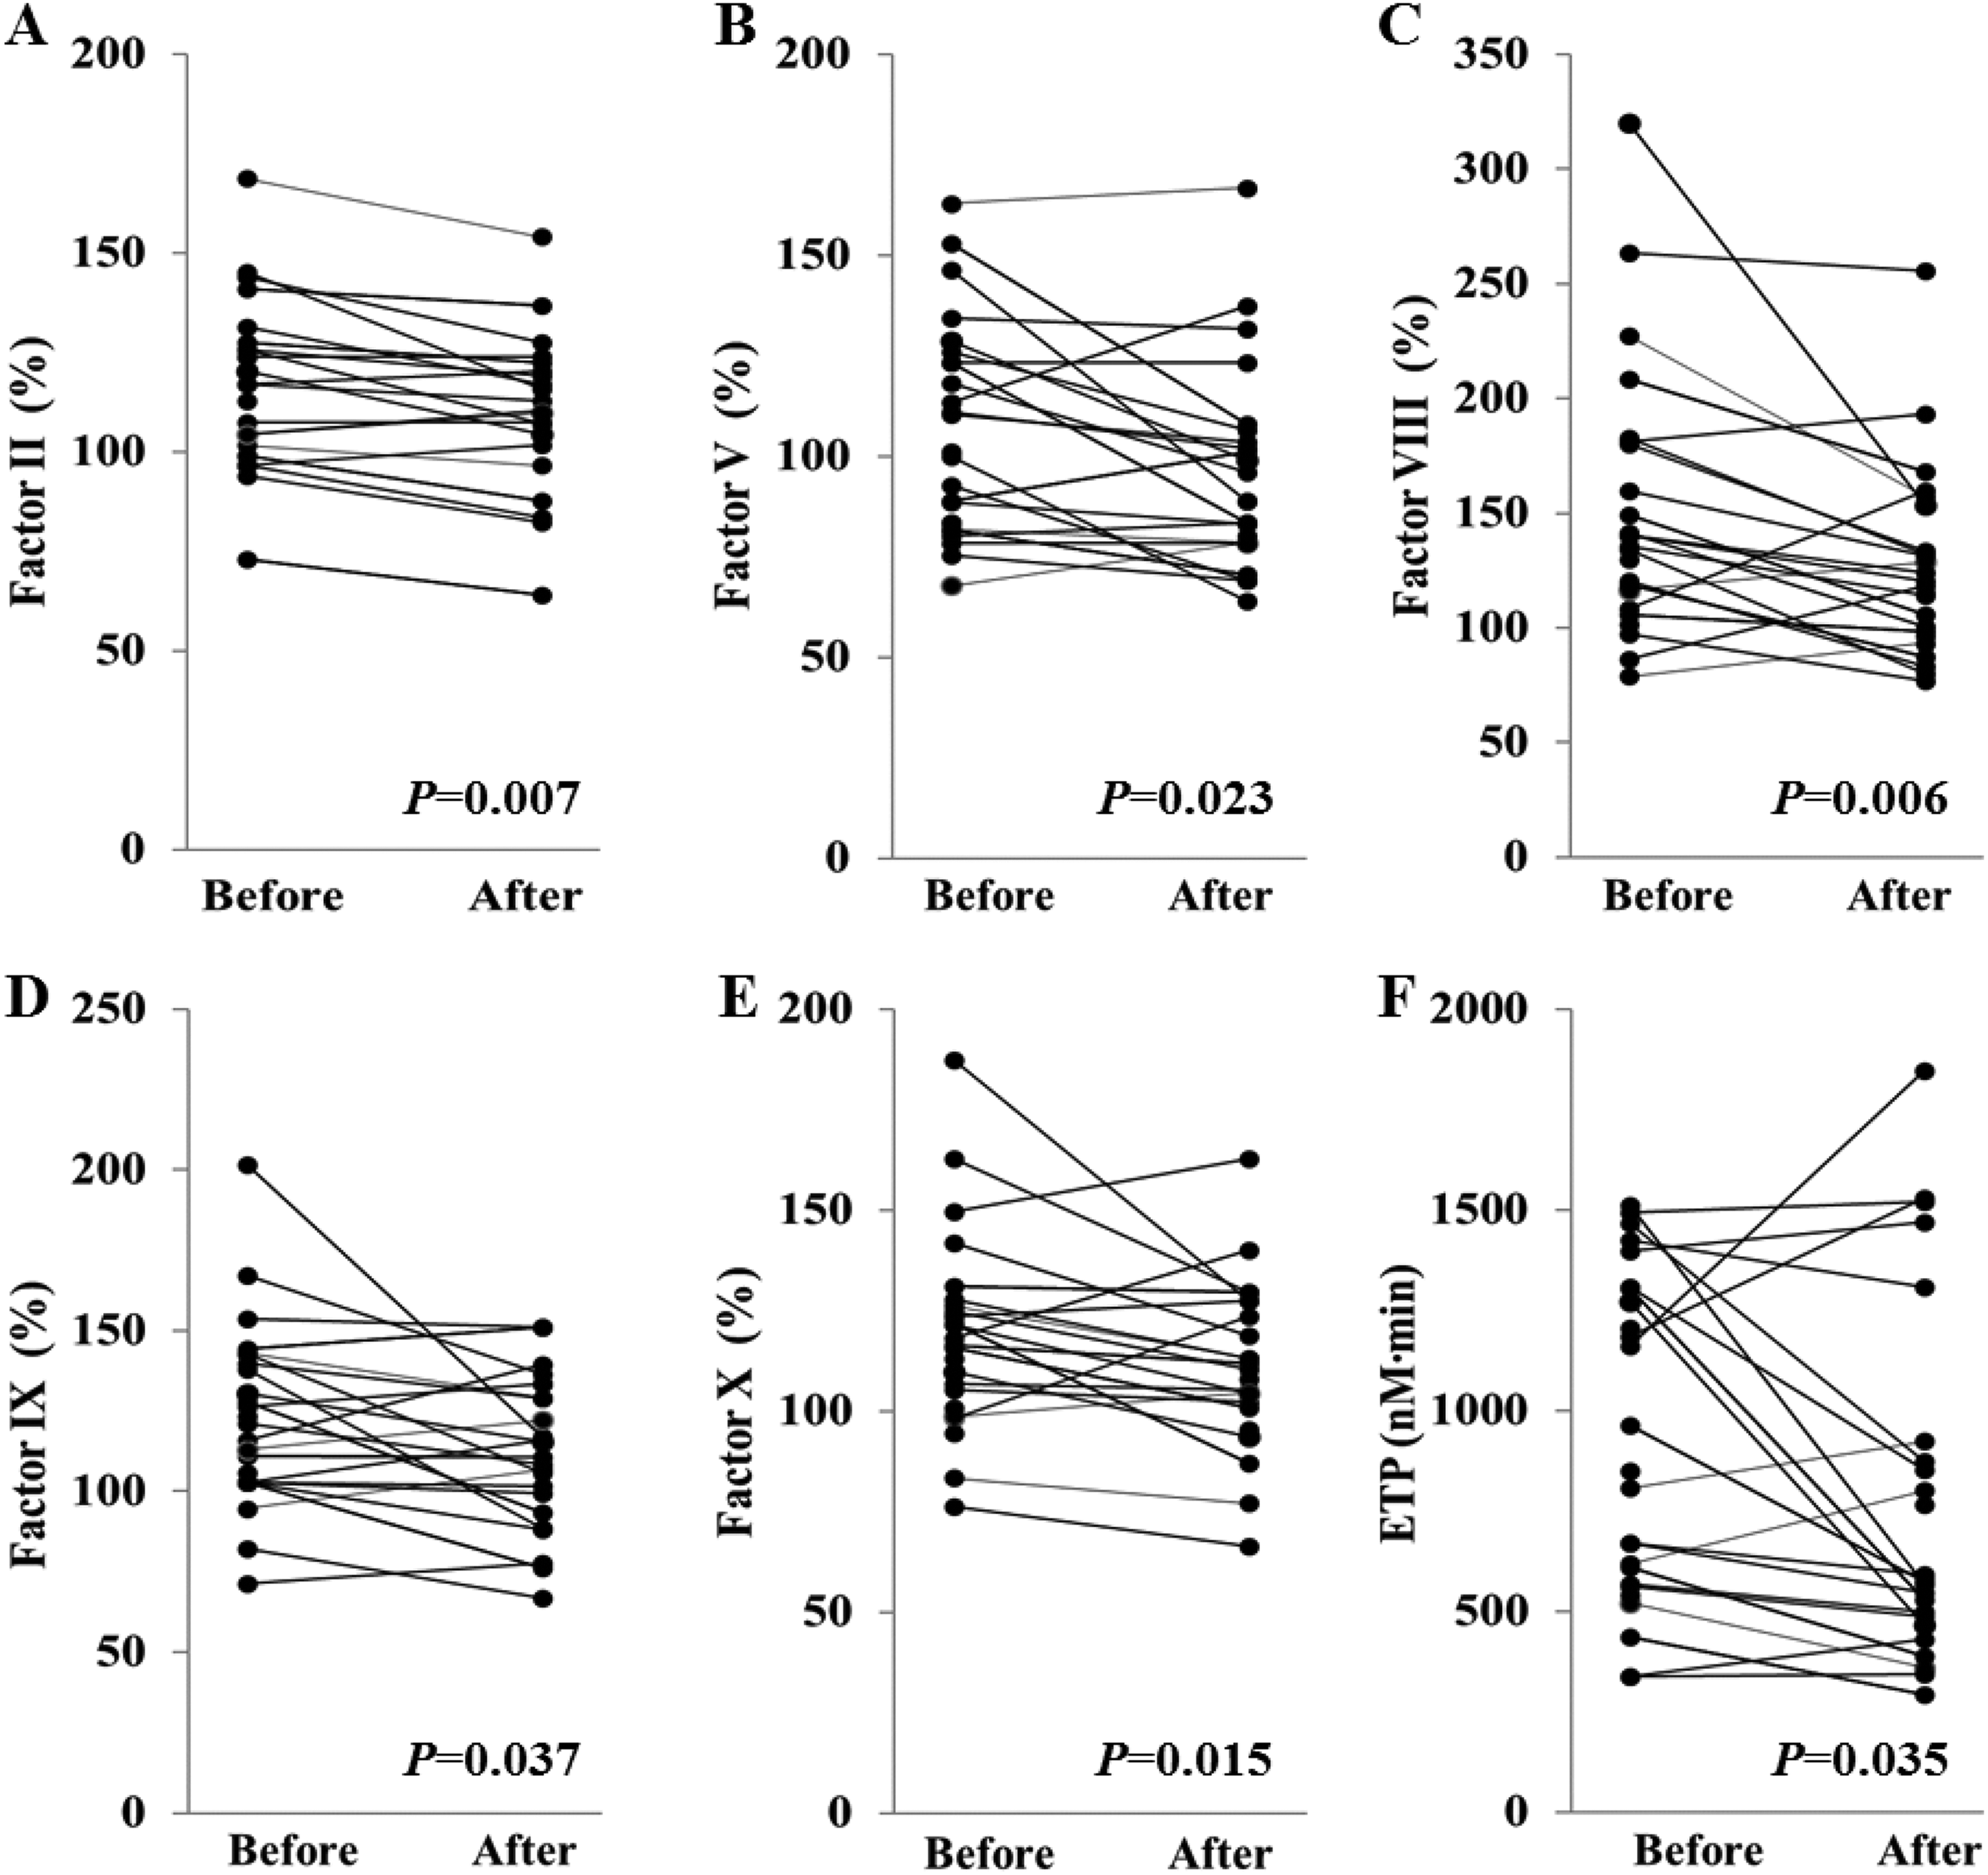
Significant changes in the levels of coagulation factors (II, V, VIII, IX, X) and endogenous thrombin potential (ETP) before and after statin therapy in patients with diabetes (n = 25).
Factors contributing to the parameters measured in TGA were determined by multivariable linear regression analyses (Table 3). Factor V, X, and fibrinogen levels were significant independent positive contributors to the ETP value. Patients with fibrinogen levels of upper quarter range showed significantly higher peak thrombin and ETP level than those with lower quarter range (Supplementary Table 1). Protein C had significant negative correlation with the ETP value. Blood lipid levels did not significantly contribute to the ETP value.
Factors Contributing to the Parameters of Thrombin Generation Assay Determined Using Multivariable Regression Analysis.a
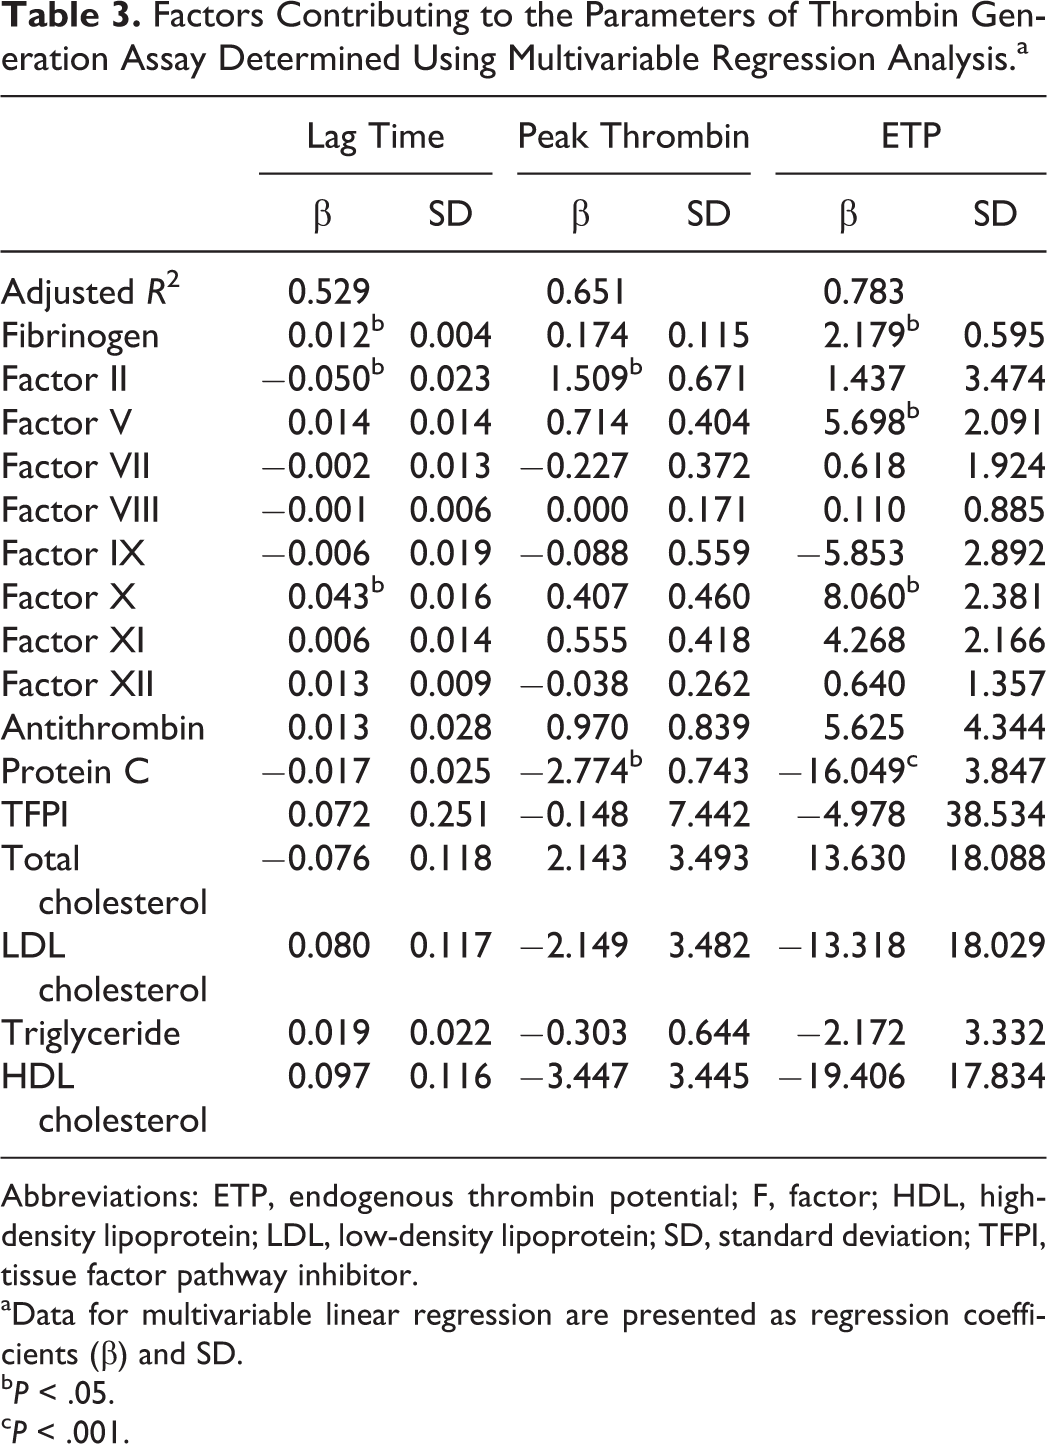
Abbreviations: ETP, endogenous thrombin potential; F, factor; HDL, high-density lipoprotein; LDL, low-density lipoprotein; SD, standard deviation; TFPI, tissue factor pathway inhibitor.
aData for multivariable linear regression are presented as regression coefficients (β) and SD.
b P < .05.
c P < .001.
Relationships between percentage changes in coagulation and anticoagulation factors and blood lipid levels were analyzed (Table 4). Statin-induced triglyceride changes correlated with the changes in factors VII, IX, and X. However, there were no significant correlations between changes in coagulation factors and blood lipids. Changes in antithrombin were significantly correlated with changes in factors II, VIII, X, XI, and XII. Changes in protein C were significantly correlated with changes in factors II, VII, IX, X, XI, and XII. Change in TFPI was correlated with factor V change.
Correlation Between Diabetic Parameters and Coagulation Parameters (n = 25).a
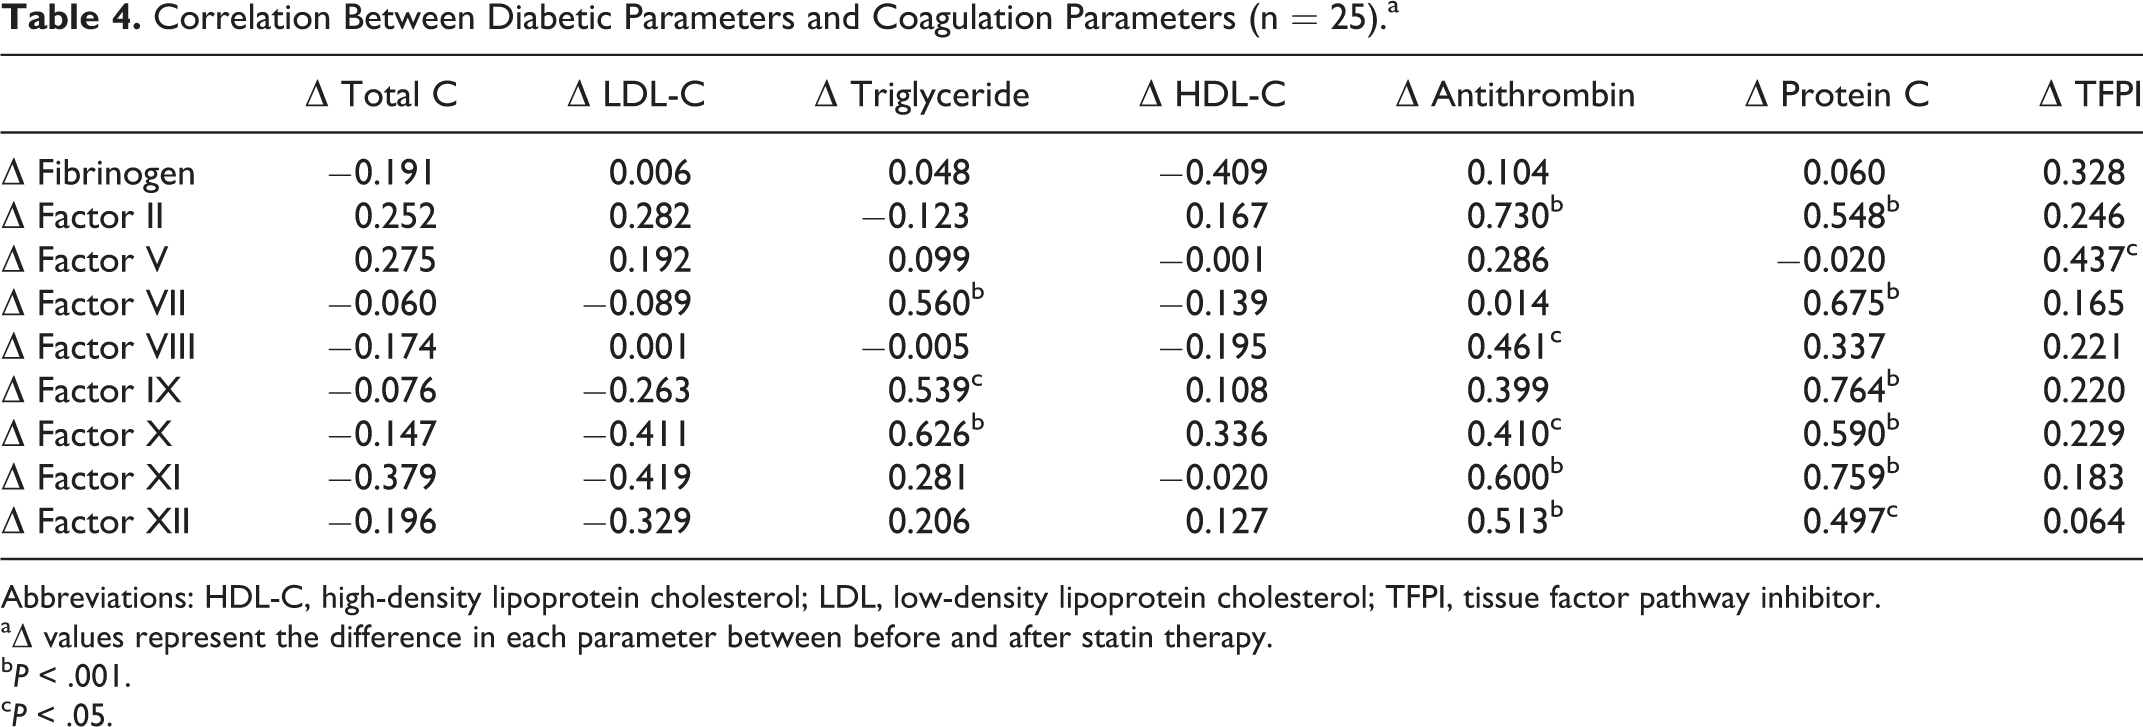
Abbreviations: HDL-C, high-density lipoprotein cholesterol; LDL, low-density lipoprotein cholesterol; TFPI, tissue factor pathway inhibitor.
aΔ values represent the difference in each parameter between before and after statin therapy.
b P < .001.
c P < .05.
Discussion
This study demonstrated that moderate-intensity statin therapy in diabetic patients significantly reduced ETP value and blood lipids. Diabetes is frequently associated with both prothrombotic state and dyslipidemic state, which may accelerate development of cardiovascular diseases. 16 Therefore, the role of statin in reduction of prothrombotic and dyslipidemic states is consistent with current statin treatment guidelines for cardiovascular risk in diabetes. 17
So far, the statin effect on blood coagulation has been reported to be associated with a reduction in individual coagulation factors including VII and VIII. 2,4 However, measurements of individual coagulation factors cannot reflect the in vivo coagulation status because blood coagulation is regulated by a complex system that includes many coagulation and anticoagulation factors interacting with each other. Among global coagulation assays used in our study, TGA could detect the reduction in thrombin generation associated with statin therapy, whereas PT and aPTT could not. In in vitro clotting assays, thrombin continues to be generated in test plasma after clot formation. Both PT and aPTT assays assess only the starting time of clot formation, but TGA measures the total amount of thrombin generated over about 60 minutes of incubation. Therefore, TGA better reflects the in vivo potential of thrombin generation than PT or aPTT. 18 Tripodi et al reported that statin decreases thrombin generation in patients with hypercholesterolemia. 19 Our study demonstrated that statin is associated with thrombin generation in patients with diabetes. Our results suggest that TGA may be used as a laboratory assay for monitoring statin-reduced hypercoagulability in diabetes. Further studies are necessary to evaluate the benefit of TGA assay during statin therapy.
Among TGA parameters, lag time is the initiation time of thrombin generation and ETP is the total amount of thrombin generated in test plasma. In our study, ETP values were found to increase after statin therapy, demonstrating that the statin therapy reduced total thrombin generation. However, the lag time was rather shortened instead of prolongation expected after statin therapy. To explain this paradoxical result, we performed multivariable regression analysis, which revealed the factors contributing to the lag time. Fibrinogen and factor X were positive contributors, indicating that low levels of fibrinogen and factor X might shorten the lag time. Consistent with our result, there was a report that a high level of fibrinogen could prolong the lag time. 20 Although this seems to be paradoxical, low levels of fibrinogen and factor X induced by statin therapy might shorten the lag time of TGA. Fibrinogen and factors V and X were significant positive contributors to ETP. In other words, low ETP values were mainly determined by the low levels of fibrinogen and factors V and X induced by statin therapy.
This study, for the first time to our knowledge, measured the levels of all coagulation factors before and after statin therapy. The levels of factors II, V, VIII, IX, and X were significantly decreased after statin therapy, but those of fibrinogen and factors VII, XI, and XII were not significantly changed. Although there was a paper about statin-induced inhibition of factor II and V activation, 4 there have been no reports about the changes in the levels of intact zymogen factors II and V in consecutive patients undergoing statin therapy. Even in a report that showed statin-induced reduction of factor VIII, 21 the study design was not prospective consecutive measurement, but a case–control study. Our study showed statin-induced reduction in the levels of zymogen factors II, V, VIII, IX, and X based on consecutive measurements, suggesting the effect of statin on their biosynthesis in hepatocytes. The fibrinogen level was not changed by a moderate dose of statin in our study, which is in agreement with other studies. 2,22,23 It has been reported that statin reduces or has no effect on factor VII level. 2,24 In our study, factor VII tended to decrease after statin therapy, but this change was not statistically significant. It could be assumed that statin dose and type may be other variables that affect the factor VII level.
Statin reduced not only coagulation factors but also anticoagulation factors. In our study, antithrombin was significantly reduced and protein C tended to be reduced. Interestingly, the extents of the decrease in anticoagulation factors was related to those of coagulation factors (Table 4). This finding suggests that statin-induced anticoagulation factor reduction may partly offset the antithrombotic effect of statin-induced coagulation factor reduction.
There were no correlations between total cholesterol or LDL cholesterol changes and coagulation factor changes. However, the extent of the decrease in triglycerides was significantly correlated with those of factors VII, IX, and X, which are vitamin K-dependent coagulation factors. It has been reported that blood lipids are correlated with vitamin K-dependent coagulation factors. 15,25 Since vitamin K-dependent coagulation factors could bind to triglyceride-rich lipoprotein, it is likely that the levels of these factors may depend in part on the triglyceride level.
Hyperglycemia may induce NET formation in diabetes. 13 In our study, statin did not change NET formation in diabetic patients. Since statin plays a role in reducing hyperlipidemia but not hyperglycemia, it is likely that statin may not reduce NET formation induced by hyperglycemia.
There was an interesting report about statin-induced thrombin generation reduction in peripheral arterial occlusive disease. 26 Atorvastatin treatment reduced not only thrombin generation but also expression of tissue factor, P-selectin, and CD61 on microparticles. The changed tissue factor would be possible due to decreased microparticles attached to decreased expression P-selectin. This would reduce the expression of tissue factor. 26
This study has some limitations. First, the number of patients was low. However, our study designed in a prospective way and fresh blood samples were collected from consecutive patients. Therefore, we considered the results reliable. Second, the fibrinolytic system and platelet-related markers were not evaluated in our study. We only focused on the effect of statin on the results of global coagulation assays, which are mainly determined by the levels of coagulation and anticoagulation factors. Third, statin doses and types were not synchronized, and it could actually be some other variables that affect the coagulation system. However, this study population was diabetic patients who were treated with low to moderate doses and various kinds of statins. Therefore, our results give us information about the effect of statins on the coagulation system in clinical practice.
In summary, moderate-intensity statin therapy significantly reduced the ETP value and blood lipids, but it did not change PT and aPTT values and NET formation markers. Statin significantly decreased not only the levels of coagulation factors II, V, VIII, IX, and X but also the anticoagulation factor antithrombin. Statin-induced reduction in factors V and X significantly correlated with the reduced ETP value. The extent of the reduction in coagulation factor levels correlate with those of anticoagulation factors, but not with total cholesterol. Our results suggest that TGA is a potential global assay that can detect coagulation status modified by statin therapy. Further study is required to investigate how TGA can be used to guide physicians toward more effective management of the hemostatic effect of statin. Additional studies are required to evaluate the clinical implications of statin-induced simultaneous reduction in both coagulation and anticoagulation factors.
Supplemental Material
Supplemental Material, 180125_supplementary_Tables - Thrombin Generation Assay Detects Moderate-Intensity Statin-Induced Reduction of Hypercoagulability in Diabetes
Supplemental Material, 180125_supplementary_Tables for Thrombin Generation Assay Detects Moderate-Intensity Statin-Induced Reduction of Hypercoagulability in Diabetes by Hee Sue Park, Ja-Yoon Gu, Hyun Ju Yoo, Se Eun Han, Chan Ho Park, Young Il Kim, Il Sung Nam-Goong, Eun Sook Kim, and Hyun Kyung Kim in Clinical and Applied Thrombosis/Hemostasis
Footnotes
Declaration of Conflicting Interests
The author(s) declared no potential conflicts of interest with respect to the research, authorship, and/or publication of this article.
Funding
The author(s) disclosed receipt of the following financial support for the research, authorship, and/or publication of this article: This work (2016R1A2B4015571) was supported by the Mid-career Researcher Program through an NRF grant funded by the Korea government (MSIP).
Supplemental Material
Supplemental material for this article is available online
References
Supplementary Material
Please find the following supplemental material available below.
For Open Access articles published under a Creative Commons License, all supplemental material carries the same license as the article it is associated with.
For non-Open Access articles published, all supplemental material carries a non-exclusive license, and permission requests for re-use of supplemental material or any part of supplemental material shall be sent directly to the copyright owner as specified in the copyright notice associated with the article.