
Abstract
We compared hemorheological parameters in 42 male patients with acute myocardial infarction (AMI), with (n = 22) or without (n = 20) ST-segment elevation and in 20 controls. Plasma and blood viscosity (cP), plasma protein (g/dL) and fibrinogen (mg/dL) concentrations, red (106/µL) and white (103/µL) blood cell counts, hemoglobin concentration (g/dL), and hematocrit (%) were compared. Plasma viscosity was significantly higher in patients with AMI with (P = .012) and without (P = .046) ST-segment elevation than in controls. Patients with AMI with and without ST-segment elevation had significantly lower albumin (P = .002 and P = .009) and globulin (P = .001 and P = .007) concentrations, red blood cell counts (P = .0001 and P = .004), and hematocrit (P = .014 and P = .040) and significantly higher fibrinogen concentrations (P = .0001 and P = .001) than controls. These findings suggest that AMI in males is associated with increased plasma viscosity and fibrinogen concentrations and with decreased albumin and globulin concentrations, erythrocyte count, and hematocrit, regardless of ST-segment elevation.
Introduction
Coronary heart disease is the main cause of mortality in developed countries, with age, gender, diabetes mellitus, hypercholesterolemia, hypertension, and smoking being the principal conventional risk factors for atherosclerosis and acute myocardial infarction (AMI). In addition, hemorheological parameters have been found to be the primary risk factors for ischemic heart disease. 1,2
Blood viscosity results from friction among molecules and cells in the blood. Complete blood viscosity is dependent on cellular components in the blood, including erythrocytes, leukocytes, and thrombocytes as well as plasma viscosity and erythrocyte deformability. Plasma viscosity is affected by high-molecular-weight proteins, including nonspherical fibrinogen, α2-macroglobulin, and immunoglobulin M. 3,4 In healthy people, whole blood viscosity ranges from 3.5 to 7.5 cP and plasma viscosity from 1.15 to 1.50 cP. 5 Blood rheology patterns may be associated with the development of acute coronary syndrome. We therefore investigated the relationship between hemorheological parameters and AMI, with or without ST-segment elevation.
Materials and Methods
Patient Population
A total of 42 male patients with first AMI, with ST-segment elevation (n = 22) or non-ST segment elevation (n = 20), were included at admission to our department. The control group (n = 20) consisted of age-matched healthy males with normal findings on physical examination and on electrocardiogram (ECG) and biochemical analysis. Patients were included if they were nonsmokers and had no previous history of coronary heart disease.
Written informed consent was obtained from each patient following a detailed explanation of the objectives and protocol of the study, which was conducted in accordance with the ethical principles stated in the “Declaration of Helsinki” and approved by our institutional ethics committee.
Assessments
Patients were diagnosed with AMI, with or without ST-segment elevation, in accordance with the World Health Organization criteria for diagnosis of AMI.
6
Blood samples were obtained from unmanipulated veins within 3 days of initial chest pain and prior to treatment in patients with any indication for thrombotic or thrombolytic therapy. Blood and plasma viscosity were measured with a Harkness Capillary Viscometer (Coulter Electronics Ltd, Luton, UK). Transition times from the capillary of 1 mL water and 1 mL heparinized blood at 37°C were determined.
7
Plasma viscosity was measured as described,
8
allowing assessments in volumes as low as 0.5 mL within 1 minute. The flow rate, measured in seconds, of each plasma sample (T
p) was compared with that of distilled water (T
w) to determine the relative plasma viscosity (coefficient of variation, 1.00%). For quality control, measurements were compared with water every day. The viscosity of all the samples was measured in triplicate and expressed as mPa s, which is numerically equal to cP and calculated relative to the viscosity of water at 37°C (η
w) of 0.6915 mPa s, using the following formula:
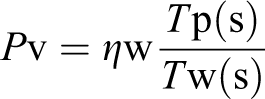
Plasma viscosity was determined using heparinized blood under the same physical conditions and calculated as described earlier. All viscosities were measured in the Department of Biophysics, Istanbul University.
Concentrations of plasma proteins (g/dL), fibrinogen (mg/dL), hemoglobin (Hb; g/dL), red blood cell (RBC; 106/µL), white blood cell (WBC; 103/µL) counts, and hematocrit (%) were measured in the biochemistry laboratory using a Beckman AU-680 Clinical Chemistry Auto Analyzer (Beckman Coulter 2006, Japan), a Siemens BCS-XP Coagulation Auto Analyzer (Siemens 2011; Germany), and a Beckman-LH-780 Blood Count Auto AQ2 Analyzer (Beckman Coulter 2009, Japan), as warranted.
Statistical Analysis
All statistical analyses were performed using SPSS version 15.0 (SPSS Inc, Chicago, Illinois). Normally distributed nominal variables in independent groups were compared using the 1-way analysis of variance and the post hoc Tukey honestly significant difference, whereas nonnormally distributed variables were compared using the Kruskal Wallis test, the Bonferroni correction, and the Mann-Whitney U test. Data were expressed as mean ± standard deviation, median (minimum–maximum), and percentage (%), as appropriate. A P value <.05 was considered statistically significant.
Results
The study included 42 male patients admitted to our department following first AMI with ST-segment elevation (n = 22; mean age: 50.7 ± 8.3 years) or non-ST-segment elevation (n = 20, mean age: 54.2 ± 9.4 years). The mean age of the patients in the control group (n = 20) was 46.6 ± 5.4 years. Considering conventional risk factors, patients with myocardial infarction (MI) were determined to be associated with higher likelihood of body mass index >25 kg/m2 (P = .003), diabetes (P = .02), and hypercholesterolemia (P = .0001) than control participants. All participants were nonsmoker males without prior stroke history and were similar in terms of hypertension rate (Table 1). Similar heart rates (P = .635), systolic blood pressure (P = .131), diastolic blood pressure (P = .801), creatinine concentration (P = .753), and high-density lipoprotein cholesterol concentration (P = .262) were observed in the control and AMI groups (Table 1).
Comparison of AMI-ST-Segment Elevation, AMI-Non-ST-Segment Elevation, and Control Groups With Respect to Baseline Characteristics.
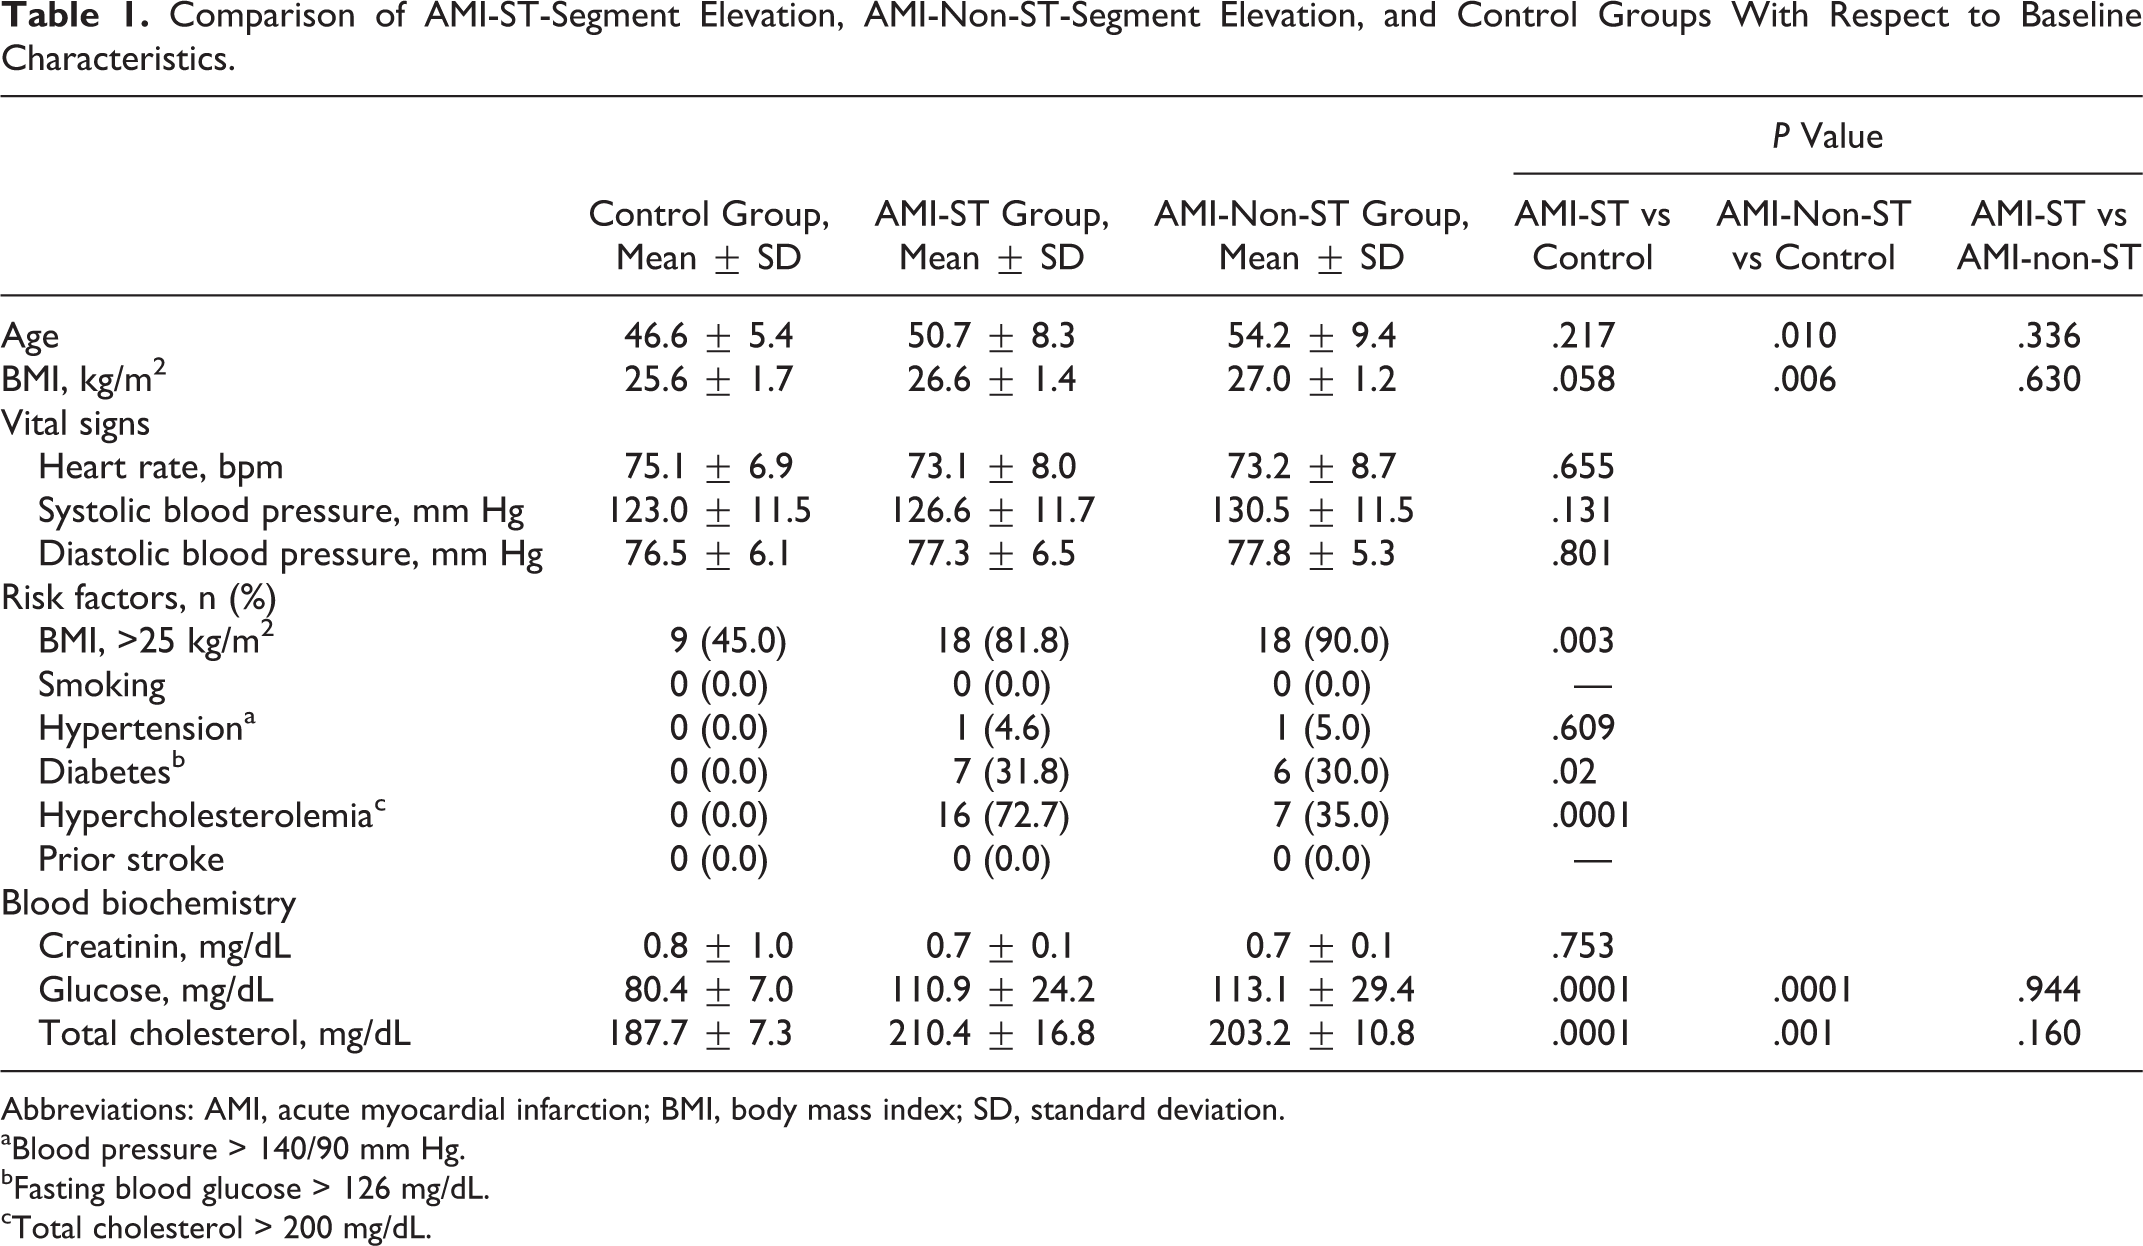
Abbreviations: AMI, acute myocardial infarction; BMI, body mass index; SD, standard deviation.
aBlood pressure > 140/90 mm Hg.
bFasting blood glucose > 126 mg/dL.
cTotal cholesterol > 200 mg/dL.
Plasma viscosity was significantly higher in patients with AMI with (1.45 ± 0.27 cP; P = .012) and without (1.43 ± 0.26 cP; P = .046) ST-segment elevation than in control participants (1.25 ± 0.14 cP). However, blood viscosity in patients with AMI with (3.05 ± 0.99 cP) and without (2.74 ± 0.82 cP) ST-segment elevation was similar to that in the control group (2.43 ± 0.71 cP; P = .156; Table 2).
Comparison of AMI-ST-Segment Elevation, AMI-Non-ST-Segment Elevation, and Control Groups With Respect to Plasma Viscosity, Blood Viscosity, Plasma Proteins, and Cellular Components of Blood.
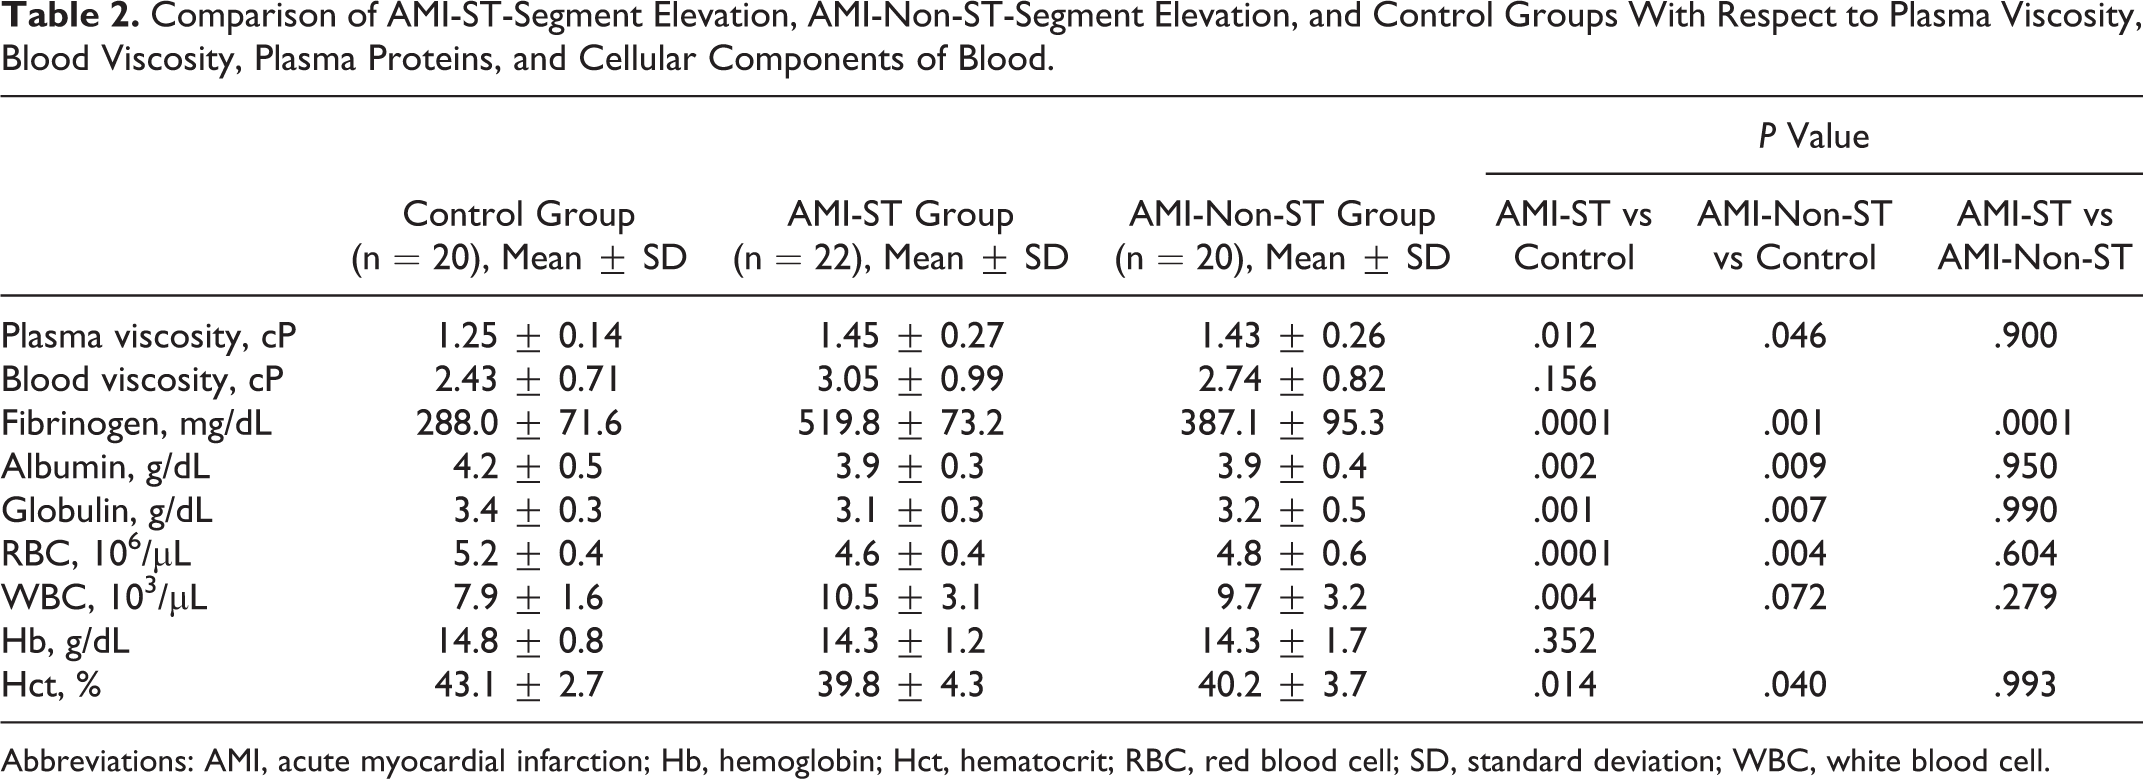
Abbreviations: AMI, acute myocardial infarction; Hb, hemoglobin; Hct, hematocrit; RBC, red blood cell; SD, standard deviation; WBC, white blood cell.
Although fibrinogen concentrations were significantly higher in patients with AMI with than without ST-segment elevation (519.8 ± 73.2 mg/dL vs 387.1 ± 95.3 mg/dL, P = .0001), there were no other significant differences between these 2 groups in plasma/blood viscosity and other biochemical and hematological parameters (Table 2).
Mean fibrinogen concentrations were significantly higher in the patients with AMI with (519.8 ± 73.2 mg/dL, P = .0001) and without (387.1 ± 95.3 mg/dL, P = .001) ST-segment elevation than in the control group (288.0 ± 71.6 mg/dL). In addition, mean WBC count was significantly higher in patients with AMI with ST-segment elevation than in controls (10.5 ± 3.1 × 10³/µL vs 7.9 ± 1.6 × 10³/µL, P = .004; Table 2).
Compared with the control group, patients with AMI with and without ST-segment elevation had significantly lower albumin (P = .002 and P = .009, respectively) and globulin (P = .001 and P = .007, respectively) concentrations and significantly lower RBC counts (P < .001 and P = .004, respectively) and hematocrit (P = .014 and P = .040, respectively). The Hb concentrations were similar in patients with AMI with (14.3 ± 1.2 g/dL) and without (14.3 ± 3.7 g/dL) ST-segment elevation and in the control group (14.8 ± 0.8 g/dL; P = .352; Table 2).
Discussion
We found that plasma viscosity and fibrinogen concentrations were higher, whereas albumin and globulin concentrations, RBC counts, and hematocrits were lower, in AMI patients, regardless of the ST-segment elevation status, than in controls. Patient and control groups had similar blood viscosity and Hb concentrations, whereas WBC counts were significantly higher in patients with AMI with, but not without, ST-segment elevation than in controls. Parameters were similar in patients with AMI with and without ST-segment elevation, except that fibrinogen concentrations were significantly higher in the group with ST-segment elevation.
High blood viscosity has been considered a risk factor for acute coronary syndrome. 9,10 A recent study found that blood and plasma viscosity, as well as fibrinogen concentrations, were higher in 109 patients with ischemic heart disease than in 59 healthy patients. 11 Moreover, the degree of vascular pathology was correlated with viscosity. Similarly, blood and plasma viscosities were found to be higher in 64 patients with AMI <46 years old than in controls during the acute phase of MI, but not 3 months later. 1
A recent study reported significant differences in blood and plasma viscosity and erythrocyte deformability index between groups of patients with ST-segment elevation and non-ST-segment elevation MI. 2 Although we found no significant differences between these 2 groups, except for fibrinogen concentration, where the plasma viscosity tended to be higher in patients with AMI with ST-segment elevation compared with patient without ST-segment elevation. Indeed, not only plasma viscosity but also alterations in blood proteins and cellular components were reported to be more significant in patients with AMI with than without ST-segment elevation. 12,13
The lack of difference in blood viscosity between our patient and control groups, despite the significantly lower hematocrit values in patient than in control groups, may be due to the effects of drugs given to the patients with AMI on erythrocyte aggregation and blood lipid concentrations as well as to the small numbers of patients included in the study population.
Fibrinogen concentration and plasma viscosity are strongly correlated, 14,15 with increases in fibrinogen concentrations associated with decreased blood flow rate and increased thrombotic affinity, both due to increased viscosity. 15 –18 We found that fibrinogen levels were significantly higher in patients with AMI with than without ST-segment elevation and were higher in both the patient groups than in controls. Plasma proteins have been found to influence viscosity, and our findings of reduced albumin and globulin concentrations in patients with AMI were in agreement with the decreases in plasma proteins during AMI. 19 These reductions may be due to increases in the urinary excretion of albumin and globulin and/or changes in plasma proteins, resulting from the acute phase reactions of albumin and globulin, known as negative acute phase reactants. Indeed, a recent study indicated that urinary excretion of α-1 microglobulin and albumin was increased in patients with AMI. 18
Changes in blood cell counts in patients with acute coronary syndrome have been reported to affect long-term prognosis. 20 We found that RBC counts and hematocrit were elevated, relative to controls in both the AMI groups, whereas WBC count was increased only in patients with ST-segment elevation AMI. The AMI has been found to increase erythrocyte aggregation, 20 –22 suggesting that decreased RBC counts during the acute phase of MI may be due to the inhibitory effects of acute inflammatory responses on bone marrow erythroid series.
In conclusion, AMI in males appears to be associated with increases in plasma viscosity and fibrinogen concentrations, along with decreases in albumin and globulin concentrations, RBC counts, and hematocyte levels, regardless of the presence of ST-segment elevation. These findings indicate that reducing plasma viscosity may have clinical benefits for patients. Further studies with larger samples are needed to clarify the exact relationships between AMI and blood viscosity.
Footnotes
Declaration of Conflicting Interests
The author(s) declared no potential conflicts of interest with respect to the research, authorship, and/or publication of this article.
Funding
The author(s) received no financial support for the research, authorship, and/or publication of this article.