
Abstract
Introduction
Globally, aging populations highlight gastrointestinal cancers as a major public health concern. Our study aimed to quantify the trends and inequalities in the burden of gastrointestinal cancers among the elderly from 1990 to 2021.
Methods
Utilizing the 2021 Global Burden of Diseases (GBD) database, our secondary analysis targeted disability-adjusted life-years (DALYs) for gastrointestinal cancers among the elderly (60+). DALYs are a composite indicator of health loss, calculated as the sum of years of life lost due to premature mortality and years lived with disability. The age-standardized DALYs rate (ASDR) was calculated using the direct standardization method. Trends were quantified by estimated annual percentage change in ASDR. The Slope index of inequality (SII) and concentration index were employed to quantify absolute and relative health inequalities.
Results
In 2021, colon and rectum cancer (CRC) had the highest global ASDR among the elderly, followed by stomach cancer (SC), esophageal cancer (EC), pancreatic cancer (PC), liver cancer (LC), and gallbladder and biliary tract cancer (GBTC). Between 1990 and 2021, ASDR for gastrointestinal cancers decreased globally, except for PC. Health inequalities exhibited varied patterns: EC showed a worsening inequality among lower SDI countries in SII, while SC experienced a shift to higher burden among lower SDI countries in SII. LC displayed an improving inequality among lower SDI countries in SII. The concentration index for EC, SC, and LC demonstrated a transition towards higher SDI countries. CRC, GBTC, and PC maintained a higher burden in higher SDI countries, while the SII and concentration index reflected improvements in inequality.
Conclusion
From 1990 to 2021, a substantial decline was observed in the burden of gastrointestinal cancers, except for PC. Persistent and evolving health inequalities highlight the need for comprehensive, multi-level interventions to reduce disparities and achieve equitable health outcomes for all.
Keywords
Introduction
Gastrointestinal (GI) cancers accounted for approximately 3.3 million deaths worldwide in 2022, representing 30.8% of the total cancer mortality. 1 Mortality was highest in colon and rectum cancer (CRC), contributing to 27.19% (904 019 cases) of GI cancer-related deaths, followed by liver cancer (LC) (22.82%, 758 725 cases), stomach cancer (SC) (19.86%, 660 175 cases), pancreatic cancer (PC) (14.06%, 467 409 cases), esophageal cancer (EC) (13.40%, 445 391 cases), and gallbladder and biliary tract cancer (GBTC) (2.68%, 89 055 cases). 1
Globally, the aging of the population is a widespread phenomenon, with nearly every nation witnessing an increase in both the number and proportion of older individuals. 2 In 2019, the elderly population aged 60 and older reached 1 billion worldwide, with forecasts predicting an increase to 1.4 billion by 2030 and 2.1 billion by 2050. 3 Additionally, malignant diseases are closely linked to aging, with a significant increase in prevalence and mortality among the elderly population.4-6 Older adults frequently suffer from comorbidities like diabetes and cerebrovascular diseases, impacting cancer risk and diagnosis stage. Furthermore, these conditions decrease the patient’s therapeutic tolerance, heighten the risk of hospitalization, and are associated with a decline in overall survival rates.7,8
In epidemiological investigations, disability-adjusted life years (DALYs) quantify the total health loss by combining years of life lost due to premature mortality (YLLs) and years lived with disability (YLDs). 9 This metric provides a comprehensive measure of disease burden, essential for guiding public health policy, evaluating preventive strategies, and analyzing global health trends. Previous research has revealed a downward trend between 2000 and 2021 in all-ages age-standardized disability-adjusted life-years rates (ASDR) for multiple GI cancers. Furthermore, several studies been conducted to estimate the global burden of GI cancers focusing on the adolescent and young adult population.10-15 Nonetheless, prior studies have largely neglected gastrointestinal cancers in the elderly, with limited comparative analyses of ASDR across different countries and regions. Long-term trend analyses of ASDR over decades are also lacking. Additionally, with the goal of reducing inequalities and attaining “health for all,” the World Health Organization (WHO) has advocated a universal health coverage policy. 16 Identifying the unequal distribution of DALYs for gastrointestinal cancer among regions and countries is fundamental for targeted resource allocation strategies. However, the global and regional inequalities in the ASDR of GI cancers among older adults remain unquantified, and their changing patterns have not been systematically investigated.
To address the current knowledge gaps in the disease burden of ASDR for GI cancers in the elderly, we conducted this secondary analysis by leveraging the latest data from the Global Burden of Disease (GBD) 2021. The three objectives of our research were (i) to investigate trends in the ASDR for GI cancers across global, GBD super-regional, and national levels; (ii) to quantify cross-country inequalities in ASDR among elderly, both in absolute and relative terms, at global and GBD super regional scales; and (iii) to assess changing patterns of these health inequalities over the period from 1990 to 2021.
Methods
Data Sources and Disease Definitions
In our secondary analyses, we utilized the Global Health Data Exchange (GHDx) results tool (https://vizhub.healthdata.org/gbd-results/) to extract data for the six major GI cancers (esophageal cancer, stomach cancer, colon and rectum cancer, liver cancer, gallbladder and biliary tract cancer, and pancreatic cancer). The GBD 2021 study comprehensively assessed the burden and health impacts of 371 diseases and injuries, 17 288 causes of death, 18 and 88 risk factors 19 in 204 countries and territories. Methodological details for the GBD Study 2021 are available in prior research.17-19 Six GI cancers were identified through the application of the International Classification of Diseases, 18 Ninth and Tenth Revisions (ICD-9 and ICD-10), with additional details in Supplemental Table 1. Furthermore, following the WHO’s criteria, the term “elderly” refers to individuals who are 60 years and older. 20
To ensure scientific rigor and reliability, this analysis was conducted in strict compliance with the GATHER guidelines (Supplemental Table 2). 21
GBD Super Regions and Socio-Demographic Index
Researchers in the GDB database have established 21 regions based on two criteria: epidemiological homogeneity and geographic contiguity. 22 Seven GBD super regions were then developed by grouping the 21 GBD regions with similar cause-of-death patterns, including: High-income; Latin America and Caribbean; Central Europe, Eastern Europe, and Central Asia; North Africa and Middle East; Sub-Saharan Africa; South Asia; Southeast Asia, East Asia, and Oceania (Supplemental Table 3). 22 In our study, we focused on the trends and health inequities of disease burden for GI cancers among elderly in seven super-regions.
The Socio-demographic Index (SDI), a comprehensive metric of development status from GBD researchers, is significantly linked to health outcomes. 23 It derives from the geometric mean of three development indices: mean education for ages 15 and above (EDU15+), total fertility rate under 25 (TFU25), and lag-distributed income (LDI) per capita. Countries and territories with an SDI score of 0 represent the lowest theoretical health-related development, while a value of 1 indicates the highest level (Supplemental Tables 4, 5).
Statistical Analysis
Disease Burden of GI Cancers in Elderly
Our study quantified the disease burden of GI cancers by analyzing the age-standardized DALYs rates (ASDR) (per 100 000 population) at global, GBD super regional and national levels from 1990 to 2021. Additionally, global maps visually depict the disparities in ASDR across the globe.
Age-Standardized DALYs Rates (ASDR)
With the direct standardization method, we calculated the ASDR (per 100 000 population) of GI cancers among elderly,24-26 according to the formula:
Estimated Annual Percentage Change (EAPC)
Estimated annual percent change (EAPC) with 95% confidence intervals (CIs) were used to assess the temporal trends in ASDR for GI cancers among elderly from 1990 to 2021.24,28 The EAPC was computed using the log-linear regression model outlined below:
Health Inequalities Analysis
We applied the WHO-recommended Slope Index of Inequality (SII) and concentration index, based on SDI, to quantify absolute and relative health inequalities in ASDR for GI cancers among elderly globally and across GBD super-regions.29-31 Detailed information can be found in the WHO book Handbook on Health Inequality Monitoring, accessible via the provided link (https://iris.who.int/handle/10665/85345). 31
The SII quantified absolute disparities in ASDR between the highest and lowest SDI levels while considering the entire population distribution. We calculated it by regressing country-specific GI cancer ASDR on a relative position scale linked to SDI, set as the midpoint of the population range sorted by cumulative SDI. 31 Robust linear regression models were employed to address heteroscedasticity, effectively reducing outlier impact and enhancing the reliability and stability of trend estimates. 29 A zero SII value indicated equality in ASDR between countries/territories at different SDI levels. Positive values imply a greater ASDR burden in higher SDI countries/territories, whereas negative values point to a concentration in lower SDI countries/territories.
Additionally, the concentration index measured relative inequality, quantifying the extent of the health burden deviation from perfect equality. The calculation was based on the area under the Lorenz curve, showing the cumulative ASDR fraction plotted against the population distribution ranked by SDI. 31 Depending on the position of the curve in relation to the line of equality (45-degree line), it indicated that the burden of ASDR was higher in lower SDI countries/territories when the curve exceeded this line (negative concentration index), while higher SDI countries/territories bore a disproportionately larger burden of ASDR when the curve was situated below it (positive concentration index). If all individuals had the same health level regardless of their SDI levels, the curve would follow the line of equality (the concentration index equals zero). More detailed calculations of the Slope Index of Inequality (SII) and the concentration index can be found in Supplemental material. 31
With larger absolute values reflecting more pronounced inequalities, these indices provided complementary insights into both absolute and relative inequalities, thereby facilitating a comprehensive evaluation of health inequities across global and GBD super regional levels.29-31 From 1990 to 2021, six change patterns of health inequality were observed: the increase of inequality in higher SDI countries (HIH), the decrease of inequality in higher SDI countries (HDH), the increase of inequality in lower SDI countries (LIL), the decrease of inequality in lower SDI countries (LDL), a transition to heavier burdens in higher SDI countries (LTH), and a transition to heavier burdens in lower SDI countries (HTL) (Figure 1). Six Changing Patterns of Health Inequalities in Age-Standardized DALYs Rates for Gastrointestinal Cancers Among Elderly From 1990 to 2021. “H” Represents Higher SDI Countries; “L” for Lower SDI Countries. “I” for Increase; “D” for Decrease; “T” for Transition. DALYs, Disability-Adjusted Life Years.
The statistical analyses in this study were conducted with R version 4.4.1 and Stata 17.0, ensuring that the methodology was both rigorous and the results were reliable.
Ethical Approval and Consent to Participate
The GBD 2021 employed de-identified aggregate data for analysis. The University of Washington Institutional Review Board reviewed and granted a waiver for informed consent (https://www.healthdata.org/research-analysis/gbd).
Results
Global Level
Age-Standardized DALYs Rates for GI Cancers Among Elderly Globally in 1990 and 2021, With the Slope Index of Inequality and Concentration Index in Global ASDR.

ASDR, age-standardized DALYs rates; DALYs, disability-adjusted life years; CI, confidence interval; EAPC, estimated annual percentage change; SII, slope index of inequality; EC, esophageal cancer; SC, stomach cancer; CRC, colon and rectum cancer; LC, liver cancer; GBTC, gallbladder and biliary tract cancer; PC, pancreatic cancer.

Age-Standardized DALYs Rates for GI Cancers Among Elderly at Global and GBD Super Regional Levels in 2021, With Estimated Annual Percent Change From 1990 to 2021. (A) Age-Standardized DALYs Rates in 2021; (B) Estimated Annual Percent Change From 1990 to 2021. DALYs, Disability-Adjusted Life Years. GBD, Global Burden of Diseases. HI, High-Income; LAC, Latin America and Caribbean; EEA, Central Europe, Eastern Europe, and Central Asia; NAME, North Africa and Middle East; SSA, Sub-saharan Africa; SA, South Asia; AAO, Southeast Asia, East Asia, and Oceania.
Esophageal Cancer
In 2021, Southeast Asia, East Asia, and Oceania exhibited the highest ASDR (1365.79 [95% CI: 1097.61-1661.74]/100 000 population), while North Africa and Middle East reported the lowest ASDR (242.83 [95% CI: 207.41-275.17]/100 000 population) among GBD super regions (Figure 2A, Supplemental Table 7). Significant downward trends were noted across all GBD super regions between 1990 and 2021, with Southeast Asia, East Asia, and Oceania showing the lowest EAPC of −1.92 (95% CI: −2.12 to −1.72) (Figure 2B, Supplemental Table 7). At the national level, Malawi, Mongolia, and Zambia Islands recorded the highest ASDR of EC among elderly in 2021 (Supplemental Table 8, Supplemental Figure 1A). Northern Mariana Islands demonstrated the highest EAPC while Uzbekistan had the lowest (Supplemental Table 8, Supplemental Figure 1B).
Globally, the ASDR of EC presented a growing inequality among countries with lower SDI in SII, switching from −254.129 to −308.907 (Table 1, Figure 3A). Concurrently, the concentration index of EC ASDR shifted from −0.157 in 1990 to 0.012 in 2021 (Figure 3A). This reflected intricate shifts in inequality patterns between 1990 and 2021. At GBD super regional levels, lower SDI countries/territories in Central Europe, Eastern Europe, and Central Asia had experienced improvements of health inequality as measured by SII and concentration index (Figure 3A, Supplemental Table 9, and Supplemental Figures 2, 3). In contrast, Southeast Asia, East Asia, and Oceania exhibited an increase of health inequality in higher SDI countries/territories according to these indices. In 2021, South Asia reported the lowest negative SII at −148.194 and concentration index at −0.069 (Figure 3A, and Supplemental Table 7). Conversely, Sub-Saharan Africa recorded the highest positive SII score of 407.382, while Southeast Asia, East Asia, and Oceania demonstrated the most positive concentration index score of 0.157. Absolute and Relative Health Inequalities of ASDR for Esophageal Cancer, Stomach Cancer, and Colon and Rectum Cancer Among Elderly at Global and GBD Super Regional Levels, 1990 and 2021. (A1) Health Inequality Regression Curves for Esophageal Cancer. (A2) Concentration Curves for Esophageal Cancer. (A3) Changes of SII for Esophageal Cancer. (A4) Changes of Concentration Index for Esophageal Cancer. (B1) Health Inequality Regression Curves for Stomach Cancer. (B2) Concentration Curves for Stomach Cancer. (B3) Changes of SII for Stomach Cancer. (B4) Changes of Concentration Index for Stomach Cancer. (C1) Health Inequality Regression Curves for Colon and Rectum Cancer. (C2) Concentration Curves for Colon and Rectum Cancer. (C3) Changes of SII for Colon and Rectum Cancer. (C4) Changes of Concentration Index for Colon and Rectum Cancer. ASDR, Age-Standardized DALY Rate. DALYs, Disability-Adjusted Life Years. SDI, Socio-Demographic Index. SII, Slope Index of Inequality. CI, Concentration Index. HI, High-Income; LAC, Latin America and Caribbean; EEA, Central Europe, Eastern Europe, and Central Asia; NAME, North Africa and Middle East; SSA, Sub-saharan Africa; SA, South Asia; AAO, Southeast Asia, East Asia, and Oceania.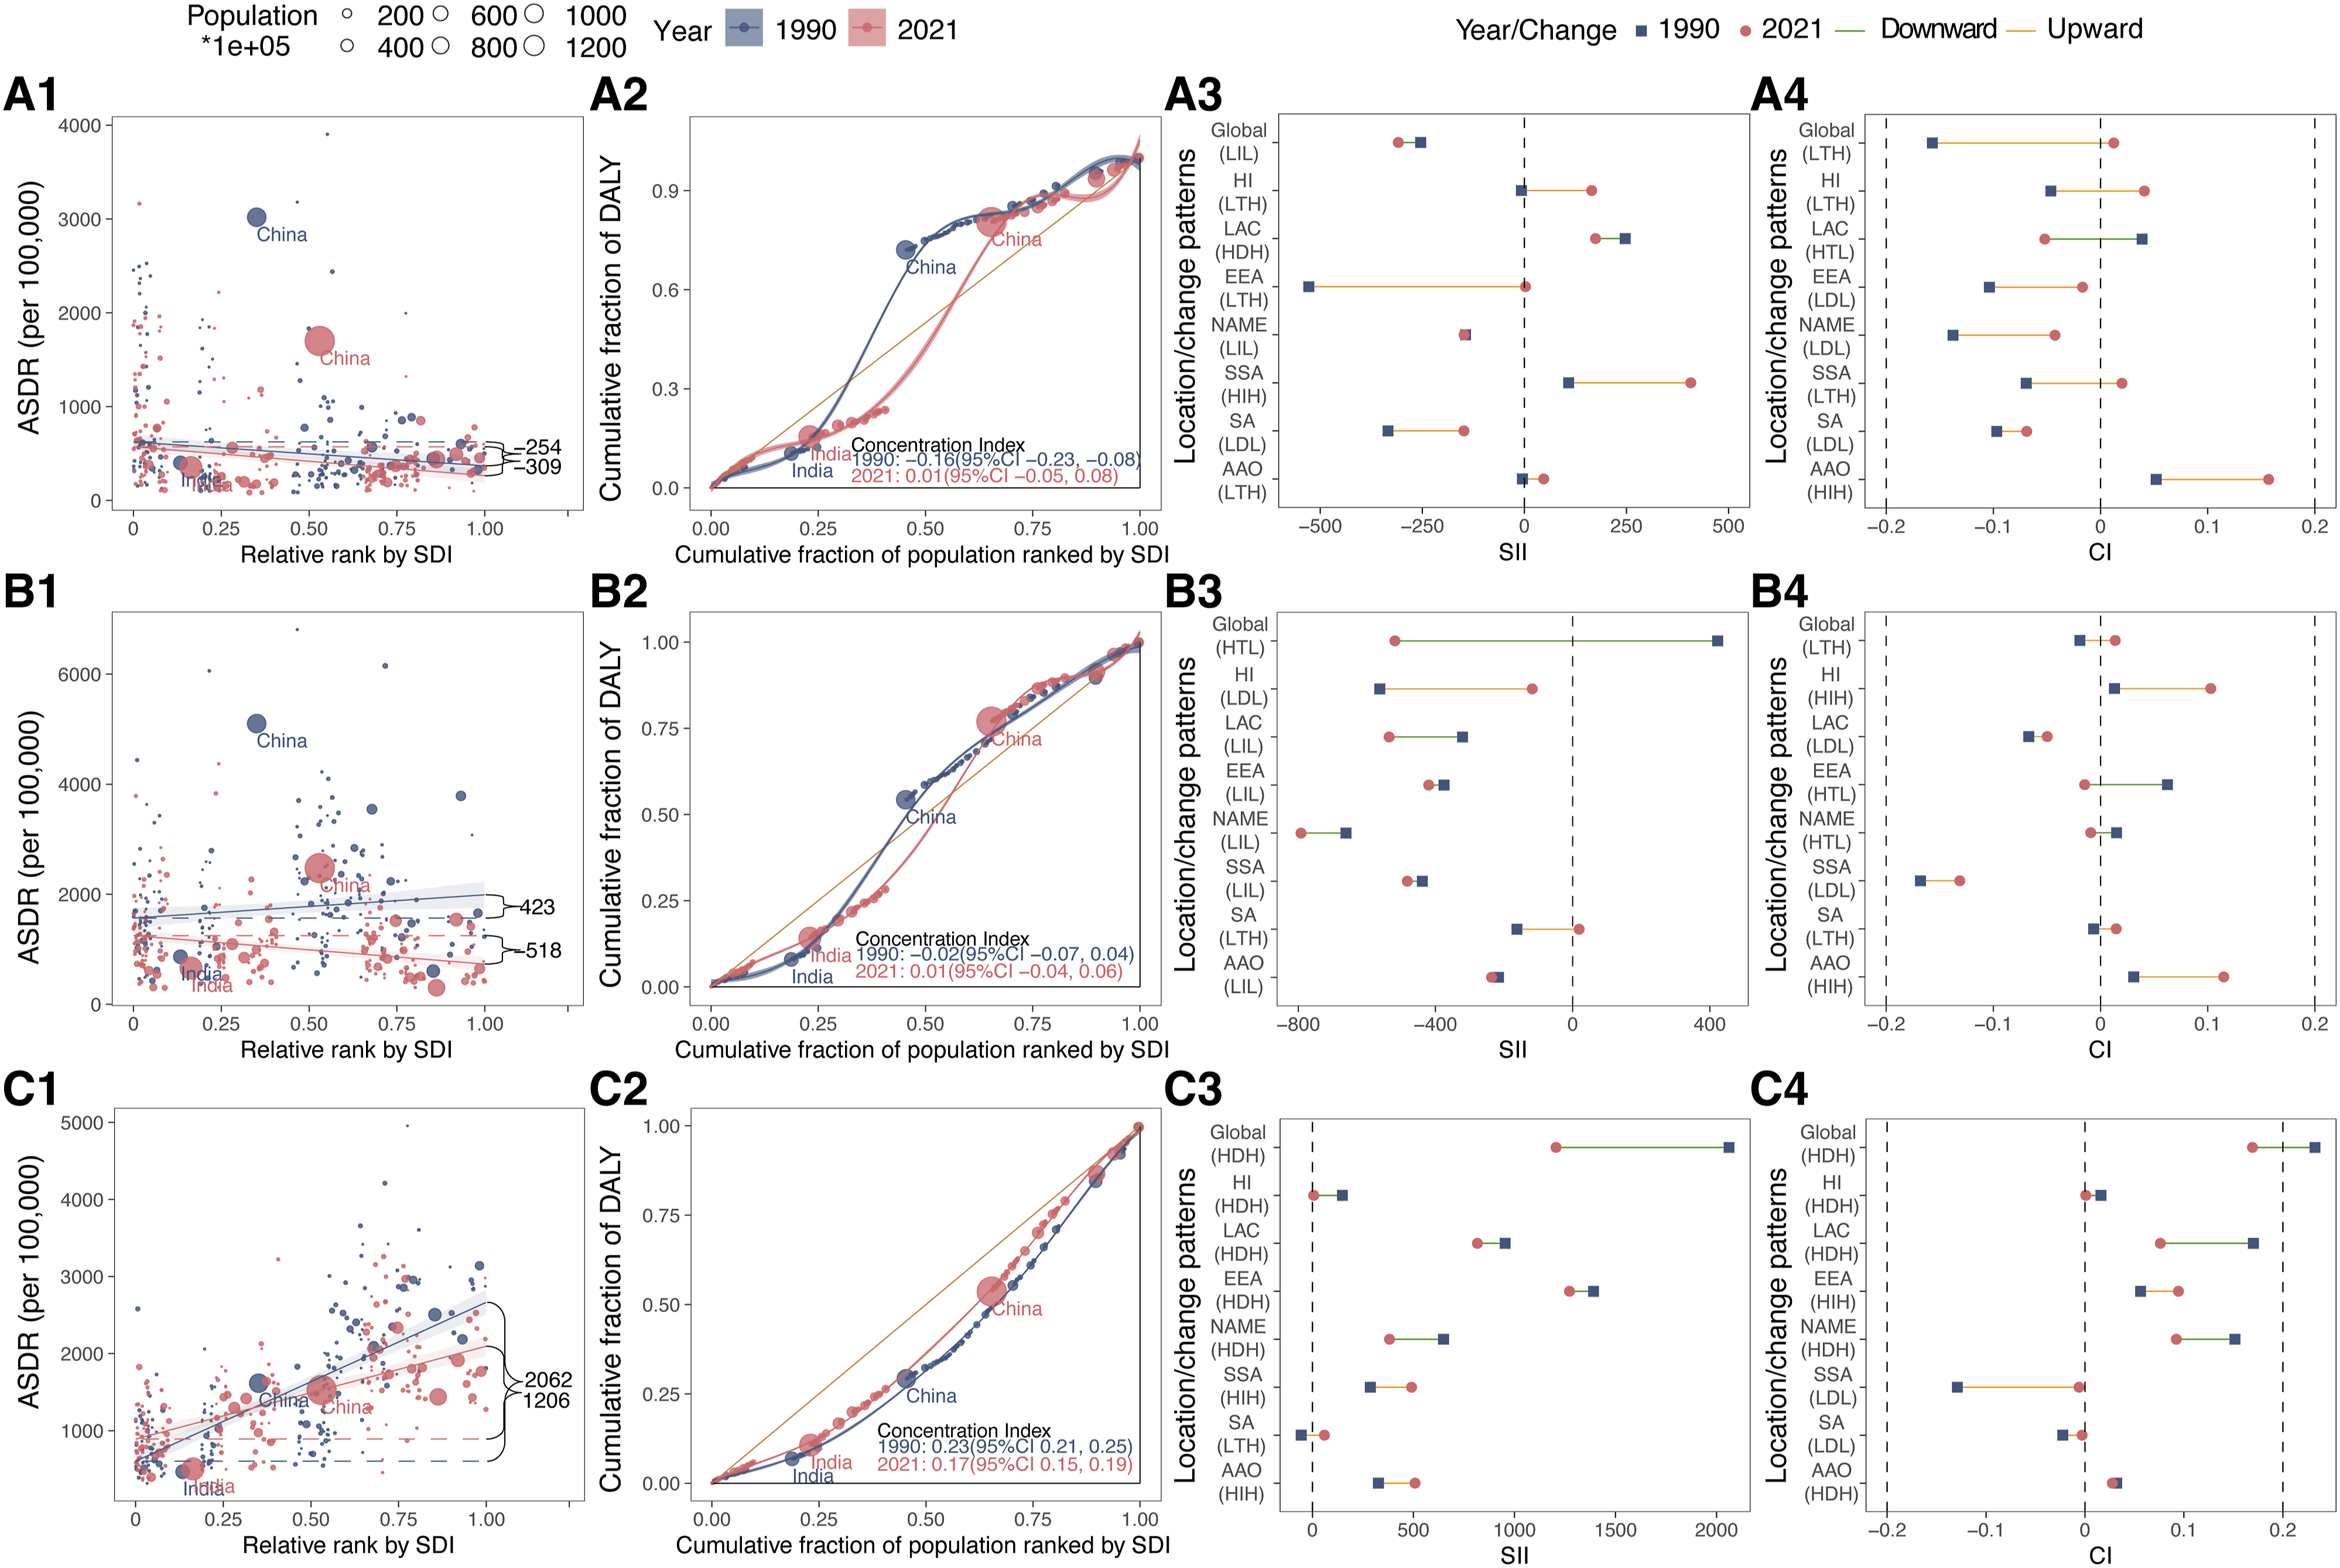
Stomach Cancer
In 2021, Southeast Asia, East Asia, and Oceania exhibited the largest ASDR (2079.69 [95%CI: 1629.98-2552.67]/100 000 population), while South Asia reported the lowest ASDR (645.17 [95%CI: 548.23-773.55]/100 000 population) for SC among elderly across GBD super regions (Figure 2A, Supplemental Table 10). Between 1990 and 2021, significant downward trends in all GBD super regions were observed, with the lowest EAPC recorded in Central Europe, Eastern Europe, and Central Asia (EAPC = −2.87, 95%CI: −2.95 to −2.79) (Figure 2B). In 2021, Mongolia, Bolivia (Plurinational State of), and Afghanistan were identified as the top three nations with the largest ASDR from SC among elderly (Supplemental Table 11, Supplemental Figure 4A). Furthermore, Egypt recorded the highest EAPC, opposite to Republic of Korea’s record for the lowest (Supplemental Table 11, Supplemental Figure 4B).
The global ASDR burden for SC among elderly was initially concentrated in higher SDI countries/territories in 1990, with SII of 422.610. By 2021, this concentration had shifted to lower SDI countries/territories, with SII of −518.179 (Table 1, Figure 3B). However, the concentration index for SC shifted from −0.019 in 1990 to 0.014 in 2021, indicating a transition towards higher SDI countries (Figure 3B). In terms of SII and concentration index, Latin America and Caribbean, Sub-Saharan Africa showed heavier burden in lower SDI countries/territories across GBD super regions from 1990 to 2021 (Figure 3B, Supplemental Table 12, and Supplemental Figures 2, 3). The lowest negative SII was found in North Africa and Middle East (−791.962) in 2021, with the lowest negative concentration index in the Sub-Saharan Africa (−0.131) (Figure 3B, and Supplemental Table 10). Conversely, South Asia exhibited the highest positive SII (19.049), and Southeast Asia, East Asia, and Oceania showed the most positive concentration index (0.115) in 2021.
Colon and Rectum Cancer
For GBD super regions in 2021, Central Europe, Eastern Europe, and Central Asia demonstrated the highest ASDR of 2294.48 (95% CI: 2130.02-2434.67) per 100 000 population, and South Asia had the lowest at 508.33 (95% CI: 450.88-574.54) per 100 000 population (Figure 2A, Supplemental Table 13). The most positive EAPC was observed in Latin America and Caribbean (0.58, 95% CI: 0.54 to 0.61), while High-income experienced the lowest negative EAPC (−1.38, 95% CI: −1.42 to −1.33) between 1990 and 2021 (Figure 2B). For the year 2021, Hungary, Uruguay, and Bulgaria topped the list of countries with the highest ASDR of CRC among older adults, as illustrated in Supplemental Figure 5A (Supplemental Table 14). Over the period from 1990 to 2021, Lesotho exhibited the steepest increase with EAPC at 2.74, whereas Poland showed the largest decline with EAPC of −2.37 (Supplemental Table 14, Supplemental Figure 5B).
In 1990 and 2021, higher SDI countries/territories bore the predominant burden of CRC ASDR for the elderly. Over this period, the SII of global ASDR for CRC showed a decline from 2061.698 (95% CI: 1791.423, 2331.973) to 1205.512 (95% CI: 1006.396, 1404.629), indicating a reduction in inequality (Table 1, Figure 3C). Concurrently, the concentration index fell from 0.232 (95% CI: 0.212, 0.253) to 0.169 (95% CI: 0.148, 0.191), reflecting a more equitable distribution (Figure 3C). Notably, the GBD super regions of High-income, Latin America and the Caribbean, and North Africa and the Middle East had shown a reduction in inequality among higher SDI countries/territories, indicated by improvements in terms of SII and concentration index (Figure 3C, Supplemental Table 15, and Supplemental Figures 2, 3). In 2021, Central Europe, Eastern Europe, and Central Asia reported the highest positive SII (1272.252) and concentration index (0.094) (Figure 3C, Supplemental Table 13). Conversely, the lowest positive SII was observed in High-income (6.305), while the lowest negative index was in Sub-Saharan Africa, at −0.006 (Figure 3C, Supplemental Table 13).
Liver Cancer
In 2021, Sub-Saharan Africa had the highest ASDR at 810.22 (95% CI: 677.55-980.07) per 100 000 population across the GBD super regions, while Latin America and Caribbean recorded the lowest at 290.62 (95% CI: 264.02-315.52 per 100 000 population (Figure 2A, Supplemental Table 16). Furthermore, South Asia achieved the greatest increase (EAPC = 0.95, 95% CI: 0.87 to 1.03), while Sub-Saharan Africa experienced the deepest decrease (EAPC = −0.89, 95% CI: −1.04 to −0.73) (Figure 2B, Supplemental Table 16). At national level, Mongolia, Gambia, and Mali were identified as having the highest ASDR for LC among elderly in 2021 (Supplemental Table 17, Supplemental Figure 6A). Additionally, Poland achieved the highest EAPC from 1990 to 2021, whereas Zambia demonstrated the lowest (Supplemental Table 17, Supplemental Figure 6B).
From 1990 to 2021, the global SII for LC ASDR in elderly showed a reduction of inequality with heavier burden in lower SDI countries/territories, declining from −482.752 (95% CI: −673.273, −292.231) to −159.492 (95% CI: −294.749, −24.236) (Table 1, Figure 4A). In contrast, the concentration index for LC ASDR in older adults started with a relatively equitable distribution in 1990 at −0.041 (95% CI: −0.110, 0.029) and then became more concentrated in higher SDI countries/territories by 2021 (Figure 4A), reaching 0.051 (95% CI: 0.003, 0.098). Within GBD super regions, Central Europe, Eastern Europe, and Central Asia and Sub-Saharan Africa exhibited a reduction in health inequality among higher SDI countries/territories, as demonstrated by advancements in the SII and concentration index (Figure 4A, Supplemental Table 18, and Supplemental Figures 2, 3). In 2021, Sub-Saharan Africa exhibited the most pronounced negative SII value at - 543.361, while the North Africa and Middle East demonstrated the highest positive SII at 175.976 (Figure 4A, Supplemental Table 16). Additionally, North Africa and Middle East reported the maximum negative concentration index at −0.184, while High-income achieved the highest positive concentration index, 0.056 (Figure 4A, Supplemental Table 16). Absolute and Relative Health Inequalities of ASDR for Liver Cancer, Gallbladder and Biliary Tract Cancer, and Pancreatic Cancer Among Elderly at Global and GBD Super Regional Levels, 1990 and 2021. (A1) Health Inequality Regression Curves for Liver Cancer. (A2) Concentration Curves for Liver Cancer. (A3) Changes of SII for Liver Cancer. (A4) Changes of Concentration Index for Liver Cancer. (B1) Health Inequality Regression Curves for Gallbladder and Biliary Tract Cancer. (B2) Concentration Curves for Gallbladder and Biliary Tract Cancer. (B3) Changes of SII for Gallbladder and Biliary Tract Cancer. (B4) Changes of Concentration Index for Gallbladder and Biliary Tract Cancer. (C1) Health Inequality Regression Curves for Pancreatic Cancer. (C2) Concentration Curves for Pancreatic Cancer. (C3) Changes of SII for Pancreatic Cancer. (C4) Changes of Concentration Index for Pancreatic Cancer. ASDR, Age-Standardized DALY Rate. DALYs, Disability-Adjusted Life Years. SDI, Socio-Demographic Index. SII, Slope Index of Inequality. CI, Concentration Index. HI, High-Income; LAC, Latin America and Caribbean; EEA, Central Europe, Eastern Europe, and Central Asia; NAME, North Africa and Middle East; SSA, Sub-saharan Africa; SA, South Asia; AAO, Southeast Asia, East Asia, and Oceania.
Gallbladder and Biliary Tract Cancer
In 2021, South Asia demonstrated the highest ASDR of 284.74 (95% CI: 200.35-340.44) per 100 000 population among GBD super regions, in stark contrast to Sub-Saharan Africa, which exhibited the lowest ASDR of 65.95 (95% CI: 45.77-84.92) per 100 000 population (Figure 2A, Supplemental Table 19). Furthermore, between 1990 and 2021, South Asia (EAPC = 0.99, 95% CI: 0.92 to 1.06) experienced the most notable rise in ASDR for GBTC among elderly, while Latin America and Caribbean (EAPC = −1.85, 95% CI: −1.99 to −1.7) witnessed the steepest decrease (Figure 2B). In 2021, Chile, Thailand, and Bolivia (Plurinational State of) were identified as top three countries with ASDR for GBTC among elderly (Supplemental Table 20, Supplemental Figure 7A). Additionally, from 1990 to 2021, Cabo Verde exhibited the most significant increase, while Sri Lanka showed the most pronounced decline (Supplemental Table 20, Supplemental Figure 7B).
During 1990-2021, the global ASDR burden for GBTC among elderly remained concentrated in higher SDI countries/territories. Over this period, the SII for GBTC ASDR indicated an improvement in inequality, with values reducing from 266.732 (95% CI: 203.013, 330.450) to 101.156 (95% CI: 63.689, 138.622) (Table 1, Figure 4B). Similarly, the concentration index for GBTC ASDR also declined, from 0.187 (95% CI: 0.129, 0.246) to 0.033 (95% CI: −0.014, 0.081) (Figure 4B). As shown by the SII and concentration index, North Africa and Middle East exhibited a downward trend in health disparities in countries/territories with higher SDI at GBD super regional level (Figure 4B, Supplemental Table 21, and Supplemental Figures 2, 3). Additionally, South Asia demonstrated a reduction in health inequities, yet this improvement was notably within the lower SDI countries/territories. In 2021, Latin America and Caribbean exhibited the highest negative SII at −50.839, while Central Europe, Eastern Europe, and Central Asia recorded the highest positive SII at 158.783 (Figure 4B, Supplemental Table 19). In terms of concentration index, Sub-Saharan Africa reported the maximum negative value at −0.032, while High-income showed the highest positive concentration index of 0.185 (Figure 4B).
Pancreatic Cancer
Within the GBD super regions, High-income presented the highest ASDR at 1127.95 (95% CI: 1021.22-1196.38) per 100 000 population, conversely, South Asia had the lowest ASDR at 181.92 (95% CI: 160.48-203.66) per 100 000 population (Supplemental Table 22, Figure 2A). In addition, ASDR for PC among elderly experienced an upward trend in all GBD super regions from 1990 to 2021, with the most significant increase recorded in North Africa and Middle East (EAPC = 1.72, 95% CI: 1.56 to 1.88) (Figure 2B). The three top ASDR rankings in 2021 were Greenland, Uruguay, and Monaco (Supplemental Table 23, Supplemental Figure 8A). Moreover, the temporal trend analysis of ASDR from 1990 to 2021 demonstrated the most considerable upward trend in Turkmenistan, and the most significant downward trend in Burundi (Supplemental Table 23, Supplemental Figure 8B).
Over the three decades from 1990 to 2021, the global ASDR burden of PC among elderly was primarily concentrated in higher SDI countries/territories. The SII of PC ASDR showed improvements in health inequalities in higher SDI countries/territories, with a decline from 979.504 (95% CI: 875.250, 1083.757) to 873.383 (95% CI: 777.845, 968.920) (Table 1, Figure 4C). The concentration index also reflected this trend, decreasing from 0.293 (95% CI: 0.275, 0.312) to 0.268 (95% CI: 0.250, 0.287) (Figure 4C). Among GBD super regions, Latin America and Caribbean exhibited a positive trend in health inequalities in higher SDI countries, which is clearly indicated by both the SII and concentration index (Figure 4C, Supplemental Table 24, and Supplemental Figures 2, 3). In contrast, Sub-Saharan Africa and Southeast Asia, East Asia, and Oceania exhibited a deterioration in health inequality among countries/territories with higher SDI. By 2021, Central Europe, Eastern Europe, and Central Asia recorded the maximum positive SII with a value of 555.073, and the lowest in South Asia at 22.903 (Figure 4C, Supplemental Table 22). Sub-Saharan Africa reported the highest positive concentration index at 0.181, whereas South Asia showed the lowest at 0.020 (Figure 4C, Supplemental Table 22).
Discussion
Our secondary analysis of the GBD 2021 data offered most up-to-date insights into the global, GBD super regional, and national trends of ASDR for six GI cancers among elderly from 1990 to 2021. As far as we know, this research is the first to quantify the health inequalities and their changing patterns in the burden of ASDR for GI cancers among elderly over the past three decades. Key findings could be summarized in the following 3 points: firstly, a global decline in ASDR for EC, SC, CRC, LC, and GBTC in older adults over the past 32 years, while PC exhibited an increasing trend. Secondly, across GBD super regions, CRC among elderly recorded the highest ASDR in High-income, Central Europe, Eastern Europe, and Central Asia regions. Meanwhile, SC exhibited the highest ASDR in Latin America and the Caribbean, North Africa and the Middle East, South Asia, Southeast Asia, East Asia, and Oceania. Esophageal cancer had the highest ASDR in Sub-Saharan Africa. In Sub-Saharan Africa, EC topped the ASDR. Thirdly, the SII and concentration index both demonstrated notable disparities in health inequality patterns across GI cancers, GBD super regions, and time periods. Globally, the health inequality patterns of EC, SC, and LC in the elderly have undergone complex shifts between 1990 and 2021, as indicated by SII and concentration index. CRC, GBTC, and PC demonstrated a persistent heavier burden of ASDR in higher SDI countries/territories.
Our findings aligned with previous studies documenting the declining trends in ASDR for several GI cancers due to improved early detection, enhanced treatment modalities, and declining prevalence of key risk factors globally. 32 For instance, Pojsakorn Danpanichkul and his coworkers reported that the global age-standardized mortality rates (ASMRs) for CRC (APC = −0.80), EC (APC = −1.49), GBTC (APC = −0.87), LC (APC = −0.71) and SC (APC = −2.29) declined between 2000 and 2021, while the ASMR for PC (APC = 0.18) showed an upward trend. 33 Furthermore, the International Agency for Research on Cancer (IARC) GLOBOCAN statistics showed that CRC recorded the highest ASMR in 55.3 per 100 000 population among older adults (60+) across six common GI cancers in 2022. 1 This high disease burden of ASDR for CRC was particularly notable in High-income, Central and Eastern Europe and Central Asia, aligning with the disease’s recognized association with higher-income populations due to westernized diets, obesity, and sedentary lifestyles. In contrast, the low ASDR of GBTC might relate to its lower incidence and the relative lack of strong environmental and genetic risk factors in most populations. 34 Additionally, the high ASDR for SC in East Asia and other regions reflects the well-documented prevalence of Helicobacter pylori infection, high dietary salt consumption, and other cultural and dietary factors in these regions. 35 The burden of EC in Sub-Saharan Africa corroborates prior research highlighting the influence of locally specific exposures, such as traditional alcohol use, hot beverage consumption, and poor oral health.36,37 Fortunately, the global burden for EC and SC showed a downward trend over the study period, especially in high-income countries. This might be attributed to dietary modifications, and eradication of Helicobacter pylori, as well as advancements in cancer screening, early diagnosis, and treatment.38-40 Similarly, decline in ASDR for LC in older adults could been linked to widespread hepatitis B virus (HBV) vaccination campaigns and advancements in antiviral therapies for HBV and hepatitis C virus (HCV).41,42 Similar to Ebrahimi et al's findings on the increasing mortality rate of PC, our analysis revealed an increase in disease burden for PC, highlighting the persistent barriers to early diagnosis and the limited progress in treatment strategies. 35 The rise may also correlate with an aging population, increasing prevalence of diabetes, obesity, family history and genetic factors.43-45 To address the challenges posed by PC, research should prioritize early detection strategies, including biomarker discovery and imaging advancements. 46 The development of targeted therapies and immunotherapy for PC could offer new avenues for improving survival.47,48 After all, significant disparities across geographic regions were observed among all GI cancers from 1990 to 2021, likely influenced by differences in healthcare access, socioeconomic development, and the prevalence of risk factors such as tobacco use, alcohol consumption, and infectious agents. Currently, the integration of machine learning and artificial intelligence in cancer modeling presents an opportunity to improve cancer prediction and risk stratification.49,50 In addition, global health initiatives should emphasize reducing modifiable risk factors, such as smoking cessation programs, alcohol control policies, and obesity prevention strategies, especially in high-burden settings.
What is the definition of health equity? According to WHO, it means the absence of unjust and avoidable health disparities among population groups distinguished by social, economic, demographic, or geographic factors. 51 Striving for health equity means ensuring optimal health for everyone, while paying particular attention to the needs of those most vulnerable to health disparities due to social factors. 52 On the other hand, the American Society of Clinical Oncology (ASCO) defined health equity as the equitable chance for everyone to attain their best health, an ethical and human rights principle that motivate the reduction of health disparities. 53
In our study, the results revealed distinct and evolving patterns of health inequality across GI cancers, GBD super-regions, and time periods between 1990 and 2021. For EC, SC, and LC, intricate shifts in patterns of health inequalities were observed. These patterns likely reflected the interplay of changes in socioeconomic development, health system capacity, and modifiable risk factors. In low-income countries, lifestyle factors associated with esophageal cancer, such as betel nut chewing, high-salt preserved foods, hot foods, smoking, alcohol use, and malnutrition (vitamin and trace element deficiencies) are still prevalent. Additionally, the limited availability of cancer screening and early diagnostic tools in low-income countries poses a significant barrier to timely detection. As a result, most patients are diagnosed following the onset of symptomatic disease, leading to delayed surgical management and poorer clinical outcomes. Furthermore, the lack of advanced therapeutic options, such as precision radiotherapy, targeted therapy, and immunotherapy, significantly reduces cancer survival rates. This, in turn, increases the burden of DALYs. For CRC and PC, countries with higher SDI consistently exhibited a higher ASDR burden from 1990 to 2021. This pattern might be explained by the complex interplay of lifestyle factors, genetic variations, and inequities in healthcare access. For instance, high-income regions typically have a higher proportion of elderly individuals, which directly increases cancer incidence among this population and, consequently, ASDR. Additionally, significant risk factors for CRC and PC, including unhealthy dietary habits (eg, high-fat and high-red meat intake, low-fiber diets), sedentary lifestyles, and conditions such as overweight and obesity, are more prevalent in these regions. Genetic factors also play a crucial role in the development and progression of cancer. Variations in the genetic background of populations across regions may influence the incidence and burden of specific cancers. Pancreatic cancer, for example, is closely associated with a high familial risk, particularly due to mutations in genes such as BRCA2, CDKN2A, PALB2, and TP53, which are more prevalent in European and North American populations. Hereditary colorectal cancers, such as Lynch syndrome and familial adenomatous polyposis (FAP), also exhibit higher prevalence rates in Western populations. Furthermore, individual biological characteristics might influence GI cancer risk, progression, and treatment outcomes. In high-income countries, the larger elderly population frequently suffers from comorbidities such as hypertension and diabetes, which reduce tolerance to surgery, chemotherapy, or targeted therapies. In contrast, elderly individuals in low-income nations commonly face persistent malnutrition (deficiencies in vitamins A, C, E, zinc, and selenium) and infectious diseases, both contributing to weakened immune function. Finally, disparities in data quality and health management are noteworthy. High-income regions generally have more detailed records of diseases in the elderly, with comprehensive statistics on cancer cases and related disabilities. In contrast, low-income regions may suffer from underdiagnosis and data omission, especially among older adults. This, coupled with a potential bias in healthcare resource allocation towards younger individuals, can result in an underestimation of the cancer burden. To address the complex inequities in the burden of GI cancers among elderly, a multi-layered, region-specific strategy is essential. This approach should account for regional variations in economic conditions, lifestyle factors, sociodemographic characteristics, and healthcare systems to effectively address challenges in both high- and low-income regions. Drawing from de Souza et al, 54 healthcare infrastructure in low- and middle-income countries (LMICs) could be enhanced to reduce cancer burdens. For example, expanding access to affordable healthcare through Universal Health Coverage (UHC) to reduce out-of-pocket expenses. Increasing investment in Helicobacter pylori clearance and hepatitis B vaccination, as well as early screening programs for GI cancers in older populations. Furthermore, establishing cancer registries to improve data quality and inform targeted interventions. Moreover, many LMICs face severe shortages of oncologists and diagnostic tools, delaying care for patients. Training healthcare providers in oncology and expanding diagnostic and treatment facilities, such as pathology laboratories and radiotherapy units, are critical to improving cancer health inequities.
A noteworthy observation is that, despite advanced healthcare infrastructure and enhanced screening opportunities in high SDI regions, significant intraregional inequalities persisted. High-income countries, exemplified by the United States, experience cancer health disparities due to a range of factors, including socioeconomic status, access to healthcare services, individual behaviors, environments, exposure to carcinogens, and treatment availability. 54 The rising costs of increasingly expensive cancer drugs have universal implications, often imposing a heavy financial burden on older patients with GI cancers. From Alcaraz et al, addressing Social Determinants of Health (SDOH) is vital for reducing disparities, particularly in higher SDI countries. 55 For example, policies targeting income and wealth disparities can effectively reduce income inequality and promote equitable access to health insurance and healthcare services for minority and vulnerable populations. Telemedicine can further improve access for rural and marginalized communities by providing online cancer consultations. Furthermore, expanding the adoption of precision medicine and individualized treatments, supported by genetic testing (eg, Lynch syndrome and BRCA2 mutation screening), can enhance early detection rates among high-risk populations. Enhancing access to nutritious food and quality education, which are also critical to reducing cancer risk. Previously, the ASCO has advocated for learning systems that can promote patient engagement, better care coordination, and evidence-based oncology practices. 54 Such systems emphasize quality measurement and performance improvement across the continuum of care, thereby prioritizing resource allocation in an evidence-based manner. These approaches align with the broader goal of reducing inequalities through targeted, data-driven interventions.
This study systematically quantified the inequalities in GI cancers among the elderly population, leveraging global data and robust statistical indices to capture the complexity of trends. By applying SII and concentration index metrics, it elucidates health disparities in both absolute and relative terms, offering actionable insights for policy-making. Moreover, the study highlights the contrasting inequality patterns across GI cancers, providing a valuable framework for targeted interventions. Despite its contributions, this study has several limitations that warrant discussion. Firstly, our findings are based on a secondary analysis of GBD data, and thus, the precision of our results heavily relies on the quality of the GBD data. In many low-income nations, limited medical resources may lead to underdiagnosis and underreporting, potentially causing an underestimation of the actual disease burden. Investments in robust cancer surveillance systems are essential to improve the accuracy and reliability of such estimates. Secondly, GI cancers include various pathological subtypes, such as squamous cell carcinoma and adenocarcinoma, each with distinct biological characteristics. However, the GBD database does not differentiate between pathological subtypes of GI cancers, which may obscure important trends in subgroups. Future studies should incorporate subtype-specific analyses to refine our understanding of these cancers. Thirdly, this study primarily focuses on SDI inequalities, excluding other potential drivers such as environmental exposures, healthcare infrastructure, and genetic predispositions. Including these factors in future analyses could yield a more comprehensive understanding of disparities for GI cancer among elderly across global and GBD super regional levels. Lastly, our utilization of national disease burden data restricts our capacity to analyze disparities within individual countries, notably in large nations with considerable regional diversities like China, India, and the United States. Additionally, the SII and concentration index are highly sensitive to the population sizes of these countries. All these factors could markedly affect the observed disparities and should be considered in future research to strengthen the validity of conclusions on SDI health differences. Despite these limitations, our study provided valuable insights into health inequities related to GI cancers in the elderly. Its findings have the potential to offer valuable guidance for developing more targeted public health policies and optimizing the allocation of healthcare resources.
Conclusions
In summary, the ASDR for GI cancers among elderly declined globally from 1990 to 2021, with PC being the only exception on an upward trend. During this period, the persistent and intricate cross-country health inequalities in the ASDR for GI cancers among the elderly were observed at global and GBD super regional levels. By identifying these inequities, this study underscores the urgent need for robust international cooperation and systemic, policy-driven solutions to ensure fair access to healthcare resources and achieve equitable cancer healthcare outcomes.
Supplemental Material
Supplemental Material - Persistent Health Inequalities in the Burden of Gastrointestinal Cancers Among the Elderly From 1990 to 2021: A Population-Based Study
Supplemental Material for Persistent Health Inequalities in the Burden of Gastrointestinal Cancers Among the Elderly From 1990 to 2021: A Population-Based Study by Zijian Qiu, Shengjian Yu, Ying Lou, Xiaofeng Ma, and Feng Xuan in Cancer Control
Footnotes
Acknowledgments
We express our gratitude for the remarkable work conducted by the Global Burden of Diseases, Injuries, and Risk Factors Study (GBD) 2021 collaborators.
Statements and Declarations
Author Contributions
Conceptualization: Zijian Qiu, Feng Xuan.
Investigation: Zijian Qiu, Xiaofeng Ma.
Methodology: Zijian Qiu, Shengjian Yu, Ying Lou, Feng Xuan.
Data curation: Zijian Qiu, Feng Xuan.
Software: Zijian Qiu, Xiaofeng Ma.
Visualization: Zijian Qiu, Shengjian Yu, Ying Lou.
Project administration: Feng Xuan.
Supervision: Feng Xuan.
Writing - original draft: Zijian Qiu, Shengjian Yu, Ying Lou, Xiaofeng Ma.
Writing - review and editing: Feng Xuan.
All the authors have read and approved the manuscript.
Funding
The authors received no financial support for the research, authorship, and/or publication of this article.
Conflicting Interests
The authors declared no potential conflicts of interest with respect to the research, authorship, and/or publication of this article.
Supplemental Material
Supplemental material for this article is available online.
Appendix
References
Supplementary Material
Please find the following supplemental material available below.
For Open Access articles published under a Creative Commons License, all supplemental material carries the same license as the article it is associated with.
For non-Open Access articles published, all supplemental material carries a non-exclusive license, and permission requests for re-use of supplemental material or any part of supplemental material shall be sent directly to the copyright owner as specified in the copyright notice associated with the article.