
Abstract
Background
Anaphase-promoting complex subunit 1 (ANAPC1) is a regulator of cellular mitosis and an important factor in tumorigenesis. To date, a comprehensive assessment of the potential role, biological behaviours, and clinical significance of ANAPC1 in colorectal cancer (CRC) is still lacking.
Materials and methods
This study integrated 2329 mRNA expression data, single-cell RNA sequencing (scRNA-seq), and internal immunohistochemistry of 416 tissue samples to comprehensively evaluate the abnormal expression pattern of ANAPC1 in CRC. It also incorporated evidence from immune infiltration analysis, functional enrichment analysis, and weighted gene co-expression network analysis to explore the biological behaviour of ANAPC1 in CRC. In addition, in vitro cell biology experiments such as real-time polymerase chain reaction (RT-PCR), western blot (WB), cholecystokinin 8 (CCK-8), wound healing, cell cycle, and apoptosis assays were conducted to verify the potential effect of ANAPC1 on CRC cells.
Results
ANAPC1 mRNA was significantly overexpressed in CRC tissue (SMD = 2.07, 95% CI 1.59-2.55, P < .05) and malignant epithelial cells (P < .05). Validation at the protein level similarly confirmed the overexpression of ANAPC1 in CRC tissue (P < .05). ANAPC1 in CRC may play a role in abnormal ribosome biogenesis, DNA replication, ATP-dependent activity acting on DNA, nuclear division, chromosome segregation, and other pathways. In vitro experiments demonstrated that HCT-116 cells with ANAPC1 knockdown had reduced proliferation and migration abilities, increased cell apoptosis rate, and altered cell cycle distribution. In addition, CRC patients with low ANAPC1 expression were more likely to benefit from treatment with immune checkpoint inhibitors. ANAPC1 was significantly downregulated in malignant epithelial cells of CRC treated with PD-1 inhibitors (P < .05).
Conclusion
ANAPC1 may have a positive impact on the development of CRC by being involved in pathways related to DNA replication, chromosome segregation, and ribosomes.
Background
Continuous advances in prevention, diagnosis, and treatment in the field of colorectal cancer (CRC) have allowed some early-diagnosed CRCs to be completely cured through a variety of treatment regimens. 1 However, CRC remains an important global public health problem. 2 Colorectal cancer is not only more prevalent in developed countries but also in developing countries, where it was originally less prevalent, as its incidence has been on the rise in recent years. 3 Recent data indicate that more than 1.88 million new cases of CRC and more than 910 000 deaths of CRC patients occur globally each year. 4 Around 20% of CRC patients have metastases at the time of their initial visit, and another 25% of CRC patients will soon develop metastases as the disease progresses. 5 Once CRC has metastasized, it is difficult to cure with current medical technology, and more than 80% of patients will die within 5 years.1,5,6 The poor condition of CRC is closely linked to several aspects. One, the biological behaviours of CRC remain poorly understood. Two, the absence of distinct and specific early symptoms hinders early diagnosis. 7 Three, there is a dearth of effective treatment options. 8 Therefore, it is important to identify new markers of CRC, explore their biological behaviours, and evaluate their clinical value.
Anaphase-promoting complex subunit 1 (ANAPC1) is a regulator of cellular mitosis and an important factor in tumorigenesis. 9 Many studies have shown that ANAPC1 exhibits abnormal biological behaviours in a wide range of oncological and non-oncological diseases, such as melanoma, T-cell acute lymphoblastic leukaemia, T-cell lymphoma, corneal diseases, Rothmund–Thomson syndrome, osteoporosis, and many others.9-13 Unfortunately, there are few reports on the specific role of ANAPC1 in CRC. The interaction of ANAPC1 with some non-coding RNAs can affect CRC cell proliferation. 14 Studies based on animal models have also found differences in ANAPC1 expression levels between inflammatory bowel disease and CRC. 15 However, these limited studies had several drawbacks. First, they could not analyse many human samples, so the reliability of their results was poor. Second, they did not offer insights into the underlying biological mechanisms. Third, they did not explore the clinical value of ANAPC1.
To explore the abnormal expression pattern, molecular mechanism, and clinical significance of ANAPC1 in CRC, we collected 2329 bulk RNA-Seq data, single-cell RNA sequencing (scRNA-seq), and in-house immunohistochemical scores from 416 tissue samples. In addition, we collected drug sensitivity data and conducted various in vitro cell biology experiments for a comprehensive analysis. The main arguments and analytical procedures of this study are outlined in Figure 1. We hope that the results of this research will help fill the gaps in the body of knowledge on CRC and provide new insights into the prevention, diagnosis, and treatment of this disease. Flow Chart of the Main Analysis Process of This Study.
Materials and Methods
Collection and Collation of CRC Bulk RNA-Seq Data and Assessment of ANAPC1 mRNA Expression in CRC
This study referred to the REMARK guidelines. 16 For this study, we collected available bulk RNA-Seq data from CRC tissue and corresponding clinical information from the Cancer Genome Atlas (TCGA), the Gene Expression Omnibus (GEO), the Sequence Read Archive (SRA), ArrayExpress, and other databases. The detailed process followed to search and select datasets is described in Figure S1; we ultimately included 26 datasets from 18 platforms. We then merged, de-batched, normalised, corrected, and removed abnormal data samples from these datasets based on platform information. We Q-tested and I 2 statistically analysed to select the computational model to be used for calculating the standardised mean difference (SMD) of ANAPC1. If I 2 > 50%, there is significant heterogeneity, and a random effects model was selected to calculate SMD. I 2 < 50%, a fixed effects model was selected. These data were later integrated, and the SMD of ANAPC1 was calculated to assess the expression status of ANAPC1 mRNA in CRC.
Comprehensive Assessment of ANAPC1 Expression Patterns at the Single-Cell Level in CRC Tissue
The dataset for scRNA-seq in this study was obtained from the GEO database, specifically GSE205506, which included normal samples, CRC samples, and CRC samples treated with PD-1. The data from these samples were successively processed using line integration, the removal of low-quality cells, the exclusion of interfering factors, normalisation, and the removal of batch effects. The 20 principal components with the largest standard deviations were then subjected to UMAP and TSNE downscaling. We used the SingleR package to identify cell types for each cluster. We assessed the degree of malignancy of epithelial cells using the inferCNV package with immune stromal cells from CRC tissue serving as a reference. Finally, we compared the expression of ANAPC1 between normal epithelial cells and malignant CRC epithelial cells to further validate the abnormal expression pattern of ANAPC1.
Internal Tissue Microarray and Immunohistochemical Validation Assessment of CRC
In this study, tumour tissue and paracancerous tissue from 208 CRC patients, along with their clinicopathological information, were collected at Yulin Red Cross Hospital. These clinical samples were used to construct 12 tissue microarrays. The ANAPC1 protein antibody (rabbit polyclonal antibody [AB_2790792]) was purchased from Thermo Fisher Scientific. All technical operations related to tissue microarrays and immunohistochemistry were carried out strictly according to the manufacturer’s guidelines. Immunohistochemical scoring was independently performed by two experienced pathologists. The number of positive cells was randomly counted out of 100 cells per field of view at the highest magnification possible using the available assessment tools. If the number of positive cells fell within the ranges of 0-5, 6-15, 16-50, 51-75, or greater than 75, the positive cell score for that field of view was assigned a score of 0, 1, 2, 3, or 4, respectively. Staining intensity scores ranged from 0 to 3, representing no staining, weak staining, moderate staining, and strong staining. Ten fields of view were randomly selected from each tissue sample for analysis. The final immunohistochemical score for each sample was calculated as the average of the positive cell score multiplied by the staining intensity score. All patients or their families signed informed consent forms. In addition, we explored the clinicopathological significance of ANAPC1 using the immunohistochemical score in conjunction with clinicopathological information.
Growth Necessity Analysis of ANPAC1 in CRC
We further assessed the effect of ANAPC1 on the growth of CRC cells based on the DepMap database using the chronos score. 17 A chronos score of less than −1 indicates that the growth of this cell line is strongly dependent on this gene. 18
CRC Tissue Immune Microenvironment Analysis
We conducted ssGSEA analysis on 650 CRC samples from TCGA to assess the immune cell enrichment status and immune function within the CRC tissue microenvironment. Following this, we divided these samples into ANAPC1 high-expression and low-expression groups based on the median ANAPC1 expression level to compare the differences in immune cell enrichment and immune function status between the two groups. We then analysed the correlation between ANAPC1 expression levels, immune cell enrichment, and immune function status to further confirm the role of ANAPC1. In addition, we assessed the relationship between the immune microenvironment state of CRC tissue and clinical prognosis.
Biological Functional Assessment of ANAPC1 Abnormalities in CRC
First, we batch-calculated the SMD of individual gene expression in 48 CRC mRNA datasets to identify differentially expressed genes (DEGs) in CRC (P < .05). Next, we analysed CRC data from TCGA using cBioPortal to identify co-expressed genes for ANAPC1 (Spearman’s correlation > 0.3; P < .05). The intersection of DEGs with ANAPC1-co-expressed genes gave us intersecting genes. Subsequently, we conducted Gene Ontology (GO) enrichment and Kyoto Encyclopedia of Genes and Genomes (KEGG) analyses on these intersected genes to assess the potential biological functions of abnormal ANAPC1 in CRC.
Assessment of Abnormal Biological Behaviour of ANAPC1 in Malignant Epithelial Cells in CRC
To further validate the abnormal function of ANAPC1 in CRC at the cellular level, we used the hdWGCNA package to identify co-expressed gene modules in malignant epithelial cells of CRC tissue. We used the TestSoftPowers function to determine the threshold β for generating more appropriate topological networks. Subsequently, we used GO enrichment analysis to functionally annotate the hub genes of the identified co-expressed gene modules to analyse their abnormal functions. Next, we used the AddModuleScore function of the Seurat package to group cells based on the median of the hub gene scores of the co-expressed gene modules. We then compared ANAPC1 expression in malignant epithelial cells between high- and low-scoring groups to evaluate its potential role.
In Vitro Cell Biology Experiments of ANAPC1
Cell Culture
Caco-2 cells, HT-29 cells, HCT-116 cells, HCT-8 cells, and COLO 205 cells were purchased from Meisen Chinese Tissue Culture Collections. The culture conditions for these CRC cells are as follows: Caco-2 cells: 89% MEM medium + 10% FBS + 1% penicillin/streptomycin (P/S); HT-29 cells: 89% McCoy’s 5A medium + 10% FBS + 1% P/S; HCT116 cells: 89% McCoy’s 5A medium + 10% FBS + 1% P/S; HCT-8 cells: 89% RPMI 1640 medium + 10% FBS + 1% P/S; COLO 205 cells: 89% RPMI 1640 medium + 10% FBS + 1% P/S.
Detection of ANAPC1 Expression
Real-time polymerase chain reaction (RT-PCR) and western blot (WB) were used to detect the ANAPC1 expression levels in these CRC cells. The primers for RT-PCR were designed and synthesised by Sangon Biotech (Shanghai). The housekeeping gene GAPDH served as an internal reference. The primer sequences are presented in Table S1. RNA extraction, RNA reverse transcription, and RT-PCR experiments were conducted according to the manufacturer’s instructions. The cycle threshold (CT) value of each sample was recorded, and mRNA expression was determined using the 2−△△CT method. The main materials used for WB included mouse monoclonal GAPDH (Cat. No.: 60004-1-Ig, Proteintech, Wuhan, China), ANAPC1 (Cat. No.: 21748-1-AP, Proteintech, Wuhan, China), HRP-labelled goat anti-mouse secondary antibody (Cat. No.: ZB2305, ZSGB-BIO, Beijing, China), and HRP-labelled goat anti-rabbit secondary antibody (Cat. No.: ZB2301, ZSGB-BIO, Beijing, China). Protein extraction and WB analysis were carried out according to the manufacturer’s instructions.
Cell Transfection
ANAPC1 small interfering RNA (siRNA) lentiviruses were purchased from GENCEFE Biotech. Following the manufacturer’s instructions, three ANAPC1 siRNA lentiviruses (siRNA-426, siRNA-2709, and siRNA-4501) and the control vector were transfected into CRC cells. RT-PCR was used to evaluate the transfection efficiency.
Cell Viability Assay
The Cell Counting Kit - 8 (CCK-8; Cat. No.: M006, Meisen Chinese Tissue Culture Collections, Jinhua, China) was used to measure the viability of CRC cells; 5 × 10³ transfected cells were seeded in a 96-well culture plate. The cell culture was terminated, and 20 μL of CCK-8 solution was added to each well every 12 h for 72 h. Cell viability was evaluated by measuring the optical density (OD) at 450 nm in each well.
Determination of Cell Migration Ability
The transfected cells were digested, counted, seeded, and cultured overnight until reaching 90% density, covering the bottom of a 3.5-cm dish. A vertical scrape was made with a pipette tip, and the scraped-off cells were washed away with PBS before being photographed. The cells were then cultured at 37°C and 5% CO2. After 72 h, the cell migration was observed and photographed. The migration ability was evaluated by measuring the change in area from the start and estimated using ImageJ software.
Detection of Cell Apoptosis and Cell Cycle
The Annexin V-FITC/PI kit (BestBio, Shanghai, China) and cell cycle detection kit (BestBio, Shanghai, China) were used to detect the apoptosis rate and cell cycle distribution of CRC cells. All experimental operations were carried out according to the manufacturer’s instructions.
Assessment of the Potential Impact of ANAPC1 on the Efficacy of Targeted Therapy and Immunotherapy in CRC
For targeted therapy, we used the oncoPredict package to identify targeted drugs that showed a strong correlation between ANAPC1 expression levels and drug sensitivity (Spearman’s Correlation > 0.3, P < .05). In terms of immunotherapy, we first analysed the correlation between ANAPC1 and the expression levels of common immune checkpoint molecules in CRC (P < .05) to assess the potential value of ANAPC1 in CRC immunotherapy. Second, we used immunophenotypic data from the TCIA database to predict the potential impact of ANAPC1 on the efficacy of immune checkpoint inhibitors in the treatment of CRC. We also compared the expression status of ANAPC1 in untreated CRC and PD-1-treated CRC tissue by screening the DEGs of malignant epithelial cells in both conditions. The potential biological functions of these DEGs in CRC immunotherapy were then analysed in detail. Subsequently, we used the Cellchat package to conduct cell communication analysis in single-cell landscapes of untreated CRC and PD-1-treated CRC tissue to compare the differences in cell communication signalling pathways between the two.
Statistical Analyses
All statistical analyses in this study were conducted using R version 4.2.2, STATA version 12 and GraphPad Prism version 8.0. A P value less than 0.05 was considered statistically significant.
Results
Comprehensive Assessment of ANAPC1 mRNA Expression Status in CRC Tissue
In this study, the mRNA expression profiles of 1597 CRC tissues and 732 non-CRC tissues from 26 datasets across 18 platforms were integrated to examine the expression status of ANAPC1 in CRC tissue. Analysing each expression matrix, the vast majority of expression matrices in CRC tissue showed significantly high expressed of ANAPC1 (P < .05) (Figure S2). In addition, the analysis of all integrated expression matrices indicated that ANAPC1 expression was significantly higher (SMD = 2.07, 95% CI 1.59-2.55, P < .05) in CRC tissue compared to non-CRC tissue (Figure 2A). Considering potential variations in the datasets due to time and space, the study recalculated the SMD by systematically excluding each expression matrix and found no significant change in the results (Figure 2B). The study also confirms the absence of publication bias through Begg’s test (P = .21 > .05) and Egger’s test (P = .27 > .05) (Figure 2C and D). These tests further support the integration of all 18 expression matrices into the analysis without significant impacting the results. Analysis of the Expression Status of ANAPC1 mRNA in Various Malignant Tumour Tissues (A) ANAPC1 mRNA was Significantly Highly Expressed in CRC Tissues; (B) the Standardised Mean Difference of ANAPC1 mRNA was Recalculated by Discarding the Included Expression Matrices One by One; (C and D) Begg’s Test and Egger’s Test Were Used to Perform Publication Bias Analysis of ANAPC1 mRNA in CRC Tissues.; (E) Summary Receiver Operating Characteristic (sROC) Curve for Identifying CRC Tissue Based on ANAPC1 mRNA Expression Level.
ANAPC1 mRNA Expression Analysis of Malignant Epithelial Cells From CRC Tissue
Seven major cell types were identified in CRC tissue (Figure 3A and B). Epithelial and endothelial cells in CRC tissue exhibited high levels of ANAPC1 mRNA compared to other immune stromal cells (Figure 3C). Epithelial cells in CRC tissue were highly malignant (Figure 3D). The malignant epithelial cells in CRC tissue exhibited significantly higher expression of ANAPC1 mRNA (P < .05) compared to the epithelial cells in non-CRC tissue (Figure 3E). ANAPC1 mRNA was Highly Expressed in Malignant Epithelial Cells of CRC Tissue (A) Identification of Cell Types in CRC Tissue Based on UMAP Dimensionality Reduction; (B) Identification of Cell Types in CRC Tissue Based on TSNE Dimensionality Reduction; (C) Analysis of the Expression Status of ANAPC1 mRNA in Various Types of Cells in CRC Tissue; (D) Analysis of the Malignant Degree of Epithelial Cells in CRC Tissue; (E) Analysis of mRNA Differential Expression Between Malignant Epithelial Cells in CRC Tissue and Epithelial Cells in non-CRC Tissue.
Validation of ANAPC1 Expression in CRC Tissue at the Protein Level
In this study, tumour tissue and paracancerous tissue from 208 CRC patients were also collected for immunohistochemistry to validate the overexpression status of ANAPC1 in CRC at the protein level. Qualitative analysis showed that the positive signal of ANAPC1 was significantly stronger in CRC tissue than in paraneoplastic tissue (Figure 4A and B). Paired difference analysis indicated that tumour tissue from 208 CRC patients had significantly higher ANAPC1 immunohistochemical scores than paraneoplastic tissue from the same patients (Figure 4C). This further confirms the overexpression of ANAPC1 in CRC. Verification of ANAPC1 Expression Status in CRC Tissue at the Protein Level (A) Expression Status of ANAPC1 Protein in CRC Tissue; (B) Expression Status of ANAPC1 Protein in Paracancerous Tissue; (C) Paired Difference Analysis of ANAPC1 Protein Expression Levels in CRC Tissue and Paracancerous Tissue; (D) Analysis of the Ability of ANAPC1 Protein Expression Levels to Identify CRC Tissue; (*: P < .05, **: P < .01; ***: P < .001.).
Assessment of the Potential Correlation Between ANAPC1 and the Immune Microenvironment of CRC Tissue
In the low-ANAPC1-expression group, most immune cells were significantly more enriched compared to the high-ANAPC1-expression group (P < .05) (Figure 5A). Compared with CRC tissue with high ANAPC1 expression, CRC tissue with low ANAPC1 expression showed significantly enhanced immune functions in aspects such as antigen-presenting cell (APC) co-inhibition, APC co-stimulation, MHC class I presentation, immune checkpoint, type I interferon response, and T-cell co-stimulation (P < .05) (Figure 5B). The analysis results indicate that there is a significant negative correlation between the ANAPC1 expression level and the enrichment degree of most immune cells in the immune microenvironment of CRC tissue (Figure 5C) as well as the relative intensity of immune functions (Figure 5D) (P < .05; cor < 0). These results strongly suggest that the immune microenvironment of CRC tissue with high ANAPC1 expression is in a relatively suppressed state, while that of CRC tissue with low ANAPC1 expression is in a relatively overactivated state. Analysis of the Immune Microenvironment of CRC Tissue and Assessment of the Potential Impact of ANAPC1 in it (A) Comparing the Degree of Immune Cell Infiltration Between CRC Tissue of the High Expression Group and the Low Expression Group Based on the Median Expression Level of ANAPC1 mRNA; (B) Compare the Difference in Immune Microenvironment Functional Strength Between CRC Tissue in the High Expression Group and the Low Expression Group Based on the Median Expression Level of ANAPC1 mRNA; (C) Analysis of the Correlation Between ANAPC1 mRNA Expression Level and the Degree of Immune Cell Infiltration in the Immune Microenvironment of CRC Tissue; (D) Analysis of the Correlation Between ANAPC1 mRNA Expression Level and the Immune Microenvironment Functional Strength in CRC Tissue. (*: P < .05, **: P < .01; ***: P < .001.).
Exploration of Potential Biological Mechanisms of ANAPC1 in CRC
We analysed 1093 intersecting genes for enrichment analysis to further evaluate the abnormal biological behaviour of ANAPC1 in CRC. Gene Ontology enrichment analysis indicated that abnormal ANAPC1 in CRC may be involved in DNA replication, nuclear division, chromosome segregation, ribosome biogenesis, ribonucleoprotein complex biogenesis, and other biological processes (Figure 6A); it may also be associated with the DNA repair complex, chromosomal region, mitotic spindle, and other cellular components (Figure 6B), and may exhibit molecular functions such as ATP-dependent activity acting on DNA, ATP-dependent chromatin remodeler activity, and DNA helicase activity (Figure 6C). In addition, KEGG enrichment analysis confirmed that ANAPC1 could contribute to CRC development by participating in pathways such as ATP-dependent chromatin remodelling, DNA replication, ribosome biogenesis in eukaryotes, and the cell cycle (Figure 6D). Analysis of Potential Biological Mechanisms of ANAPC1 in CRC Tissue (A) Biological Process Part of Gene Ontology (GO) Enrichment Analysis; (B) Cellular Component Part of GO Enrichment Analysis; (C) Molecular Function Part of GO Enrichment Analysis; (D) Kyoto Encyclopedia of Genes and Genomes (KEGG) Enrichment Analysis.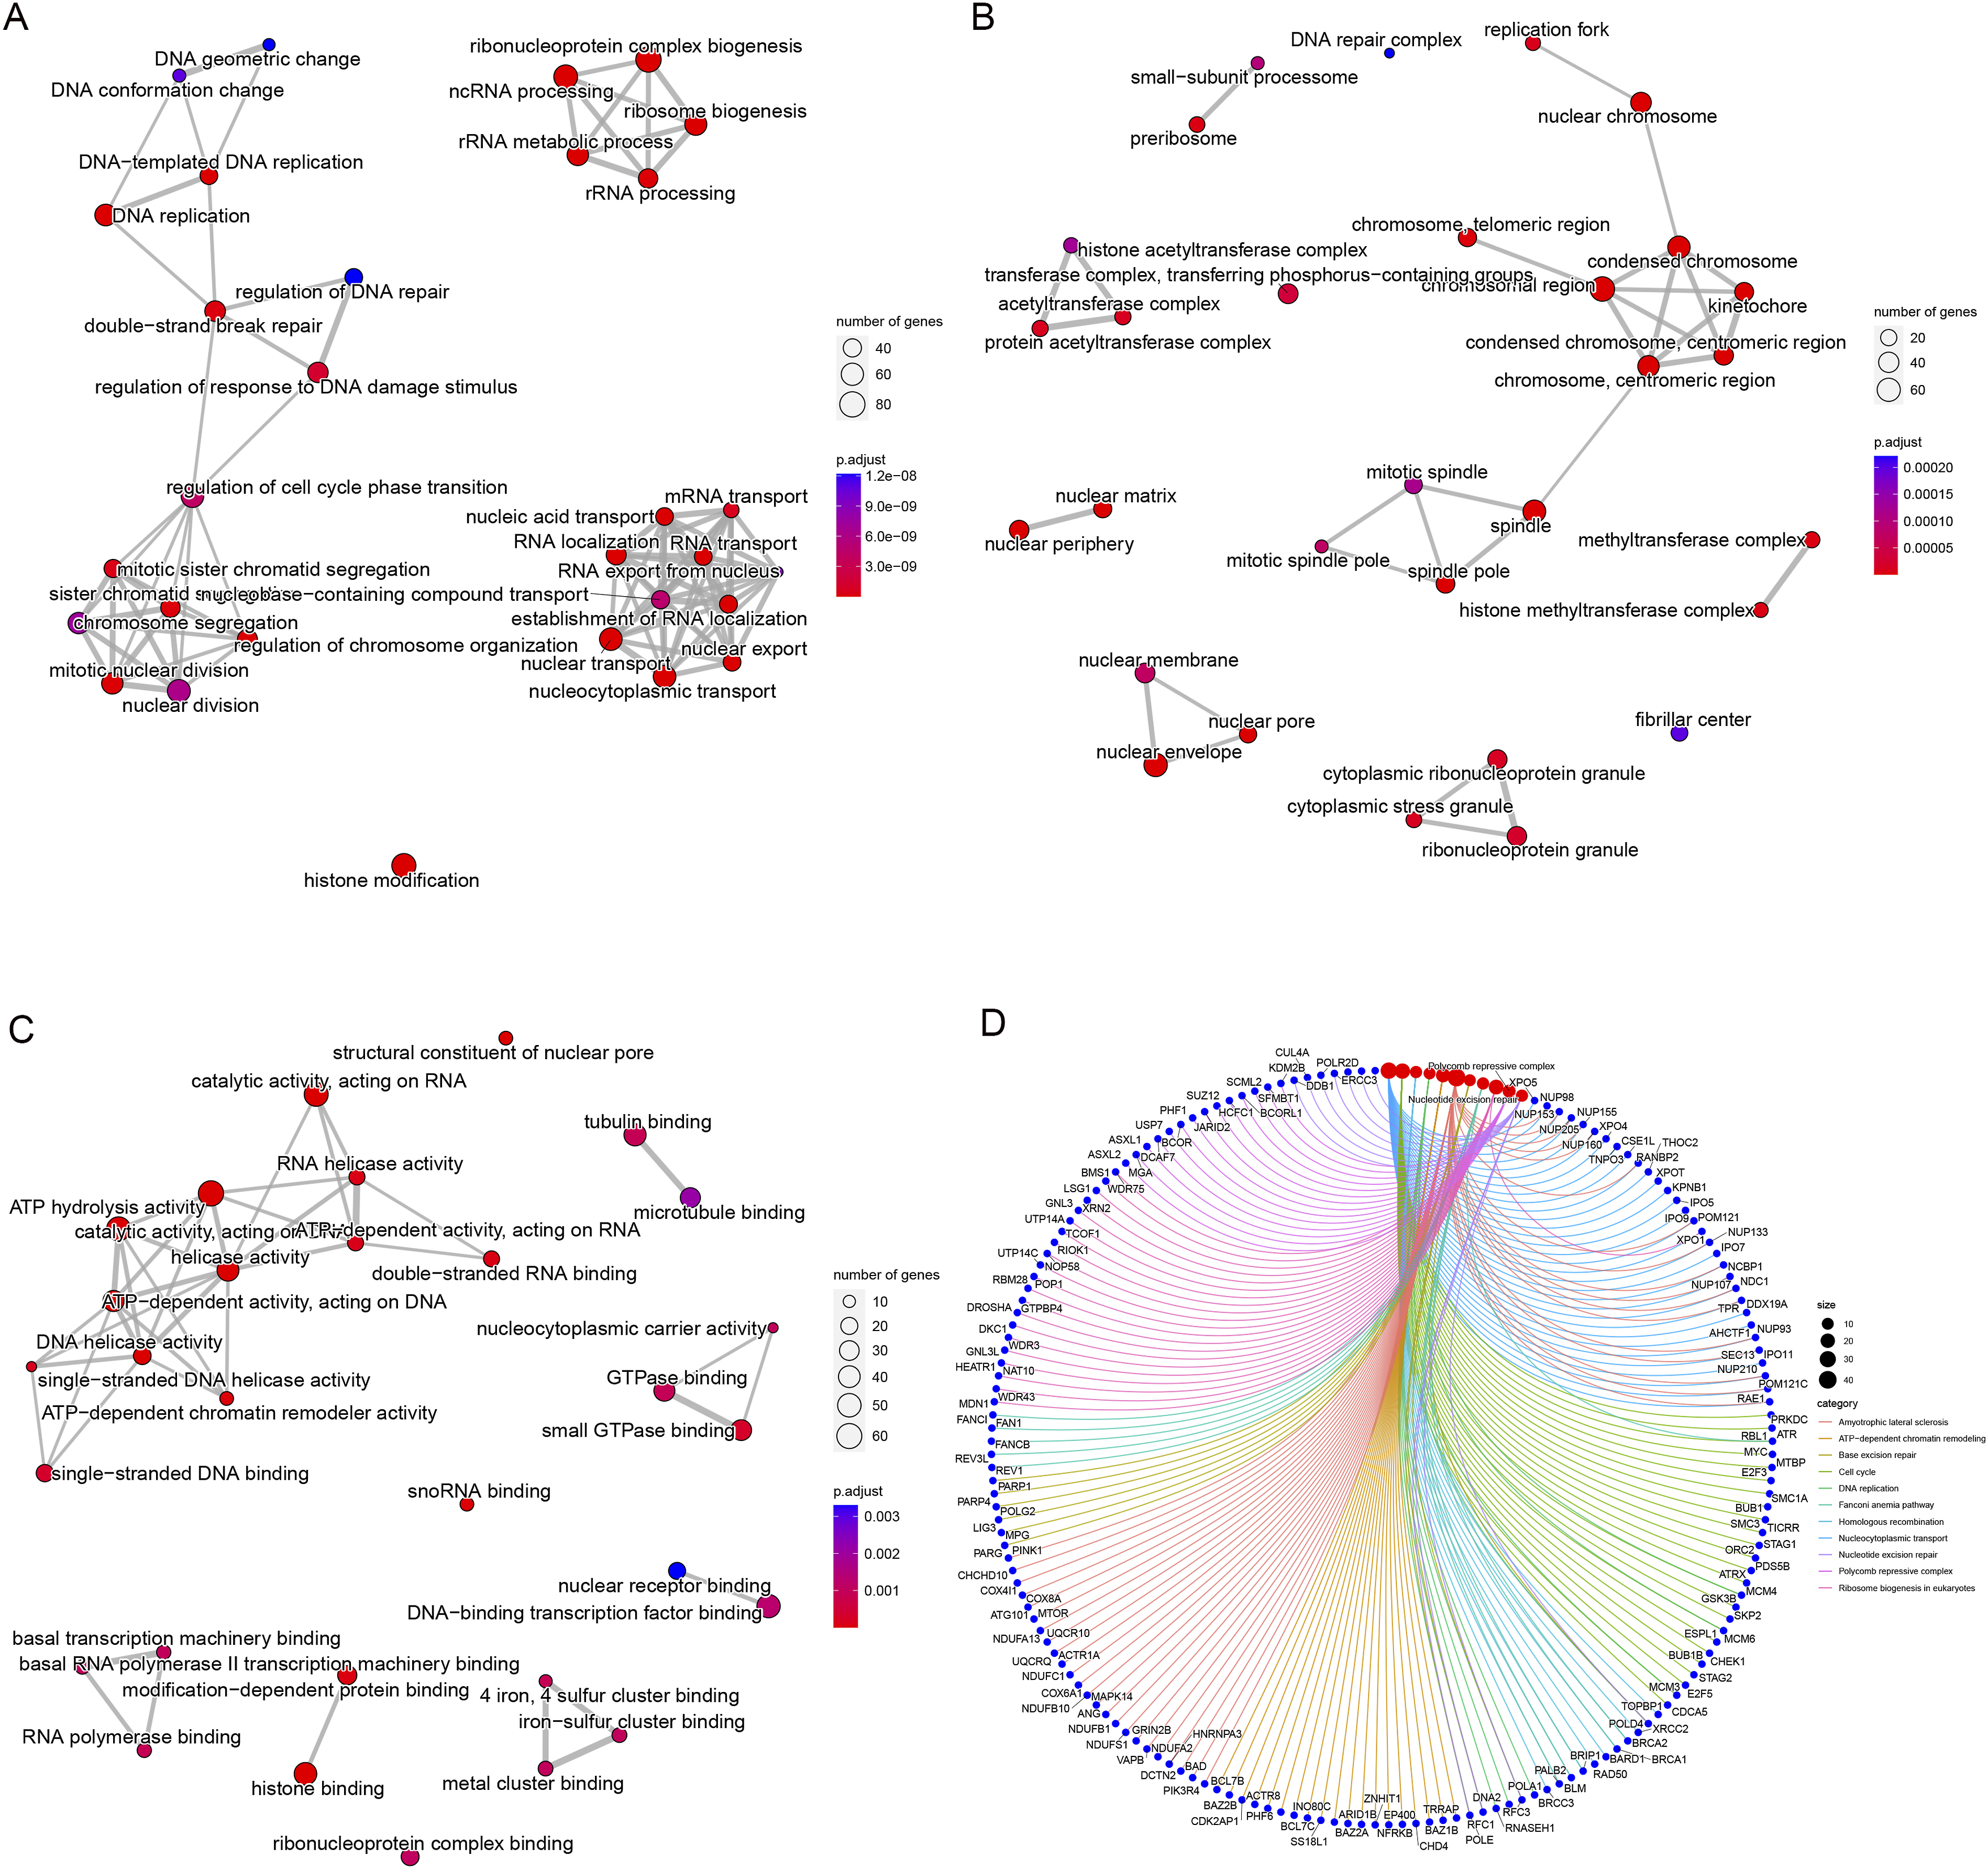
Functional Analysis at the Cellular Level in CRC Tissue and Exploration of the Potential Impact of ANAPC1 on CRC Tissue
This may be indicative of the regulatory role of ANAPC1 in the development of malignant epithelial cells. To further explore the potential role of ANAPC1 in the malignant epithelial cells of CRC tissue, we screened malignant epithelial cells for co-expressed gene modules using hdWGCNA. The threshold β for co-expression analysis was set at 9 (Figure 7A), and 15 co-expressed gene modules of malignant epithelial cells were identified (Figure 7B and C). We found that modules such as blue, cyan, greenyellow, pink, red, and others exhibited greater intensity in malignant epithelial cells (Figure 7C). The mode of action of these five modules of hub genes is detailed in Figure 7D. Interestingly, the biological functions of these five co-expressed gene modules include ribonucleoprotein complex biogenesis, ribosome biogenesis, RNA splicing, DNA replication, ATP-dependent activity acting on DNA, nuclear division, and chromosome segregation (Figure 7E). These biological functions align with the potential functions of abnormal ANAPC1 in CRC. In addition, there was a highly significant differential expression of ANAPC1 in malignant epithelial cells between the high-scoring and low-scoring groups of these three modules (Figure S3). This further emphasises the potential role of ANAPC1 in this process. These results suggest that ANAPC1 may be involved in the development of CRC through abnormal DNA replication, ribosome biogenesis, chromosome segregation, and other pathways in malignant epithelial cells. Weighted Correlation Network Analysis of the Single-Cell Landscape of CRC Tissue (A) Soft Power Threshold Selection for Single Cell Landscape Weighted Gene Co-Expression Analysis of CRC Tissue; (B) Subset of Malignant Epithelial Cells Were Selected for High-Dimensional Weighted Gene Co-Expression Analysis; (C) the Effect of Each Gene Co-Expression Module on Various Types of Cells in CRC Tissue; (D) Hub Gene Network Analysis of Malignant Epithelial Cell Gene Co-Expression Modules in CRC Tissue; (E) Analysis of Potential Biological Functions of Gene Co-Expression Modules With Strong Effects in Malignant Epithelial Cells.
Effects of ANAPC1 Knockdown on the Biological Effects of CRC Cells
Among the five CRC cell lines, HCT-116 cells exhibited the highest expression levels of both ANAPC1 mRNA and protein (Figures S4A–B). All three siRNAs could significantly knock down the expression of ANAPC1 in HCT-116 cells (P < .05) (Figure S4C). Among them, siRNA-426 demonstrated the best efficiency in knocking down ANAPC1 (Figure S4C). Therefore, all subsequent cell experiments were conducted using HCT-116 cells and siRNA-426. The scratch test results indicate that after ANAPC1 knockdown, the migration ability of HCT-116 cells is significantly reduced (P < .05) (Figure 8A). Compared with the negative control group (NC), the apoptosis rate of cells was significantly increased after ANAPC1 knockdown (P < .05) (Figure 8B). The results of cell cycle analysis by flow cytometry indicate that, compared with the NC group, after ANAPC1 knockdown, the proportion of cells in the G0/G1 and G2/M phases is significantly increased, while the proportion of cells in the S phase is significantly decreased (P < .05) (Figure 8C). In addition, Figure 9A illustrates that the chronos scores of 43 CRC cell lines were all less than −1. At the same time, Figure 9B illustrates that, compared with the negative control group, the viability of HCT-116 cells with ANAPC1 knockdown was significantly reduced (P < .05). These results collectively indicate that ANAPC1 plays an important role in maintaining the viability and proliferation ability of CRC cells. Effects of ANAPC1 Knockdown on Migration, Apoptosis, and Cell Cycle of CRC Cells (A) Wound Healing Assay was Used to Determine the Migration Ability of CRC Cells. (B) Flow Cytometry was Employed to Detect the Apoptosis of CRC Cells. (C) Impact of ANAPC1 Knockdown on the Cell Cycle Distribution of CRC Cells. (NC, Negative Control; *P < .05,**P < .01,***P < .001,****P < .0001). Potential Effects of ANAPC1 on CRC Cell Proliferation and Cell Viability (A) the Growth of CRC Cells was Suppressed Upon ANAPC1 Knockout Using the CRISPR System; (B) the Proliferation Ability of CRC Cells was Detected by CCK-8. (NC, Negative Control; *P < .05,**P < .01,***P < .001,****P < .0001).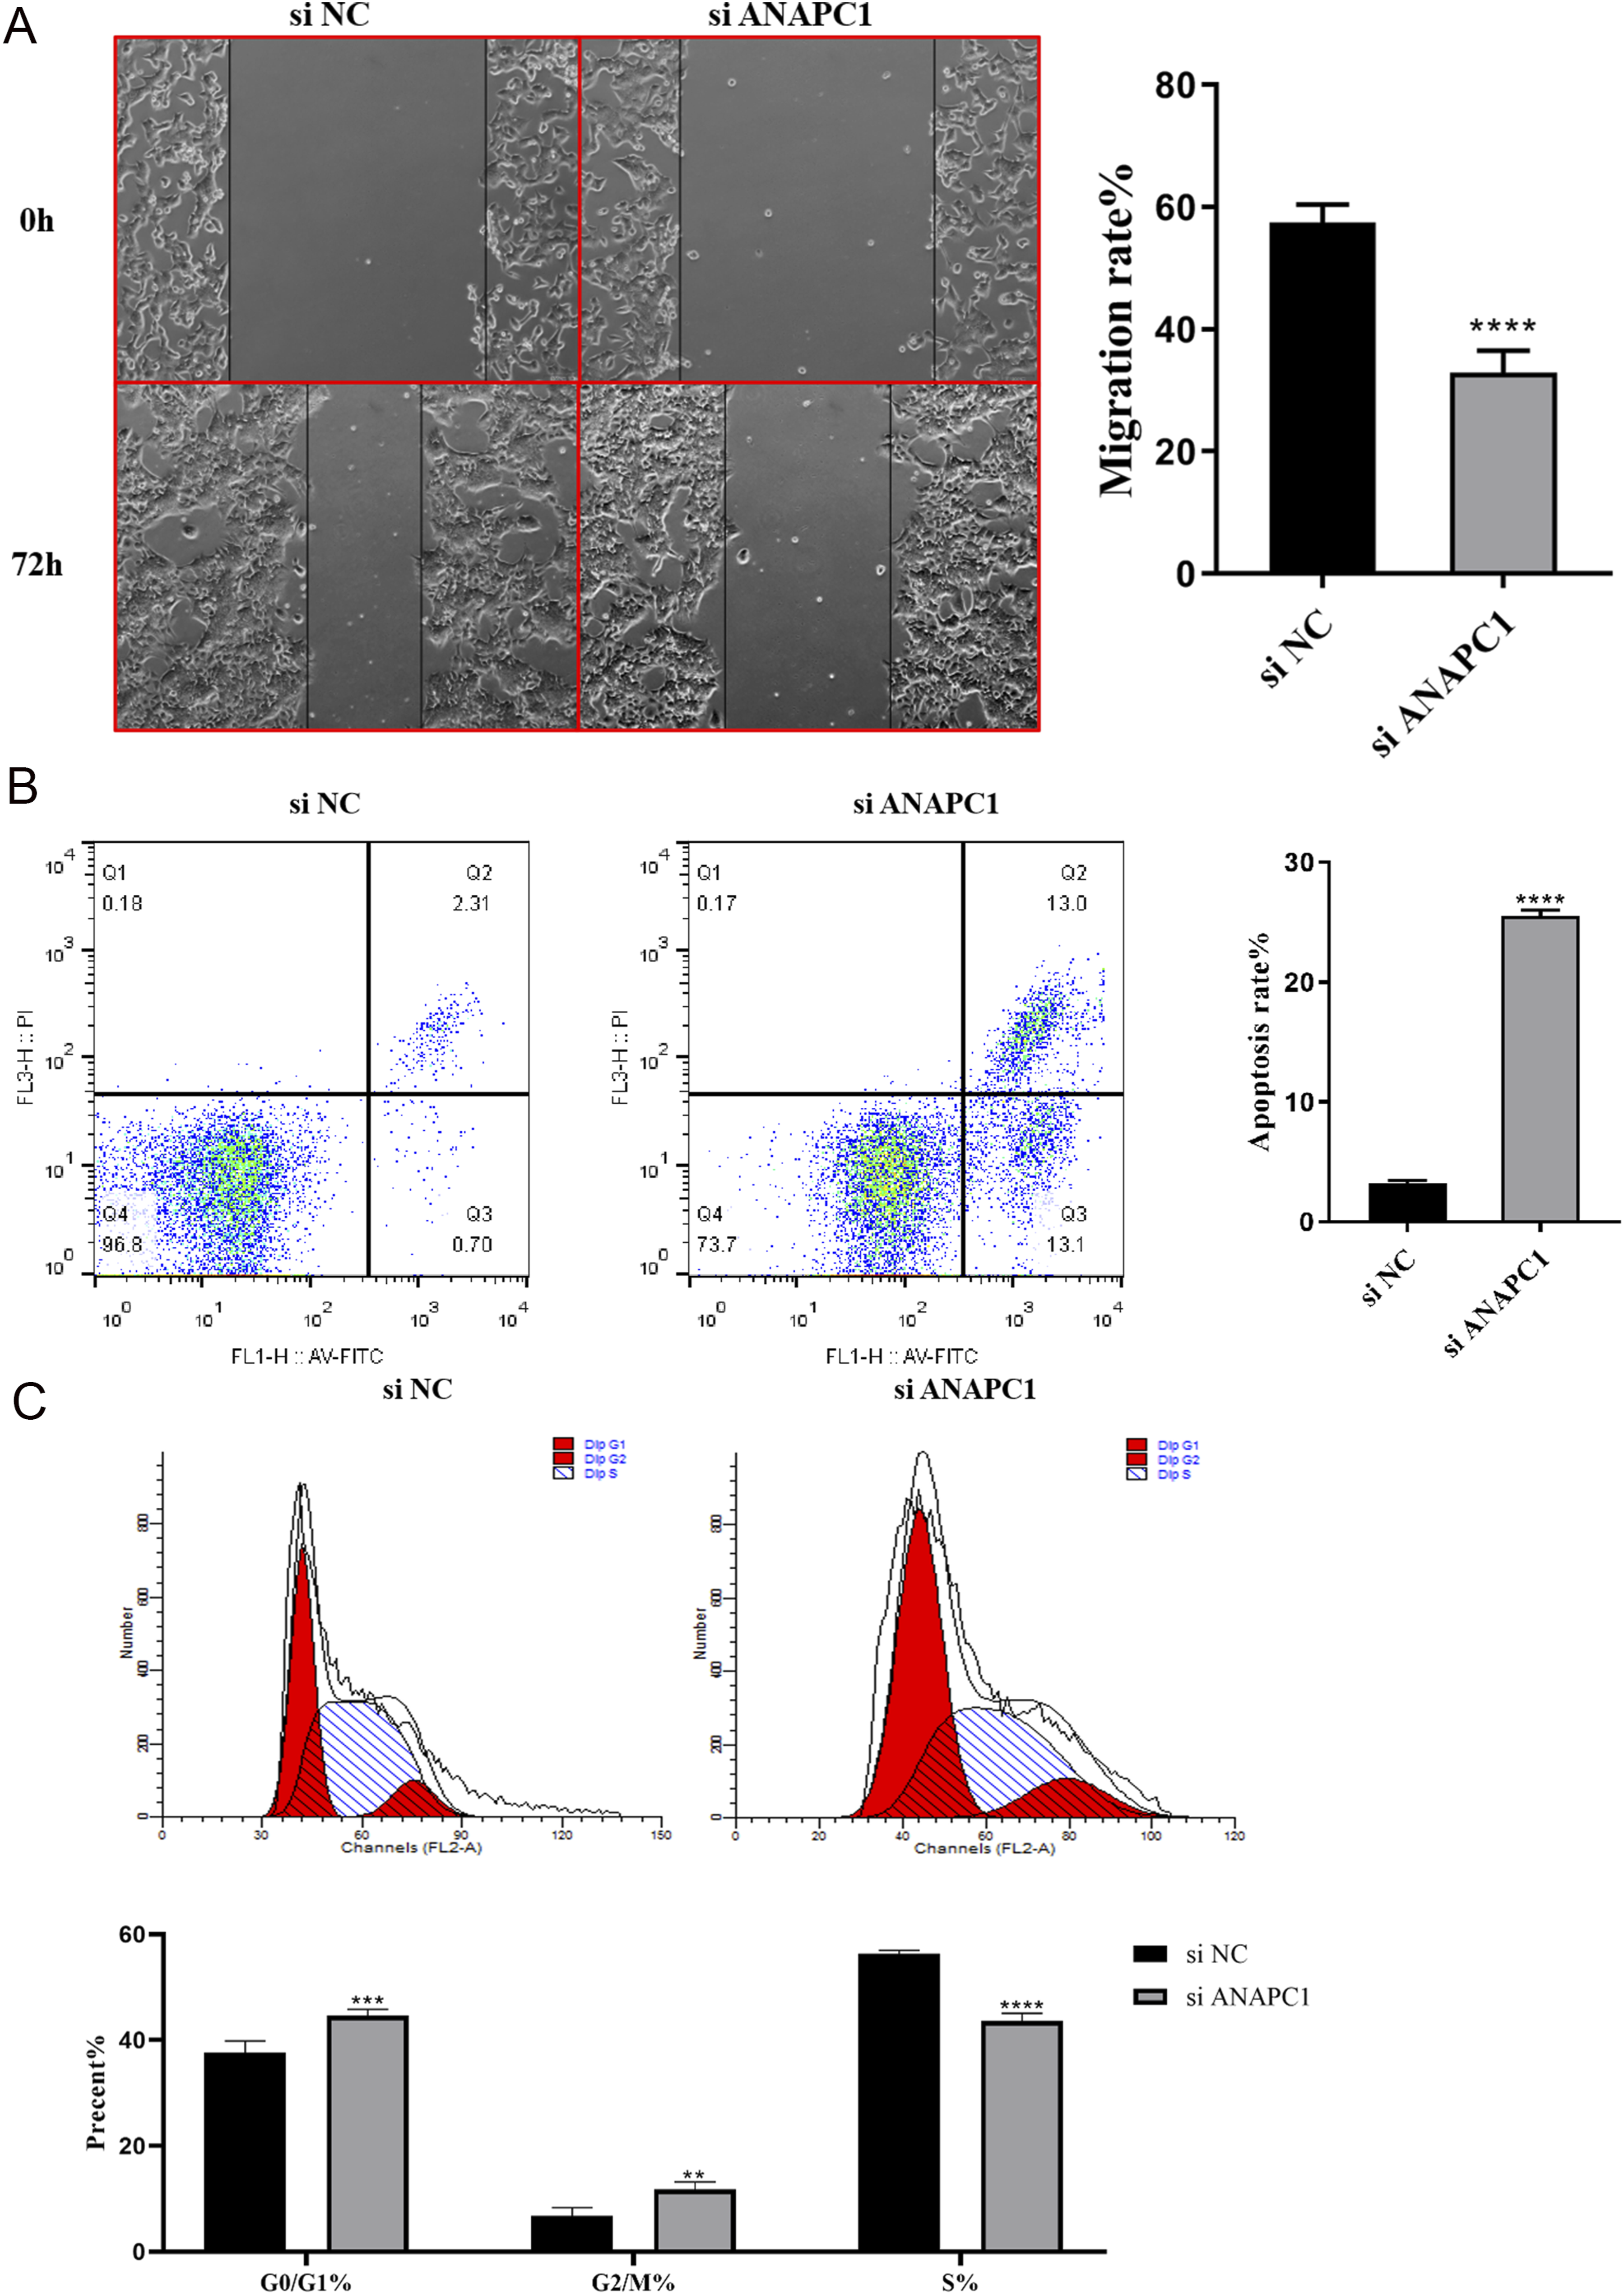

Assessment of the Clinicopathological Significance of ANAPC1 in CRC Tissue
In terms of mRNA, ANAPC1 exhibited a very strong ability to recognise CRC tissue (AUC > 0.8) across most of the expression matrix (Figure S5). The integrated analysis of all mRNA expression profiles indicated that ANAPC1 similarly demonstrates a very strong ability to identify CRC tissue (AUC = 0.96; sensitivity = 0.88; specificity = 0.93; PLR > 5; DLR < 0.2) (Figures 2E, S6). Furthermore, the ANAPC1 protein expression levels confirmed this strong discrimination (AUC = 0.953) (Figure 4D). In addition, we found no significant differences in either ANAPC1 mRNA or protein expression levels across clinical stages, T-stages, or N-stages (P > .05) (Figures S7A–F). Patients with low ANAPC1 mRNA expression had a greater probability of adverse prognostic events compared to those with high expression (P < 0.05) (Figure S7G–H), whereas there was no significant difference between the high- and low-expression groups of the protein (P > .05) (Figure S7I–J).
Analysis of the Correlation Between ANAPC1 and the Efficacy of Targeted Therapy and Immunotherapy for CRC and Exploration of Potential Mechanisms
Correlation Analysis Between Antitumor Drug Sensitivity and ANAPC1 Expression Levels in CRC Tissue.

As for immunotherapy, ANAPC1 expression levels were positively correlated with the expression levels of many immune checkpoint-related molecules (R > 0; P < .05) (Figure 10A). Molecular (MHC), effector cells (EC), immune checkpoints (CP), and immunosuppressive cells’ (SC) immunity scores indicated a highly significant difference (P < .05) between ANAPC1 high- and low-expression groups (Figure 10B). This further implies the great potential of ANAPC1 in immunotherapy. Further studies found that the potential therapeutic effect of ANAPC1 is significantly stronger in the low-expression group than in the high-expression group (P < .05), whether using CTLA4 and PD-1 inhibitors alone or in combination (Figure 10C). Analysis of the Potential Impact of ANAPC1 on Immunotherapy of CRC and Exploration of Its Mechanism (A) Analysis of the Correlation Between ANAPC1 and Immune Checkpoint Molecule Expression in CRC Tissue; (B and C) the Potential Efficacy of Immunotherapy was Compared Between the High-Expression Group and the Low-Expression Group Based on the Median ANAPC1 Expression Level; (D) Analysis of Differentially Expressed Genes in Malignant Epithelial Cells before and after PD-1 Inhibitor Treatment; (E) GO and KEGG Enrichment Analysis Based on Differentially Expressed Genes in Malignant Epithelial Cells Before and After PD-1 Inhibitor Treatment; (F) Comparing the Intensity of Cell Communication in CRC Tissue Before and After PD-1 Inhibitor Treatment; (G and H) Comparing the Differences in CCL and VEGF Signalling Pathways in CRC Tissue Before and After PD-1 Inhibitor Treatment.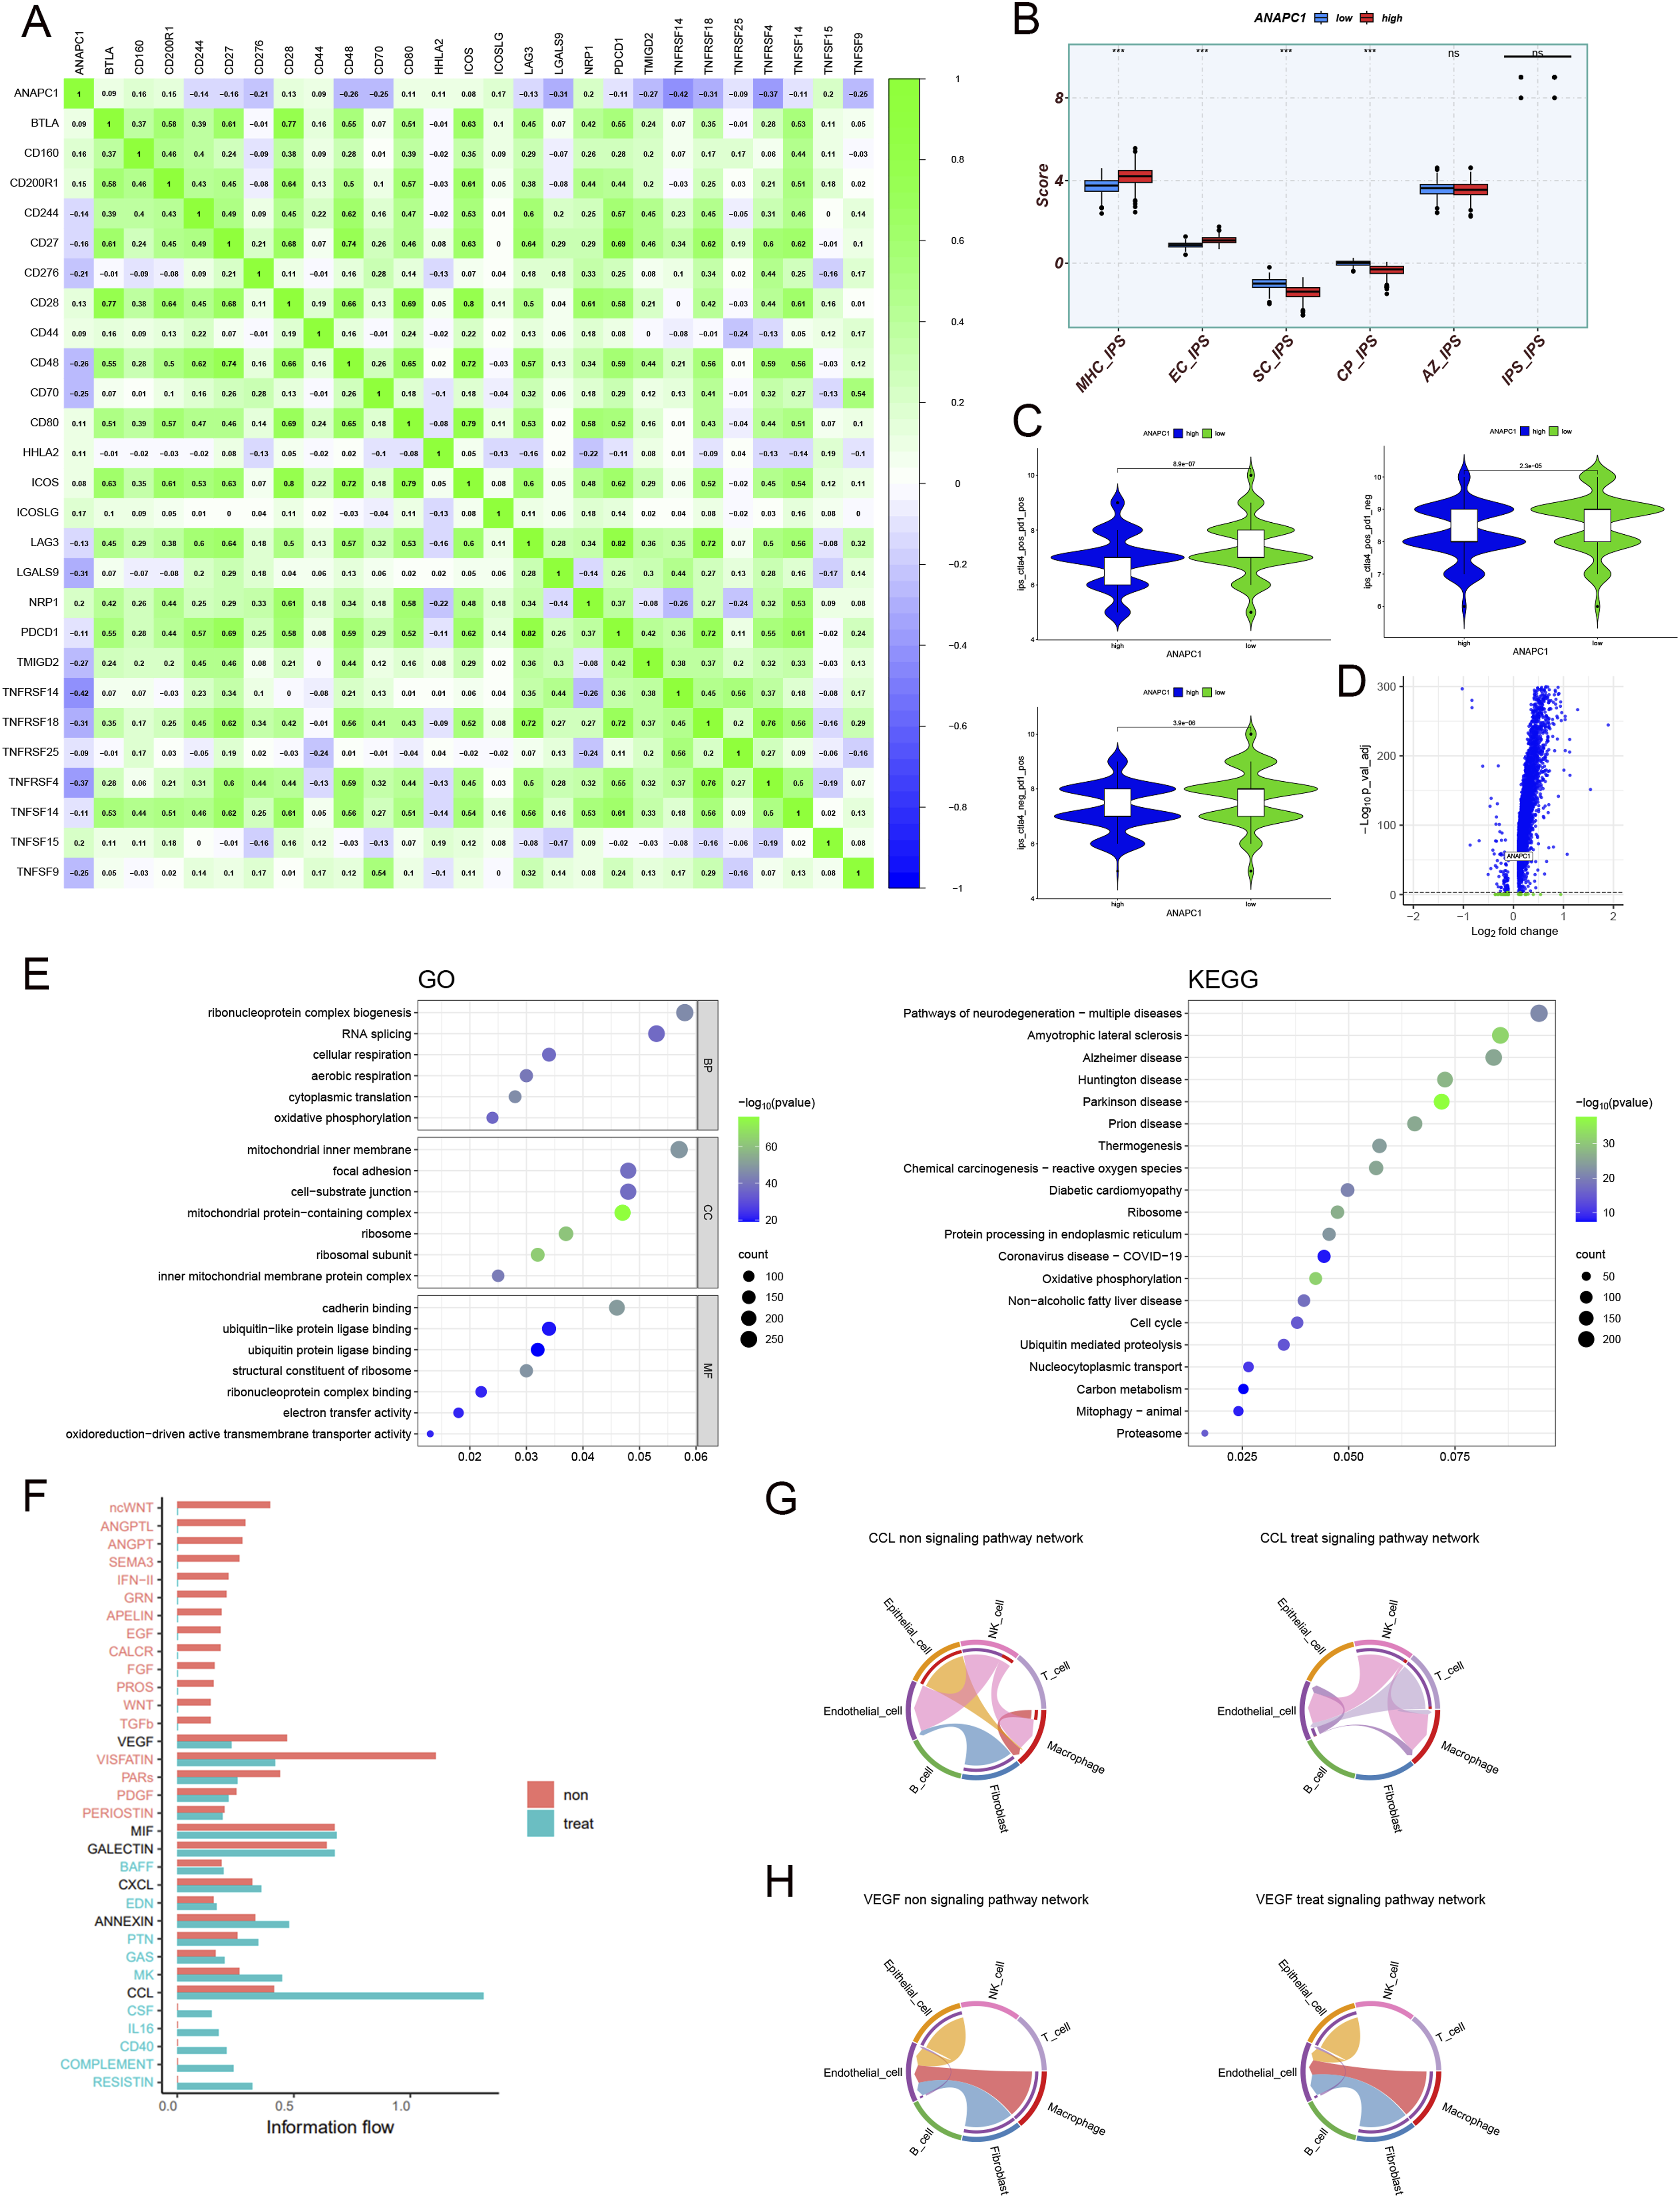
We assessed the mechanism of the potential impact of ANAPC1 on immunotherapy efficacy in CRC in depth using scRNA-seq. Malignant epithelial cells of untreated CRC patients indicated a significantly higher expression of ANAPC1 compared to those of CRC patients treated with PD-1 inhibitors (P < .05) (Figure 10D). The differentially expressed genes in untreated CRC malignant epithelial cells vs PD-1-treated malignant epithelial cells were significantly enriched in ribonucleoprotein complex biogenesis, ribosome, cell cycle, and RNA splicing pathways (Figure 10E). This analysis aligns with the potential biology of ANAPC1 in CRC, indicating its value in CRC immunotherapy. Comparing the single-cell landscape of untreated CRC tissue with that of CRC tissue treated with PD-1, the CCL signalling pathway was stronger in the treated group than in the untreated group, and vice versa for the VEGF signalling pathway (Figure 10F). Detailed differences in the CCL and VEGF signalling pathways before and after PD-1 treatment are illustrated in Figures 10G–H.
Discussion
It is well known that abnormal mitosis often plays an important role in a variety of tumours, including CRC.19-22 ANAPC1 is not only a regulator of mitosis but also an important factor in tumorigenesis. 9 However, as far as we know, to date no comprehensive and systematic study on ANAPC1 in CRC has been conducted. In this study, we used the available bulk RNA-seq, scRNA-seq, and immunohistochemistry techniques. We evaluated the abnormally high expression pattern of ANAPC1 in CRC and integrated evidence from gene function annotation, ssGSEA, and WGCNA. Our findings reveal that abnormally expressed ANAPC1 may affect the occurrence and development of CRC by mediating pathways related to DNA replication, chromosome segregation, nuclear division, and ribosomes. We also conducted in vitro cell biology experiments to verify the above-mentioned biological effects. By comprehensively applying multiple analysis methods, we preliminarily confirmed ANAPC1’s potential impact on CRC targeted and immunotherapy efficacy. This study will provide new insights into the expression, underlying mechanisms, and clinical implications of ANAPC1 in CRC.
This study integrates, for the first time, a comprehensive assessment of the overexpression of ANAPC1 in CRC tissue from 2329 colorectal mRNA expression profiles. The sources and production processes of these external datasets may vary due to time and space, such as differences arising from different technical standards at different research institutions. However, the results derived from the computational analyses described above demonstrate that these datasets can be combined for analysis without significantly compromising the results. The scRNA-seq analysis of malignant epithelial cells and protein immunohistochemistry of 416 samples confirm the accuracy of these results. Moreover, the strong discriminatory ability of ANAPC1 mRNA and protein against CRC further supports the results. Therefore, considering the wide range of sources of the study data, it is more accurate and universal to conclude that ANAPC1 is overexpressed in CRC. In addition, by comprehensively analysing the data from 43 CRC cell lines with ANAPC1 knockdown using the CRISPR system and cell viability assay, the present study further elucidates the critical role of ANAPC1 in CRC cells in terms of cell proliferation. Therefore, abnormal ANAPC1 may play a positive role in the development of CRC.
In view of the potential positive role of ANAPC1 in CRC development, this study aimed to explore the biological mechanisms behind the abnormal expression of ANAPC1 in CRC from multiple perspectives, such as functional enrichment analysis, single-cell co-expression analysis, and various in vitro experiments. Interestingly, DNA replication, nuclear division, and ribosome-associated pathways were reflected in the multi-perspective analyses.
Abnormal DNA replication often leads to genomic instability. 23 DNA replication regulators can be involved in the promotion of DNA replication to accelerate the cell cycle, which in turn enhances cell proliferation and the metastatic progression of tumours. 24 TP53-deficient tumour cells exhibit enhanced cell proliferation and DNA replication-associated pathways. 25 In CRC, loss of the APC gene induces the transferrin receptor, which can affect DNA replication-related pathways and promote CRC growth by mediating iron input. 26 This also suggests an important role for the altered biological behaviour of some tumour suppressor genes in this process. MIF can localise to DNA replication forks to maintain high levels of DNA replication and promote growth in tumour cells. 27 IGF2BP3, which is closely related to DNA replication in CRC, can regulate angiogenesis in CRC tissue through its interaction with VEGF mRNA, thus promoting angiogenesis. 28 This is similar to what we observed in our cellular communication analyses.
It has been found that some current refractory CRC subpopulations may be effectively treated by targeting DNA damage and replication stress. 29 Inhibition of DNA ligase 1, which is associated with DNA replication, is a potential therapy for the treatment of CRC. 30 This also suggests the potential of DNA replication-related pathways in CRC therapy. Therefore, it is plausible that highly expressed ANAPC1 is involved in the development of CRC through DNA replication.
Furthermore, the importance of abnormal chromosome segregation and nuclear division promoting cellular immortalization during tumorigenesis is obvious. This is often a hallmark of malignancy.31,32 Recent studies have demonstrated that the METTL16-Soga1 pathway in CRC cells plays a crucial role in promoting chromosome segregation during mitosis. 33 Abnormal chromatin licencing and DNA replication factor 1 can lead to chromosome segregation errors, resulting in decreased genome and chromosome stability, in turn promoting the development of CRC. 34
In addition, chromosomal and genomic instability due to abnormal chromosome segregation has been demonstrated in a variety of other tumours. Aurora A, which is highly expressed in breast cancer cells, often leads to abnormal chromosome segregation and chromosomal instability, thus activating related oncogenic pathways. 35 In lung adenocarcinoma cells, COX6C can activate the AMPK pathway to cause spindle formation and chromosome segregation, leading to cell cycle arrest and apoptosis. 36 In hepatocellular carcinoma (HCC), a number of genes associated with chromosome segregation are overexpressed and are associated with a poor prognosis in HCC. 37 Spindle component 25, which is essential for chromosome segregation, promotes proliferation and enhances stemness in HCC cells through the DNA-PK/AKT/Notch1 signalling cascade. 38 P53 deficiency can result in aneuploidy through a large and persistent number of chromosomal missegregations that are significantly more variable during the progression and metastasis of gastric cancer. 39 Moreover, several analyses mentioned above support the idea that abnormal ANAPC1 in CRC is associated with abnormal chromosome segregation and nuclear division. Therefore, ANAPC1 in the abnormal nuclear division-associated pathway may also function in CRC through a similar pathway as described above.
Targeted therapy and immunotherapy show great promise for curing CRC.40,41 The present study provides new insights into the potential role of ANAPC1 in targeted therapy and immunotherapy for CRC. In terms of targeted therapy, AZD8055, an mTOR inhibitor, can induce G1 cell cycle arrest in tumour cells, resulting in a significant reduction in tumour cell proliferation. 42 Ribosome-associated pathways may be involved in the induction of resistant dendritic cells in tumour tissue when treated with AZD8055. 43 The selective ribosomal protein S6 kinase β-1 inhibitor PF-4708671 has been shown to decrease mTOR/S6K signalling and improve resistance to paclitaxel in ovarian cancer cells. 44 The inhibitory effect of PF-4708671 on the ribosomal protein S6 kinase β-1 could enhance the efficacy of tyrosine kinase inhibitors in non-small-cell lung cancer. 45 Furthermore, it has been claimed that the function of DEGs between NSCLC cells resistant to the tyrosine kinase inhibitor Osimertinib and intolerant cells is significantly enriched in the ribosome-associated pathway. 46 Interestingly, part of the pathway of action of these drugs also coincides with the abnormal functional expression of ANAPC1 in CRC.
In terms of immunotherapy, it has been reported that ISG20L2, which is associated with ribosome biogenesis, regulates the expression of immune checkpoints such as CTLA-4, PD-L1, and PD-1. 47 In tumour tissue, the interaction of the ribosomal protein S6 kinase β-1 with the transcription factor YBX1 significantly increases the phosphorylation and nuclear localization of YBX1, thus promoting the transcription of PD-L1. 48 Blocking PD-1 down-regulates ribosomal protein S6 kinase β-1-related pathways and enhances autophagy to increase tumour radiosensitivity. 49 It has also been claimed that the high expression of certain CCL molecules may suggest that tumour patients are sensitive to treatment with immune checkpoint inhibitors. 50
By contrast, VEGF affects the maturation of dendritic cells and interferes with T-cell initiation, thereby causing the body’s anti-tumour immune function to be down-regulated. 51 Several studies have shown that the combination of anti-VEGF therapy with immune checkpoint inhibitor therapy is a promising therapeutic approach.52,53 Interestingly, the mechanisms associated with these immunotherapies overlap with the pathways involved in ANAPC1 in CRC. In addition, evidence from this study indicates that ANAPC1 has a significant abnormal expression during immune checkpoint inhibitor therapy in CRC. Moreover, high expression of ANAPC1 in CRC is associated with the suppression of the tumour immune microenvironment. Therefore, ANAPC1 is a potential indicator for observing the efficacy of immunotherapy for CRC and for selecting and developing therapeutic regimens.
Some limitations of this study have to be mentioned. For example, the results of this study are mainly based on the comprehensive analysis of a large number of human tissue and cell samples, multi-level, multi-species, multi-source, internal and external, by various computational biology methods. In the future, we need to conduct more ex vivo and in vivo experiments to further validate and supplement the results of this study. Specifically, the potential value of ANAPC1 in targeted therapy and immunotherapy for CRC is not well understood. The translation of the relevant results into practical clinical applications cannot be achieved without more future evaluations. In addition, the limited immunohistochemical evaluation of ANAPC1 protein may have compromised the accuracy and representativeness of the prognostic value assessment at the ANAPC1 protein level. Therefore, the sample size should be expanded for further analysis in the future.
Conclusion
ANAPC1 plays an important role in the development of CRC. ANAPC1 potentially contributes to CRC development through involvement in pathways such as DNA replication, chromosome segregation, and ribosomes. ANAPC1 may be an important molecule affecting the efficacy of targeted therapies and immunotherapy for CRC.
Supplemental Material
Supplemental Material - The Potential Biological Roles and Clinical Significance of Anaphase-Promoting Complex Subunit 1 in Colorectal Cancer
Supplemental Material for The Potential Biological Roles and Clinical Significance of Anaphase-Promoting Complex Subunit 1 in Colorectal Cancer by Yi Chen, MD, Yu-Xing Tang, MD, Da-Tong Zeng, MD, Jia-Ying Wen, MD, Yan-Ting Zhan, MD, Dong-Ming Li, MD, Rong-Quan He, MD, Zhi-Guang Huang, MD, Yu-Zhen Chen, MD, Qiu-Yu Wei, MD, Gang Chen, PhD, Yu-Lu Tang, MD, and Hui Li, MD in Cancer Control
Footnotes
Acknowledgments
We sincerely express our gratitude to the editors and five anonymous reviewers for their invaluable comments, which have significantly enhanced the quality of our study. Our thanks also go to Zhuoqiang Biotechnology (Nanning, China) for providing CCK-8, scratch assay, cell cycle, and apoptosis assay services, along with related technical support (No. LY240729zq). Moreover, we are deeply appreciative of the Guangxi Zhuang Autonomous Region Clinical Medicine Research Centre for Molecular Pathology and Intelligent Pathology Precision Diagnosis for offering computational pathology and clinical pathology technical support.
Statements and Declarations
Consent for Publication
All authors have read and agreed to the published version of the manuscript.
Author Contributions
Funding
The authors disclosed receipt of the following financial support for the research, authorship, and publication of this article: This work was supported by the Guangxi Zhuang Autonomous Region Health Commission Scientific Research Project [grant number Z-A20220415, Z-A20220465, Z-A20210442]; the Youth Science Foundation of Guangxi Medical University [grant number GXMUYSF202423]; the First Affiliated Hospital of Guangxi Medical University Provincial and Ministerial Key Laboratory Cultivation Project: Guangxi Laboratory of Enhanced Recovery after Surgery for Gastrointestinal Cancer [grant number No. 21-220-18]; the China Undergraduate Innovation and Entrepreneurship Training Program [grant number S202310598169]; the Future Academic Star of Guangxi Medical University [grant number WLXSZX23114]; the Innovation Project of Guangxi Graduate Education [grant number JGY2023068]; Guangxi Higher Education Undergraduate Teaching Reform Project [grant number 2022JGA146]; Guangxi Educational Science Planning Key Project [grant number 2022ZJY2791]; Guangxi Medical University Undergraduate Education and Teaching Reform Project [grant number 2023Z10].
Conflicting Interests
The authors declared no potential conflicts of interest with respect to the research, authorship, and/or publication of this article.
Data Availability Statement
Internal data for this study can be obtained from the corresponding author upon reasonable request.
Supplemental Material
Supplemental material for this article is available online.
Appendix
References
Supplementary Material
Please find the following supplemental material available below.
For Open Access articles published under a Creative Commons License, all supplemental material carries the same license as the article it is associated with.
For non-Open Access articles published, all supplemental material carries a non-exclusive license, and permission requests for re-use of supplemental material or any part of supplemental material shall be sent directly to the copyright owner as specified in the copyright notice associated with the article.