
Abstract
Background
The benefit of adjuvant chemotherapy for IB/IIA non-small cell lung cancer (NSCLC) patients remains uncertain. This study aimed to develop a prognostic model to predict overall survival in resected NSCLC patients with T1-2N0-1M0 stage and identify optimal candidates for postoperative chemotherapy among those with stage IB or IIA disease.
Methods
We conducted a retrospective study using the SEER 18 database (2000–2018, November 2020 submission) of patients who underwent radical surgery for T1-2N0-1M0 NSCLC. The patients not receiving adjuvant chemotherapy were randomly divided into training and validation cohorts. A prognostic nomogram was established and evaluated using calibration and receiver operating characteristic curves. Based on the nomogram, stage IB and IIA patients were categorized into two prognostic groups, each further divided into cohorts based on adjuvant chemotherapy status. Kaplan-Meier analysis and log-rank tests were used to compare overall survival between these groups.
Results
A total of 14 789 patients were enrolled and randomly assigned to the training cohort (n = 10 352) and validation cohort (n = 4437). Ten independent prognostic factors were identified and integrated into the prognostic model. The area under the receiver operating characteristic curve was .706, .699, and .705 in the training cohort, and .700, .698, and .695 in the validation cohort at 1, 3, and 5 years, respectively. Among stage IB and IIA patients, only those in the high-risk group showed a significant benefit from adjuvant chemotherapy, with a 16.4% absolute increase in 5-year overall survival.
Conclusions
The nomogram developed in the study may help physicians choose the most appropriate management strategy for each patient.
Keywords
Introduction
In 2020, lung cancer ranked as the second most commonly diagnosed cancer and the leading cause of cancer-related deaths, resulting in approximately 2.2 million new cases and 1.8 million fatalities. 1 Despite notable advancements in diagnosing and treating the disease, lung cancer continues to have a poor prognosis. 1 Non-small cell lung cancer (NSCLC), which accounts for approximately 85% of new lung cancer cases, typically manifests as adenocarcinoma, squamous cell carcinoma (SCC), or large cell carcinoma. 2 The treatment options for NSCLC depend on its pathological types, and physicians rely on the American Joint Committee on Cancer (AJCC) staging system to determine the most suitable postoperative treatment approach for their patients. Previously, radical surgery was the standard therapy for resectable NSCLC, offering the highest chance of cure. 3 However, the 5-year overall survival (OS) rates following surgery varied significantly, ranging from 90% for stage IA1 to 41% for stage IIIA. 4 The leading causes of failure were distant metastasis and local recurrence. The primary causes of treatment failure were distant metastasis and local recurrence. In some cases, even patients in the early stages of the disease may already have microscopic metastases at the time of diagnosis, leading to relapse and metastasis after surgery. 5 Adjuvant chemotherapy (ACT) administered after surgery can eliminate residual tumor cells and has been shown in several studies to improve the OS of resectable NSCLC patients.6-9 However, it has also been confirmed that ACT does not provide survival benefits for certain early stage patients.10-13 Moreover, physicians must consider the potential adverse side effects of chemotherapy, including the risk of developing a second cancer, cognitive difficulties, and hearing problems. Therefore, the appropriate selection of patients for ACT is crucial for physicians.
The National Comprehensive Cancer Network (NCCN) has recommended the use of ACT for patients diagnosed with stage IIB and III NSCLC. However, it remains uncertain whether patients with stage IB or IIA would derive similar benefits from ACT.6-12,14 Several studies have been conducted to identify which early stage NSCLC patients would be suitable candidates for ACT.15,16 Wang et al discovered that ACT could be beneficial for patients with Stage I NSCLC and lymphovascular invasion, while Morgensztern and colleagues found that ACT could improve the survival of T2N0M0 NSCLC patients regardless of tumor size. Although the AJCC staging system plays a crucial role in determining the treatment of NSCLC, it overlooks several important prognostic factors, including age, sex, histology, and tumor grade.17-19 Patients with the same stage of NSCLC and receiving the same treatment may have significantly different prognoses.
Nomograms have gained increasing popularity in quantifying risks based on prognostic factors.20-23 These tools enable the appropriate stratification of patients into different prognostic groups, facilitating precise treatment decisions and follow-up management.24,25 Evidence has shown that nomograms outperform the traditional TNM staging system in predicting outcomes for various types of tumors.26,27 Notably, there is currently a lack of available nomograms that accurately predict the OS of resected T1-2N0-1M0 NSCLC patients.
The objective of our study was to develop a nomogram using data from the Surveillance, Epidemiology, and End Results (SEER) database to predict the OS of patients with resected T1-2N0-1M0 NSCLC. Additionally, we aimed to assess the nomogram’s potential for identifying patients who may benefit from ACT at stage IB or IIA.
Methods
Study sample
This was a SEER-based retrospective study. We obtained data from the SEER 18 database (2000–2018, November 2020 submission), which collects cancer-related information, covers nearly 27.8% of the U.S. population, and is annually updated. Using SEER*Stat software (version 8.3.9.1), we identified patients diagnosed with T1-2N0-1M0 NSCLC between 2004 and 2015. To ensure sufficient follow-up time, we excluded patients diagnosed after 2015. The ICD-O-3 histologic codes designated as NSCLC, which we utilized to identify cases, included 8012, 8013, 8014, 8015, 8022, 8031, 8032, 8046, 8050-8052, 8070-8078, 8140, 8141, 8144, 8147, 8250-8255, 8260, 8310, 8323, 8430, 8480, 8481, 8490, 8560, 8570, 8572, 8574, and 8575. The inclusion criteria were listed below: (a) patients with pathological confirmation of NSCLC between 2004 and 2015, (b) T1-2, N0-1, M0 according to the AJCC staging system, 6th edition, (c) the ICD-O-3 behavior code is “malignant.” From an initial pool of 109 239 patients with T1-2N0-1M0 NSCLC, we excluded those who did not meet the following criteria: (a) survival time unknown or less than 1 month, (b) age younger than 18 years or older than 80 years, (c) unknown race or marital status, (d) unknown tumor grade or primary site, (e) unknown tumor size or tumor size greater than 5 cm, (f) more than one tumor, (g) did not receive radical surgery, (h) unknown number of removed regional lymph nodes, (i) received adjuvant radiotherapy or neo-adjuvant therapy (chemotherapy or radiotherapy) or status unknown, (j) incomplete follow-up. The workflow of our study was illustrated in Figure 1. Since the goal of our study was to predict the OS of patients with resected T1-2N0-1M0 NSCLC individually before treatment (chemotherapy or radiotherapy) and to guide ACT, we designated the subgroup of patients who did not receive ACT as the “ACT-excluded sample” and the entire cohort of patients as the “ACT-included sample.” Study design flowchart for 17023 T1-2N0-1M0 non-small cell lung cancer patients.
Baseline Characteristics of Patients in the Training and Validation Cohorts of the ACT-Excluded Sample.

USDW: unmarried/separated/divorced/widowed; SCC: Squamous cell carcinoma. P value <.05 was considered to be statistically significant.
The ACT-included sample comprised 17 023 patients diagnosed with T1-2N0-1M0 NSCLC between 2004 and 2015, who fulfilled the predetermined inclusion and exclusion criteria.
Because the SEER database did not contain any patient identifiers and is publicly available for cancer-related analysis, no ethical approval or informed consent is required. The reporting of this study conforms to RECORD guidelines. 28
Variables
The main criterion variable in performing the analysis on which the creation of the nomogram was based was OS. OS was defined as the time interval from diagnosis to death from any cause or the last follow-up. We chose OS as the criterion variable for building the nomogram because it can reflect both the risks and benefits of the clinical treatment comprehensively.
Independent prognostic factors used to predict the OS were a set of demographic and tumor - related factors. Some of the factors were divided into categories based on the optimal cut-off point for OS, calculated using the X-tile software. Independent prognostic factors included in the study were: - Age at diagnosis—Patients were categorized into 3 groups: below 60 years, between 60 and 72 years, and above 72 years. The ACT-excluded sample had 26% below 60, 48% between 60 and 72, and 26% above 72. The ACT-included sample had 27% below 60, 48% between 60 and 72, and 25% above 72. - Sex—Similar male-to-female ratios were observed in both samples, with Females constituting about 53%. - Race—Both samples consisted about 82% White, 11% Black, and 7% Other. - Marital status at diagnosis—59% of patients were married, and 41% were unmarried/separated/divorced/widowed (USDW) in both samples. - Primary tumor site—Distribution across lower lobe, middle lobe, upper lobe, main bronchus, and overlapping sites varied slightly between samples. - Tumor grade—In the ACT-excluded sample, 19% had grade I, 48% had grade II, 32% had grade III, and 1% had grade IV tumors. In the ACT-included sample, percentages were 17%, 48.0%, 33%, and 2% for grade I, II, III, and IV tumors respectively. - Histology - 27% of patients had SCC in both samples. - T stage—There was a little difference between the two samples. In the ACT-excluded sample, 64% had T1a/T1b or T1c tumors, while this percentage was 59% in the ACT-included sample. - N stage—94% (ACT-excluded) and 88% (ACT-included) had tumors that did not spread to lymph nodes. - Tumor size—In the ACT-excluded sample, 66% had tumors up to 25 mm, whereas in the ACT-included sample, this percentage was 62%. - Regional lymph nodes removed—75% (ACT-excluded) and 76% (ACT-included) had 4 or more nodes removed during tumor resection. - Surgical type—Most patients underwent lobectomy (82% in ACT-excluded, 84% in ACT-included).
All variables were obtained from the SEER 18 database (2000–2018, November 2020 submission. Detailed dictionary of variables included in the SEER databases can be found at https://seer.cancer.gov/data-software/documentation/seerstat/nov2021/#ss-variables.
Establishment of the predictive nomogram
We developed a nomogram (see Figure 2) to predict the OS of T1-2N0-1M0 NSCLC by integrating the independent prognostic factors listed below: age (≤60, >60 ≤ 72, or >72), marital status (married or USDW), sex (male or female), grade (Grade I, II, III or IV), histology (SCC or others), T stage (T1a/T1b, T1c, T2a, or T2b), N stage (N0 or N1), tumor size (≤25 mm or >25 mm), number of lymph nodes removed (<4 or ≥4), surgical type (segmentectomy or lobectomy). As shown in Figure 2, different values of each independent prognostic factor corresponded to a particular score by drawing a straight line up to the point axis. We calculated the total points by summing the points for all factors. By drawing a straight line from the total points axis to the survival axis at years 1, 3, and 5, we can obtain the survival probabilities at years 1, 3, and 5. Prognostic nomogram for T1-2N0-1M0 non-small cell lung cancer. USDW: unmarried/separated/divorced/widowed; SCC: Squamous cell carcinoma.
Statistical analysis
Statistical analysis in this study consisted of two stages—creating the nomogram and evaluating its accuracy.
To create the nomogram, we initially conducted univariate and multivariate Cox regression analyses to identify the optimal combination of independent prognostic factors for predicting OS, and to calculate hazard ratios (HR) and 95% confidence intervals (95% CI). The calculations were done on the training cohort of the ACT-excluded sample. Demographic and tumor-related factors that were significantly associated with OS in the univariate analysis were included into the multivariate analysis. A nomogram for predicting the OS at 1, 3, and 5 years was established based on the results of multivariate Cox regression in the training cohort.
To assess the predictive accuracy of the nomogram, we created receiver operating characteristic (ROC) curves and calibration curves. The calibration curves were generated by contrasting the nomogram’s predicted probabilities with the actual probabilities through bootstrapping with 500 resamples to verify the nomogram’s performance. The closer the curve is to the ideal curve, the better the predictive power of the nomogram. Additionally, we computed the area under the ROC curve (AUC) to evaluate the model’s performance. The larger the AUC, the higher the accuracy. We used the total points generated by the nomogram as risk scores and drew boxplots based on different clinicopathological factors to visualize the distribution of risk scores. In order to evaluate the predictive ability of our model on the benefit of ACT, we included patients who received ACT after radical surgery, referred to as the ACT-included sample, in our follow-up analysis. We performed multivariate Cox regression in the ACT-included sample to test whether ACT is a risk factor for patients with T1-2N0-1M0 NSCLC after radical surgery. We classified patients in both ACT-excluded and ACT-included samples into 2 risk groups (low-risk and high-risk groups) according to the risk score’s best cut-off point. In the ACT-included sample, patients from each risk group at stage IB and IIA were categorized into two cohorts (control and ACT cohorts) according to their chemotherapy status. Finally, OS of patients from 2 cohorts in each risk group were compared.
We used R software (version 4.1.0; http://www.r-project.org) for all data analyses and X-tile software (version 3.6.1, Yale University, USA) to calculate optimal cut-off points. 29 We entered the patient’s risk scores, survival time, and survival status into the X-tile software and ran the program to obtain the result. 29 A two-sided P value <.05 was considered to be statistically significant. A chi-square or Fisher’s exact test was performed to compare the distribution of demographic and clinical variables between the cohorts. The Kaplan-Meier method and log-rank test were used to estimate and compare the OS between different groups. Propensity score matching (PSM) was used to balance the characteristics between ACT and control cohorts. In PSM, patients between cohorts were matched 1:1 using the nearest-neighbor method with a caliper = .05. The “rms” package in R software was utilized to construct the nomogram, the “tableone” package was used for group characteristics comparison, the “survival” package was used for Cox regression analysis, the “survivalROC” package was employed to generate ROC curves, the “MatchIt” package was used for PSM, and the “ggplot2” package was utilized to plot Kaplan–Meier curves.
Results
Identifying independent prognostic factors
Univariate and Multivariate Cox Regression Analysis in the Training Cohort.

HR: hazard ratios (adjusted); USDW: unmarried/separated/divorced/widowed; SCC: Squamous cell carcinoma. P value <.05 was considered to be statistically significant.
Age: Patients above 72 years of age had a HR of 2.246 (95% confidence interval [CI]: 2.059–2.451) compared to patients aged ≤60 years. Patients between 60 and 72 years of age had a HR of 1.588 (95% CI: 1.462–1.725) compared to patients aged ≤60 years. These results indicate that increasing age is associated with poor prognosis for OS.
Sex: Male patients had a HR of 1.459 (95% CI: 1.373–1.552) compared to female patients. This suggests that male sex is a significant independent prognostic factor for OS, with male patients having a worse prognosis than female patients.
Marital status: Married patients had a HR of .802 (95% CI: .755–.853) compared to USDW patients. This indicates that USDW patients have a worse prognosis for OS, while those who are married have a better prognosis.
Tumor grade: Patients with grade II tumors had a HR of 1.648 (95% CI: 1.491–1.820), those with grade III tumors had a HR of 2.121 (95% CI: 1.912–2.352), and those with grade IV tumors had a HR of 2.030 (95% CI: 1.602–2.572) compared to patients with grade I tumors, indicating that higher tumor grade is associated with worse prognosis for OS.
Histology: Patients with non-Squamous cell carcinoma (non-SCC) histology had a HR of .827 (95% CI: .775–.882) compared to patients with SCC, indicating that SCC histology is associated with worse prognosis for OS.
T stage: Patients with T1c tumors had a HR of 1.141 (95% CI: 1.045–1.245), those with T2a tumors had a HR of 1.277 (95% CI: 1.169–1.396), and those with T2b tumors had a HR of 1.362 (95% CI: 1.189–1.560) compared to patients with T1a/T1b tumors, indicating that increasing T stage is associated with worse prognosis for OS.
N stage: Patients with N1 tumors had a HR of 2.031 (95% CI: 1.830–2.254) compared to patients with N0 tumors, indicating that nodal involvement (N1) is associated with worse prognosis for OS.
Tumor size: Patients with tumor sizes larger than 25 mm had a HR of 1.209 (95% CI: 1.115–1.311) compared to patients with tumor sizes of 25 mm or less, indicating that larger tumor size is associated with worse prognosis for OS.
Number of removed lymph nodes: Patients who had four or more regional lymph nodes removed had a HR of .731 (95% CI: .681–.785) compared to patients who had fewer than four nodes removed, indicating that removing more lymph nodes is associated with better prognosis for OS.
Surgical type: Patients who underwent lobectomy had a HR of .790 (95% CI: .727–.859) compared to patients who underwent segmentectomy, indicating that lobectomy is associated with better prognosis for OS than segmentectomy.
Validation of the nomogram
The ROC curves showed that the nomogram’s AUC (see Figure 3) for predicting 1-year, 3-year, and 5-year OS was .706, .699, and .705 in the training cohort and .700, .698, and .695 in the validation cohort. In comparison, the traditional TNM staging system’s ROC curves demonstrated AUC values of .616, .602, and .592 for 1-year, 3-year, and 5-year OS in the training cohort, and .612, .617, and .601 in the validation cohort. It is noteworthy that the nomogram’s AUC was consistently larger than that of the traditional TNM staging system in all cohorts, indicating superior predictive performance (Figure 3). To further assess the accuracy and reliability of the nomogram, calibration curves were constructed to compare the predicted probabilities with the observed probabilities. The probabilities predicted by the nomogram were contrasted with the actual probabilities by bootstrapping with 500 resamples in calibration curves. In an ideal model, the curve will fall on the diagonal of 45-degree. The more the curve is close to the ideal curve, the better the nomogram’s predictive power will be. The calibration curves demonstrated good consistency between the predicted and observed values for both the training and validation cohorts (Figure 4). ROC curves for overall survival prediction at 1-year, 3-year, and 5-year intervals in the training (A, C, E) and validation cohorts (B, D, F). ROC: Receiver operating characteristic; AUC: area under the ROC curve. Calibration curves for overall survival prediction at 1-year, 3-year, and 5-year intervals in the training (A) and validation cohorts (B).

The prognostic risk score system and its clinical application
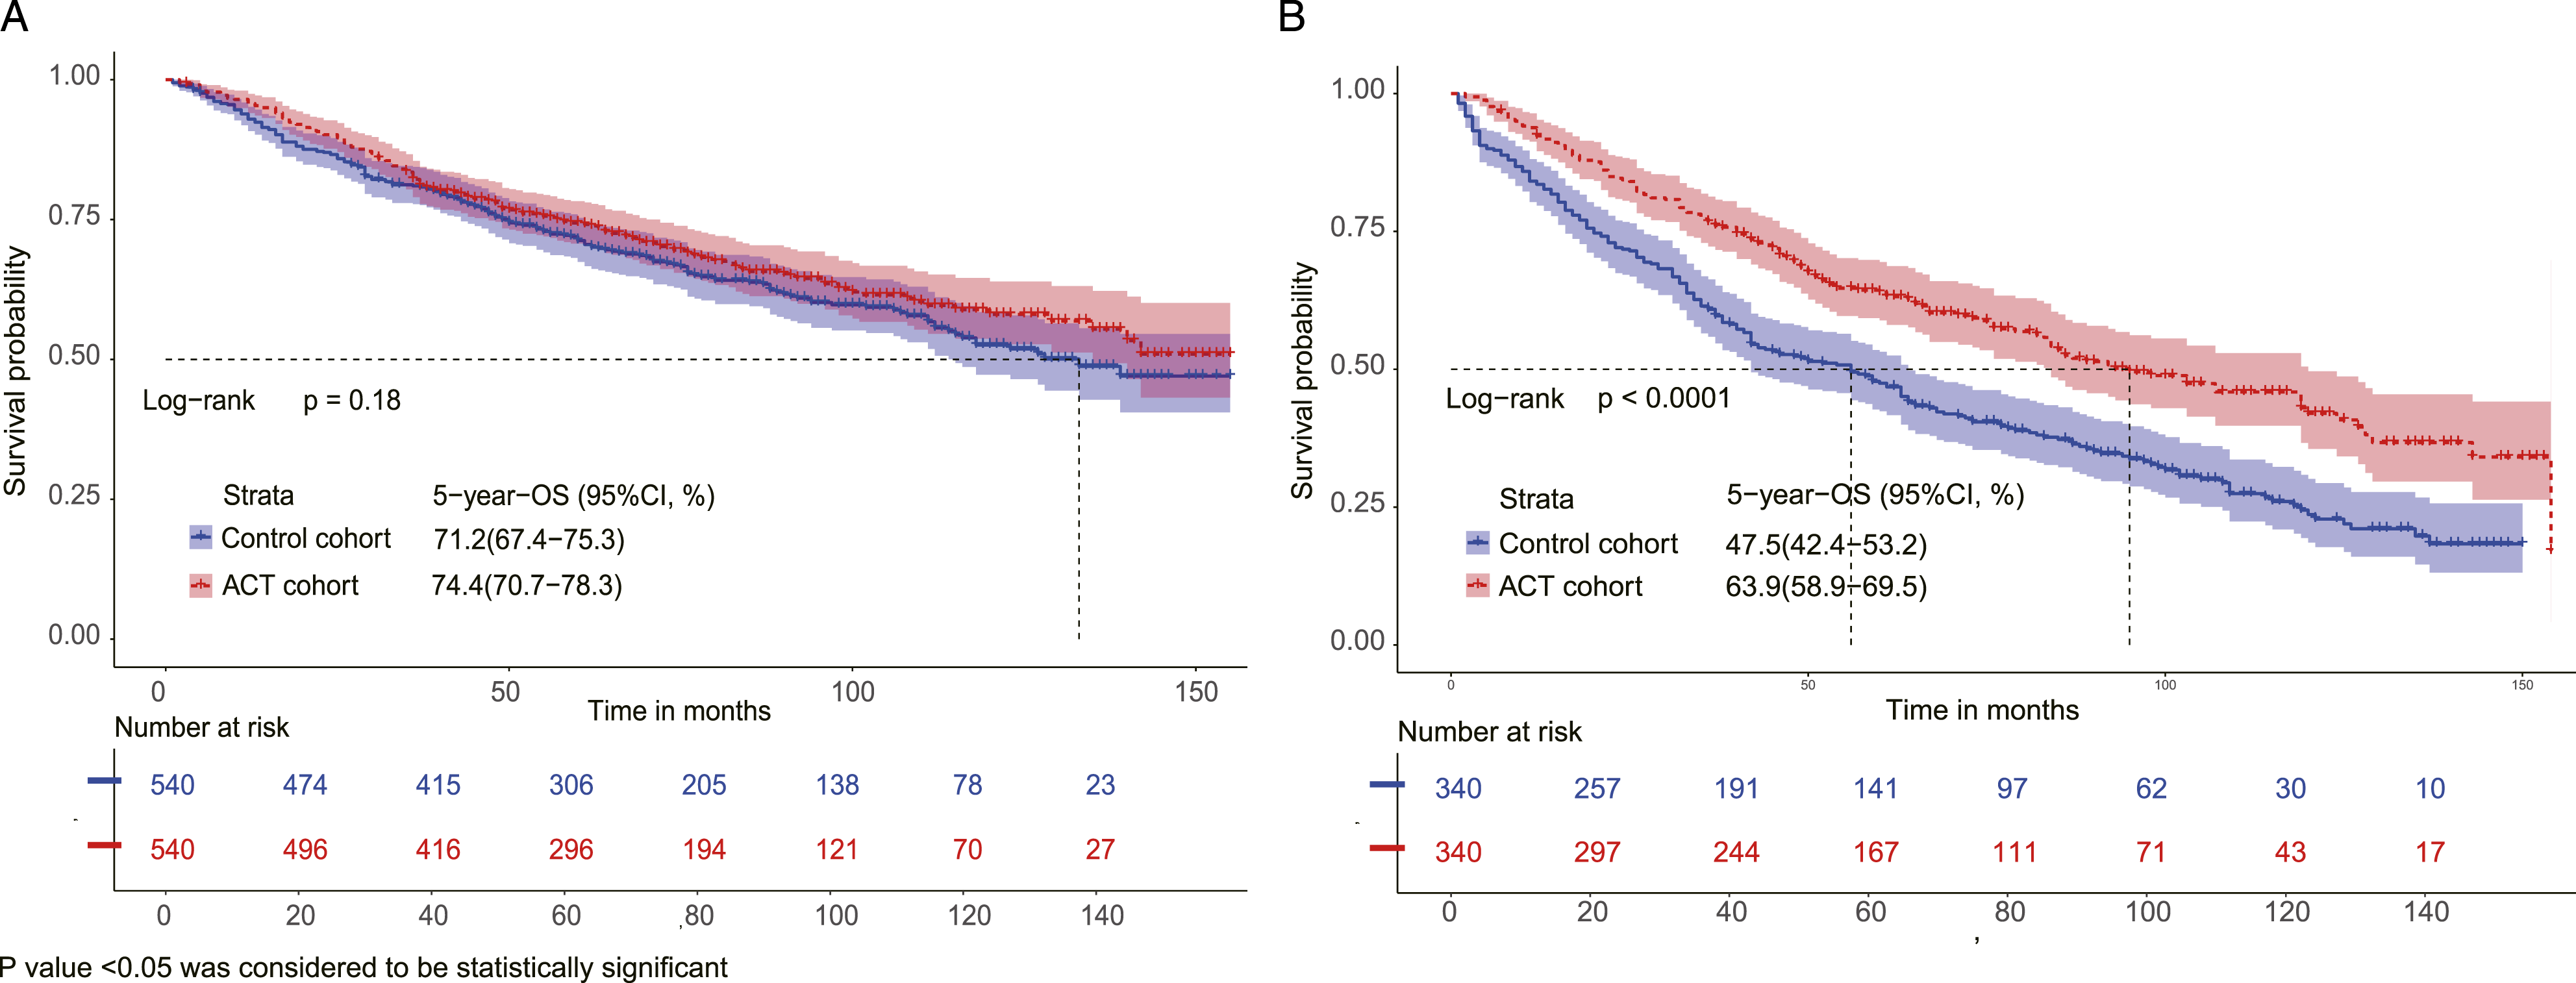
In this study, we utilized the total points generated by the nomogram as risk scores and employed boxplots to display the distribution of risk scores based on various clinicopathological factors. Figure 5 illustrates that our risk score system aligns with the conventional grading and TNM staging system, wherein patients with higher risk scores had a worse prognosis. To determine the best cut-off point for risk scores, we utilized X-tile software. The optimal cut-off point for the risk score was calculated to be 227.7, as depicted in Figures 6(C) and (F). The patients were categorized into two prognostic groups based on their risk scores: those with a score of ≤227.7 were categorized as the low-risk group, while those with scores above this threshold were classified as the high-risk group. In both the ACT-excluded and ACT-included samples, patients in the high-risk group had a significantly higher HR compared to those in the low-risk group, with a HR of 2.673 (95% CI, 2.545–2.808) and 2.489 (95% CI, 2.378–2.606), respectively. Survival curves showed good discrimination between the low- and high-risk groups in the whole cohort, the training cohort, and the validation cohort, with 5-year OS rates of 76.6% and 48.2% for the whole cohort, 76.6%, and 48.0% for the training cohort, and 76.4% and 48.5% for the validation cohort, respectively (see Figure 7). A multivariate Cox regression was conducted in the ACT-included sample, which revealed that age, sex, marital status, tumor grade, histology, T stage, N stage, tumor size, the number of removed lymph nodes, surgical type, and ACT were independent prognostic factors for OS in patients with T1-2N0-1M0 NSCLC following radical surgery. In stages IB and IIA, patients in each risk group were divided into 2 cohorts according to their chemotherapy status. We used PSM to balance the characteristics between cohorts to reduce selection bias. In the low-risk group, 11 ACT patients were excluded from PSM analysis, and in the high-risk group, 5 ACT patients were excluded from PSM analysis. After PSM analysis, there are 540 ACT patients in the low-risk group and 340 ACT patients in the high-risk group. The characteristics of the control and ACT cohorts at baseline for each risk group were shown in Table 3. As illustrated in Figure 8, ACT in the high-risk group improved OS (P < .0001) but not in the low-risk group (P = .18). For patients in the low-risk group, the 5-year OS rate was 74.4% in the ACT cohort and 71.2% in the control cohort. As for those in the high-risk group, the 5-year OS rate was 63.9% in the ACT cohort and 47.5% in the control cohort. Boxplots of risk scores based on clinicopathological factors, including tumor stage (A), T stage (B), N stage (C), tumor size (D), tumor grade (E), and histology (F). SCC: squamous cell carcinoma. X-tile analysis of overall survival based on age, tumor size, and risk score, indicating optimal cut-off points. The optimal cut-offs for age were 60 and 72 years (A, D); The optimal cut-off point for Tumor size was 25.0 mm (B, E); The optimal cut-off point for Risk score was 227.7 (C, F). Kaplan-Meier plots comparing low- and high-risk groups for overall survival in the whole cohort (A), training cohort (B), and validation cohort (C). OS: overall survival. Patient Characteristics in ACT and Control Cohorts for Each Risk Group After PSM. ACT: adjuvant chemotherapy; USDW: unmarried/separated/divorced/widowed; SCC: squamous cell carcinoma. P value <.05 was considered to be statistically significant. Kaplan–Meier plots comparing overall survival in control and ACT cohorts (after PSM) for low-risk (A) and high-risk groups (B). PSM: propensity score matching; OS: overall survival; ACT: adjuvant chemotherapy.


Discussion
Our study aimed to develop a stratified nomogram to predict the OS of patients with resected T1-2N0-1M0 NSCLC on an individual basis. The nomogram demonstrated promising results in identifying optimal candidates for ACT among patients with stage IB or IIA NSCLC, which has significant implications for the field of precision medicine in NSCLC.
In our study, we identified several independent prognostic factors for OS in patients with T1-2N0-1M0 NSCLC. Multivariate Cox regression analysis revealed that increasing age, male sex, USDW marital status, higher tumor grade, SCC histology, advanced T stage, N1, larger tumor size, fewer removed lymph nodes, and segmentectomy surgical type were associated with a worse prognosis for OS. These findings highlight the importance of considering these factors in the prognostic assessment and treatment decision-making for NSCLC patients.
For patients diagnosed with resectable T1-2N0-1M0 NSCLC, surgical resection is considered the standard treatment with the highest chance of cure. However, post-surgical prognosis can vary significantly, even among patients with the same TNM stage. The primary causes of death in these patients are distant postoperative metastases or local recurrence. Numerous studies have confirmed the survival benefits of ACT in various subgroups of NSCLC patients, including those at early stages such as stage IB.6-9,11,30-32 However, it is important to note that not all subgroups of early stage patients derive the same benefits from postoperative chemotherapy.7,9-12 For instance, a study called CALGB 9633 discovered that ACT only improved the survival of patients with T2N0M0 NSCLC when their tumors were larger than 4 cm in size. 33 However, a more recent study published in 2020 revealed that in early stage (node-negative) NSCLC patients, larger tumor size alone did not correlate with better ACT efficacy. 34 Currently, the NCCN guidelines recommend ACT only for stage IB or IIA NSCLC patients with high-risk factors or positive surgical margins. 35 To ensure the most appropriate treatment and follow-up decisions for each patient, clinicians must carefully evaluate their prognosis and potential treatment benefits.
As precision medicine continues to advance, the traditional TNM staging system may no longer fully satisfy the evolving needs of clinical practice. In response, the use of nomograms has gained widespread acceptance as a valuable tool for predicting patient survival. By integrating several independent risk factors into a user-friendly tool, these nomograms offer a more accurate prognostic assessment and aid in treatment decision-making.20-25,36 To address the growing demand for improved prognostic assessment and treatment selection, we have developed a stratified nomogram specifically designed to predict the prognosis of patients with T1-2N0-1M0 NSCLC. This nomogram was developed based on a comprehensive dataset of 14 798 real-world cases, providing robust and reliable results. By incorporating multiple independent prognostic factors, our nomogram effectively generates risk scores that can successfully stratify patients into low- and high-risk groups. This stratification enables clinicians to identify suitable candidates for ACT with a remarkable level of accuracy and discrimination.
Consistent with previous research, our study identified several independent prognostic factors for postoperative NSCLC, including age, sex, marital status, T stage, N stage, tumor size, tumor grade, histological type, the number of lymph nodes resected, and surgical type.21,37-40 Notably, our study found that patients with ≥4 resected lymph nodes, SCC histology, and USDW marital status had a poorer prognosis. Chemotherapy and radiotherapy were not included as prognostic factors in our nomogram, as it was designed to guide treatment decisions before initiating therapy. Instead, all independent prognostic factors were integrated into the nomogram, which stratified patients into 2 risk groups. We observed a significant difference in survival between the two risk groups, with high-risk patients being potential candidates for ACT therapy among those with stage IB or IIA NSCLC. The higher risk of recurrence and metastasis in the high-risk group may explain the potential benefit of chemotherapy in these patients. Physicians can use our nomogram in conjunction with the AJCC staging system and other risk factors to make optimal treatment decisions for their patients in clinical practice.
Our study introduces several notable innovations and contributions to scientific knowledge and clinical practice in the field of early stage NSCLC prognostic modeling. First, we conducted extensive research involving a substantial number of real patients, enhancing the reliability and validity of our findings. This comprehensive approach strengthens the impact and generalizability of our results. Second, we have developed the first prognostic nomogram specifically tailored for T1-2N0-1M0 NSCLC patients. This novel nomogram effectively categorizes patients into two distinct risk groups, empowering clinicians to make more informed decisions regarding patient management. To ensure rigorous analysis, we employed PSM methodology to mitigate potential selection biases between the ACT and control cohorts in both risk groups. This rigorous approach enhances the accuracy and reliability of our comparative analysis. Importantly, our study yielded compelling results. Among stage IB or IIA NSCLC patients, we observed a significant improvement in OS with ACT in the high-risk group. Notably, this intervention led to a remarkable 16.4% absolute increase in 5-year OS, underscoring the clinical significance and potential benefits of our findings.
While several previous studies have developed useful prognostic nomograms for resectable NSCLC patients, our study stands out in several ways,21,32,37,38,40-44 the level of contribution of our nomogram to scientific knowledge and practice is novel. Unlike these previous studies, our nomogram was specifically developed for T1-2N0-1M0 resected NSCLC patients and guides ACT specifically for stage IB or IIA patients. Additionally, our study is based on a large sample of 17 023 patients, further enhancing the robustness and generalizability of our findings. The implications of our findings have important ramifications for clinical practice, particularly in guiding treatment decisions and identifying candidates who are likely to benefit from ACT.
Validation of the prognostic nomogram is a critical step to assess its accuracy and discrimination ability. The calibration curves demonstrated good agreement between predicted and observed values for 1-, 3-, and 5-year survival in both the training and validation cohorts, indicating the reliability of the nomogram. Moreover, the nomogram exhibited superior discrimination performance compared to the conventional staging system, as evidenced by larger AUC values in the ROC curves. This enhanced ability to differentiate patients with different outcomes is of significant clinical relevance. Additionally, the risk scoring system derived from the nomogram effectively stratified patients based on various clinicopathological factors, as depicted by the distinct distribution of risk scores. These validation findings solidify the reliability and effectiveness of our prognostic nomogram, making it a valuable tool for clinical decision-making.
As far as we know, this is the first nomogram developed to specifically predict OS in patients with T1-2N0-1M0 resected NSCLC, based on a large database with long-term follow-up. This nomogram offers clinicians a readily accessible tool for individualized survival predictions in postoperative NSCLC patients. Moreover, it holds potential for assisting physicians in identifying suitable candidates for ACT among stage IB or IIA NSCLC patients. However, we acknowledge several limitations in our study. First, its retrospective nature restricts the establishment of causal relationships. Second, despite employing PSM to minimize biases, certain confounders may still be present. Future investigations should explore the influence of socioeconomic status and unique social interactions in the US society on the prognostic value of the demographic factors included in our study. Thirdly, the unavailability of crucial variables in the SEER database, such as detailed patient treatment information, vascular and perineural invasion status, surgical margin status, and biomarkers like PDL-1, EGFR, ALK, and ROS1 status, may have impacted our results. Lastly, validation of our nomogram in other centers and databases, such as the International Association for the Study of Lung Cancer (IASLC) database, is imperative to confirm its generalizability.
Conclusions
We have developed a stratified nomogram that predicts the OS of patients with resected T1-2N0-1M0 NSCLC individually. By utilizing our model, physicians can identify optimal candidates who may benefit from ACT among patients with stage IB or IIA NSCLC. Our nomogram is expected to promote the development of precision medicine for NSCLC.
Footnotes
Declaration of Conflicting Interests
The author(s) declared no potential conflicts of interest with respect to the research, authorship, and/or publication of this article.
Funding
The author(s) received no financial support for the research, authorship, and/or publication of this article.