
Abstract
It has been repeatedly demonstrated that economic affluence is one of the main predictors of the scientific wealth of nations. Yet, the link is not as straightforward as is often presented. First, only a limited set of relatively affluent countries is usually studied. Second, there are differences between equally rich countries in their scientific success. The main aim of the present study is to find out which factors can enhance or suppress the effect of the economic wealth of countries on their scientific success, as measured by the High Quality Science Index (HQSI). The HQSI is a composite indicator of scientific wealth, which in equal parts considers the mean citation rate per paper and the percentage of papers that have reached the top 1% of citations in the Essential Science Indicators (ESI; Clarivate Analytics) database during the 11-year period from 2008 to 2018. Our results show that a high position in the ranking of countries on the HQSI can be achieved not only by increasing the number of high-quality papers but also by reducing the number of papers that are able to pass ESI thresholds but are of lower quality. The HQSI was positively and significantly correlated with the countries’ economic indicators (as measured by gross national income and Research and Development expenditure as a percentage from GDP), but these correlations became insignificant when other societal factors were controlled for. Overall, our findings indicate that it is small and well-governed countries with a long-standing democratic past that seem to be more efficient in translating economic wealth into high-quality science.
It has been repeatedly argued that only rich countries have enough resources to produce scientific results of the highest quality. Two very prominent papers (King, 2004; May, 1997) showed that the quality of scientific publications published by scientists of a nation during a certain period can be estimated by the mean number of citations for these papers. Just as gross domestic product (GDP) is a measure of economic wealth, the mean citation rate per scientific article could be used as a measure of the scientific wealth of nations (King, 2004; May, 1997). The link between economic and scientific wealth has been repeatedly demonstrated (Cimini et al., 2014; Cole & Phelan, 1999; Docampo & Bessoule, 2019; Gantman, 2012; Hatemi-J et al., 2016; King, 2004; Kumar et al., 2016; May, 1997; Mueller, 2016; Prathap, 2017; Rousseau & Rousseau, 1998; Vinkler, 2008, 2018), meaning that the richer the country, the more money is invested into research and development (R&D) activities, which, in return, is expected to increase the quality of scientific publications.
Yet, the relationship between economic and scientific wealth is not as simple and straightforward as is often presented. First, only a limited set of relatively affluent countries is usually studied. For example, King (2004) analyzed 31 countries, which were mostly economically highly developed nations. Thus, it is still an open question whether the economic wealth of countries can be transformed into high-quality scientific publications equally well in more as well as less affluent countries. Second, there appear to be differences between equally rich countries in their scientific success. In other words, it has been shown that nations differ considerably in terms of their efficiency in turning economic wealth into high-level and highly cited scientific publications (Leydesdorff & Wagner, 2009b). This implies that some additional factors may exist that control how the economic prosperity of countries is transformed into notable scientific discoveries reported in prominent scientific publications. Consequently, the main aim of the present study is to identify the factors that can effectively enhance or suppress the effect of the economic wealth of countries on their scientific success. Differently from some previous studies (e.g., King, 2004), we will employ a large sample of countries with varying levels of economic development.
Predictors of the Scientific Wealth of Nations
Earlier research has shed some light on the factors that may help in predicting the scientific wealth of nations, beyond economic development. For instance, it has been shown that researchers from affluent countries who do not speak English as their mother tongue are at a disadvantage compared with their colleagues from English-speaking countries in producing scientific papers of the highest quality (Gantman, 2012; van Leeuwen et al., 2001). It has also been noticed that development of the national publication market (Mueller, 2016) and policies that are directed toward supporting scientific excellence (Almeida et al., 2009; Moed, 2005; van Leeuwen & Moed, 2012) can affect the quality of scientific publications. Quite expectedly, higher levels of international collaboration and scientific mobility stimulate the quality of the scientific output of nations (Leydesdorff et al., 2014; Wagner & Jonkers, 2017; Wagner & Leydesdorff, 2005). A good example of this is the fact that, even three decades after the collapse of the Soviet Union, most postcommunist countries are still lagging behind their Western counterparts (Jurajda et al., 2017; Kozak et al., 2015; Must, 2006; Pajic, 2015; Vinkler, 2008). Although there might be multiple reasons for this effect, one of the most obvious explanations is that this is a direct consequence of international isolation and restrictions on the free movement of ideas and people during the communist years (cf. Leydesdorff et al., 2014; Wagner & Jonkers, 2017; Wagner & Leydesdorff, 2005). Finally, it has been proposed that a government’s degree of respect for the civil and political liberties of its citizens has a positive effect on the country’s output of scientific knowledge (Gantman, 2012). When using the Worldwide Governance Indicators (WGI), which measure countries’ levels of corruption and government effectiveness, Gantman (2012) was able to show that poor governance in the form of political authoritarianism has a negative and statistically significant effect on the quality of scientific output, not only in the social sciences but also in the neurosciences, medicine, and agricultural and biological sciences (Gantman, 2012). Although the WGI has been criticized for the lack of a clear theoretical foundation (e.g., Andrews, 2008; Andrews et al., 2010; Erkkilä & Piironen, 2014; Gisselquist, 2014), it has successfully predicted sustainable economic growth (Adkisson & McFerrin, 2014; Güney, 2017; Law et al., 2013), openness in international trade (Al-Marhubi, 2005), a diminishing number of road traffic fatalities (Gaygisiz, 2010), and reduced Olympic success due to lower rates of doping use among the athletes in less corrupt countries (Potts, 2014).
How to Measure Scientific Excellence?
Although the mean citation rate per paper is a handy measure of a nation’s scientific wealth (cf. King, 2004; May, 1997), it covers only one aspect of scientific success, which has been shown to be a multidimensional concept (Aksnes et al., 2019). So, to achieve our main aim, the question of how best to measure the scientific excellence or success of countries must be answered first. As was noticed by van Leeuwen and colleagues (2003), [e]valuation studies of scientific performance conducted during the past years more and more focus on the identification of research of the ‘highest quality’, ‘top’ research, or ‘scientific excellence’. This shift in focus has led to the development of new bibliometric methodologies and indicators. Technically, it meant a shift from bibliometric impact scores based on average values such as the average impact of all papers published by some unit to be evaluated towards indicators reflecting the top of the citation distribution, such as the number of ‘highly cited’ or ‘top’ articles. (p. 257)
Although high citation percentiles can be considered as an alternative to mean-based bibliometric indicators (Bornmann et al., 2013; Waltman & Schreiber, 2013), their combined use may have some advantages.
For the reasons above, we use a composite indicator of scientific wealth in our study—the High Quality Science Index (HQSI; Allik, 2013)—which, in equal parts, considers the mean citation rate per paper and the percentage of papers that have reached the top 1% of citations in a respective field of science and the time of publication as indicated by the Essential Science Indicators (ESI; Clarivate Analytics) database. Even though the use of multicomponent bibliometric indicators to measure the scientific success of countries is well documented (Levitt & Thelwall, 2011; van Leeuwen et al., 2003; Xu et al., 2013), a recent study showed that the use of the HQSI may still result in somewhat odd or unexpected rankings of scientific success, with countries such as Singapore, the Republic of Georgia, and Peru topping the list of the world’s most scientifically advanced countries (Lauk & Allik, 2018). This may suggest that multicomponent bibliometric indicators such as the HQSI may need some adjustment.
One possible way to improve the HQSI would be to include information about published papers that are never cited. Although it was suggested some time ago that nearly 48% of all papers published in journals indexed by the Web of Science (WoS) were never—not even once—cited (Garfield, 2005), other researchers have argued that the proportion of uncited papers ranges from 10% (Van Noorden, 2017) to 25% (Nicolaisen & Frandsen, 2019). If we believe that the mean number of citations received in a particular period of time by papers published by researchers of a nation is a valid measure of the country’s scientific excellence (King, 2004; May, 1997), it would be logical to assume that the greater the scientific wealth of a country, the smaller the proportion of papers that nobody ever cites. In other words, in countries with lower levels of scientific wealth, researchers should be more likely to produce papers that will never be cited by anyone, not even by the authors themselves (cf. Nicolaisen & Frandsen, 2019). Regrettably, existing databases such as the WoS and the ESI do not usually provide explicit statistics on uncited papers.
Another problem largely ignored by previous research is that, not only papers that have exceeded the entrance thresholds for the ESI database, but also those that were below the threshold, can affect the mean citation rate (cf. Hu et al., 2018). As explained above, the ESI is an analytical tool that helps to identify top-performing research in the WoS Core Collection. Consequently, a high position in the ranking of countries on the HQSI can be achieved not only by increasing the number of high-quality papers but also by reducing the number of papers that are able to pass ESI thresholds but could potentially lower the country’s overall scientific impact. For example, the country’s HQSI ranking position can be improved by diverting publications to low-impact journals, which have no or very little chance to qualify for the ESI. Thus, in addition to an analysis of the most highly cited scientific papers that are included in the ESI, one should also analyze papers that are left out. One way to do this is to calculate a ratio between the numbers of papers included by the ESI and the total number of papers each country was able to submit to the WoS.
The Aims of the Present Study
In sum, even though it is a well-established finding that greater economic wealth of countries leads to greater scientific excellence, there are good reasons to believe that the link between the two factors is not strictly deterministic. The main aim of our article is thus to provide a deeper understanding of how and under what conditions the link between economic and scientific wealth varies across countries, especially when a large sample of countries with different levels of economic development is included in the analysis. Our choice of potential contextual drivers that may influence the relationship between the economic wealth and scientific excellence of countries was primarily guided by the findings of previous research, as reviewed in the introduction. More specifically, we hypothesized that, in addition to economic wealth, as measured by gross national income (GNI) and R&D expenditure, a country should have (a) high levels of good governance implementation and human development, including (b) high life expectancy and (c) high levels of educational attainment to achieve scientific excellence. Based on previous research, which has repeatedly shown the detrimental effect of income inequality on educational attainment and other societal outcomes (see Bapuji, 2015, for a review), we also included (d) a measure of inequality in our analyses. Last, we controlled for (e) population size, as is usually done in analyzing the scientific wealth of nations (May, 1997), (f) whether English is an official language of the country, and (g) for the country’s communist history (past or present).
Before proceeding to the main analyses, further steps were taken to understand how the main variable of interest, the HQSI, works and why some country rankings based on their scientific impact may look unusual (Lauk & Allik, 2018). One potential way to improve the HQSI is to calculate the percentage of papers that was left out of the ESI and the percentage of uncited papers that each country has among papers indexed in the WoS.
Method
Main Variables
Scientific excellence
Data for measuring the scientific success of countries were retrieved from the latest available release of the ESI (Clarivate Analytics, updated on March 14, 2019; https://clarivate.com/products/essential-science-indicators/), which covers an 11-year period from January 1, 2008, until December 31, 2018. For this period, the ESI covers approximately 12,000 journals from around the world with more than 12 million articles indexed by the WoS (Clarivate Analytics; https://clarivate.com/products/web-of-science/) database, which are, in the ESI, divided into 22 fields of science, including multidisciplinary journals but excluding arts and humanities.
To be included in the ESI, journals, papers, institutions, and authors need to exceed a minimum number of citations obtained by ranking journals, researchers, and papers in a respective research field in descending order by citation count and then selecting the top fraction or percentage of papers. For authors and institutions, the threshold is set as the top 1%, and the top 50% is established for countries and journals, in the 11-year period. The main purpose of dividing publications into fields is to balance different research intensities in different research areas. For example, in mathematics and computer sciences, it was enough for the top 1% of researchers to collect 346 and 382, respectively, whereas in physics, the top 1% threshold was nearly 30 times higher, at 10,253 citations.
Among the 153 countries/territories that passed the ESI threshold at least in one research field were several that did so with a small number of papers. For example, researchers from Dominica, the Vatican, Bermuda, and the Seychelles published less than 300 papers during the last 11 years that were included in the ESI. Because small numbers tend not to be reliable, all countries that had less than 4,000 papers included in the ESI were excluded from further analysis (cf. Allik, 2003, 2008, 2013, 2015; Lauk & Allik, 2018). 1 Applying this criterion, 53 countries or territories (36.6%) were left out of further analysis and the final sample consisted of 97 countries. 2
The HQSI (Allik, 2013) was computed by combining the mean citation rate and the percentage of articles that reached the top 1% citation rate. Combining these two indicators into one index is justified, because the mean citation rate and the percentage of the top 1% papers are statistically significantly correlated at r = .82 (N = 153, p < .001). The HQSI was expressed in standard normal units, for which the mean citation rate and the percentage of top papers were converted into z units and, after that, averaged.
Economic wealth
The economic wealth of nations was measured by GNI per capita (Human Development Index [HDI], 2018). GNI is seen as a superior variable to GDP, in which the wages, salaries, and property income of a country’s residents earned abroad are not taken into account. Because HDI is not computed for Macau and Taiwan, we used other available estimates for these two territories.
R&D expenditure
The latest available data for research and development expenditure as a percentage of GDP (GERD) were obtained from the World Bank: https://data.worldbank.org/indicator/gb.xpd.rsdv.gd.zs. Missing data for Taiwan, South Korea, Malawi, Lebanon, Bangladesh, and Cameroon were filled by most likely estimates, usually provided by these countries themselves.
Contextual Measures
Quality of governance
The WGI is a measure of quality of governance, which is how authority in a country is exercised; how governments are selected, monitored, and replaced; the capacity of the government to effectively formulate and implement sound policies; and the respect of citizens and the state for the institutions that govern economic and social interactions among them (https://info.worldbank.org/governance/wgi; Kaufmann et al., 2010). The summary index is computed based on six indicators of good governance: voice and accountability, absence of violence, government effectiveness, regulatory quality, rule of law, and absence of corruption. Because some of these indicators were correlated above r = .96 in our sample, we only used their aggregate score in our analyses to avoid multicollinearity (cf. Langbein & Knack, 2010). Cronbach’s alpha of the WGI in our sample 97 countries was .96.
Life expectancy
Life expectancy at birth is a health dimension of the HDI (2018). The data were retrieved from the United Nations Development Programme update (http://hdr.undp.org/en/2018-update) for 2018.
Education
The education dimension of HDI was measured by the mean of years of schooling for adults aged 25 years and more and expected years of schooling for children of school-entering age (HDI, 2018). The same source was used as in the previous item.
Inequality (Gini)
The Gini coefficient is the most commonly used measure of economic inequality. A Gini coefficient of 0 expresses perfect equality, where all incomes are the same. A Gini coefficient of 1 expresses theoretical maximal inequality where only one person has all the income or consumption, and all others have none. We obtained the most recent Gini index estimates from the World Bank (https://data.worldbank.org/indicator/si.pov.gini).
Country population size
Population size by country was retrieved from the United Nations Population Division database: https://www.worldometers.info/world-population/population-by-country/. Because differences in populations are huge, the common logarithm with a base of 10 was used to represent the data.
English as official language
Data about countries where English is an official language (either de jure or de facto) were taken from http://worldpopulationreview.com/countries/english-speaking-countries/. The countries with English as an official language were coded as 1 and the rest as 0.
Communist history (past or present)
In addition to former Soviet Republics and Eastern European members of the Warsaw Pact, China, Cuba, and Vietnam were also coded as countries with a communist past or presence (1).
Results
The HQSI Rankings
Table 1 presents the list of the 97 countries, which published more than 4,000 ESI documents in the period 2008 to 2018. Each country or territory is characterized by the five bibliometric (Columns 4–8) and nine contextual (Columns 9–17) indicators described in the “Method” section. Listed countries were ranked according to the HQSI (Column 8), with countries at the top of the ranking having the highest, and the countries at the bottom of the list the lowest, levels of scientific excellence.
The 97 Countries That Published More Than 4,000 ESI Papers Between 2008 and 2018 Ranked According to the HQSI (Column 8).
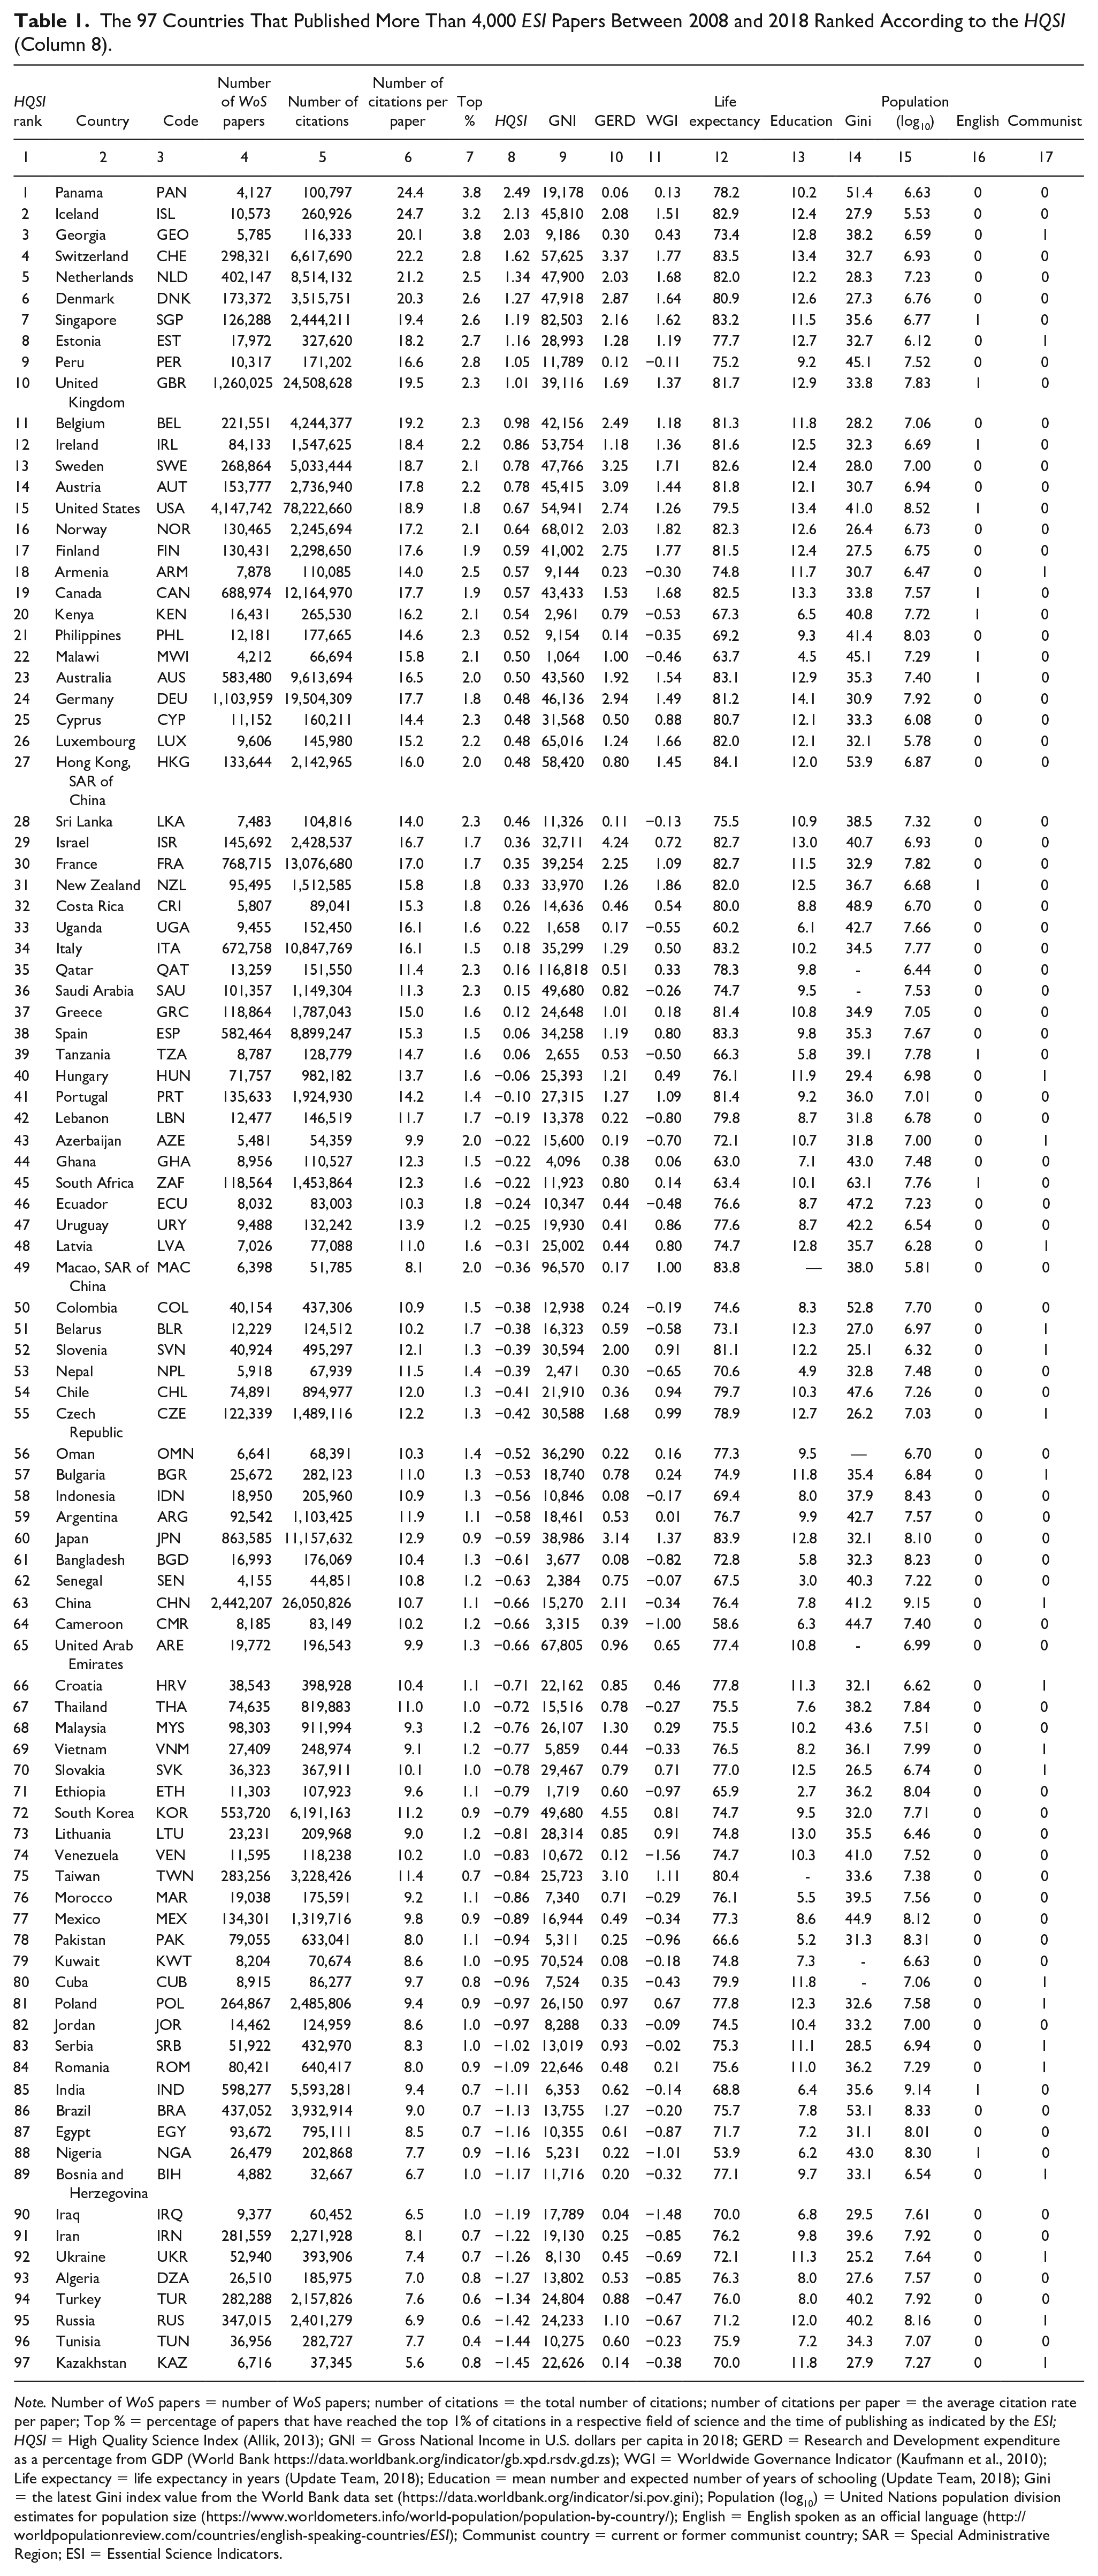
Note. Number of WoS papers = number of WoS papers; number of citations = the total number of citations; number of citations per paper = the average citation rate per paper; Top % = percentage of papers that have reached the top 1% of citations in a respective field of science and the time of publishing as indicated by the ESI; HQSI = High Quality Science Index (Allik, 2013); GNI = Gross National Income in U.S. dollars per capita in 2018; GERD = Research and Development expenditure as a percentage from GDP (World Bank https://data.worldbank.org/indicator/gb.xpd.rsdv.gd.zs); WGI = Worldwide Governance Indicator (Kaufmann et al., 2010); Life expectancy = life expectancy in years (Update Team, 2018); Education = mean number and expected number of years of schooling (Update Team, 2018); Gini = the latest Gini index value from the World Bank data set (https://data.worldbank.org/indicator/si.pov.gini); Population (log10) = United Nations population division estimates for population size (https://www.worldometers.info/world-population/population-by-country/); English = English spoken as an official language (http://worldpopulationreview.com/countries/english-speaking-countries/ESI); Communist country = current or former communist country; SAR = Special Administrative Region; ESI = Essential Science Indicators.
Like another recent study (cf. Erfanmanesh et al., 2017, Figure 1C), we identified Panama as the country with the highest HQSI score. In an earlier observation period (Lauk & Allik, 2018), Panama was just below the 4,000 publication threshold, missing the final list. It was also unexpected to see two rather small former Soviet countries—the Republic of Georgia and Estonia—in the top 10, whereas scientific giants such as the United States, Germany, and France are ranked 15th, 24th, and 30th, respectively, on the HQSI list. 3
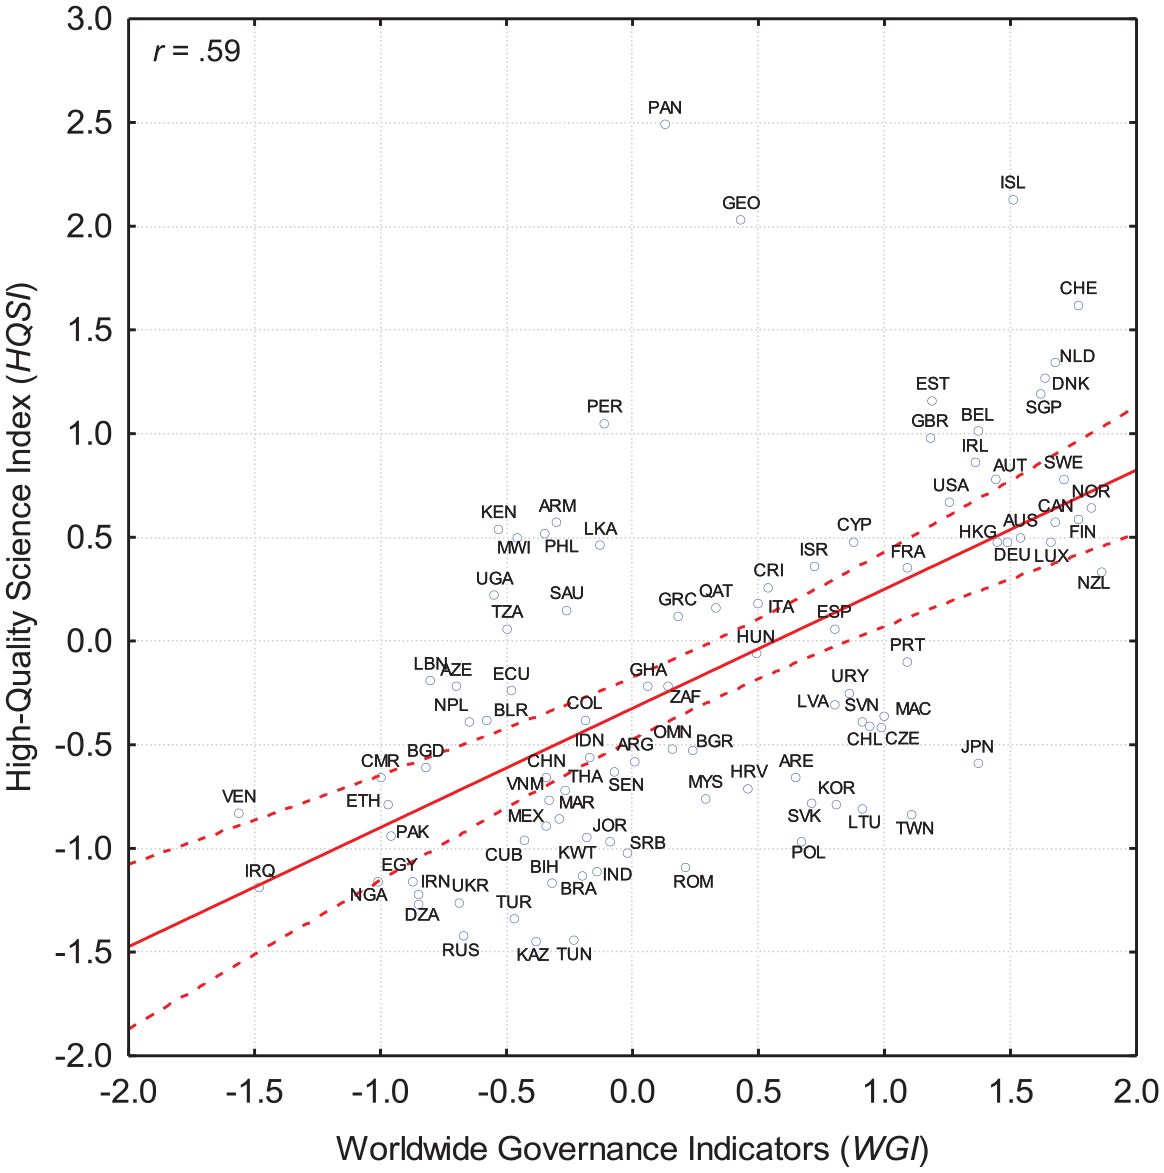
Correlation plot between the Worldwide Governance Indicators (WGI) and the High Quality Science Index (HQSI): r = .59, N = 97, p < .001.
How does it come about that countries that are never thought to be among the leaders in world science are nevertheless at the top of the HQSI ranking? To answer this question, we examined different ways a country’s ranking on the HQSI can potentially be improved. The first obvious option is to publish research papers that will be highly cited in as many fields of science as possible. This is exactly how it seems to work in six of the top 10 HQSI countries—Iceland, Switzerland, the Netherlands, Denmark, Singapore, and Estonia—which passed the entrance threshold in all 22 fields into which the ESI divides sciences.
Second, a country’s HQSI ranking position can be improved by publishing a relatively small number of papers in a few selected fields and by not publishing papers that would pass the ESI threshold in those areas in which the quality of papers is mediocre. As an example, Panama exceeded the ESI entrance threshold in 13 fields, Georgia in 11, Kenya in 16, Uganda in 14, Latvia in 16, and Armenia only in seven research fields out of 22. All mentioned nations appear to occupy a higher position in the science quality ranking than could be expected from other societal indicators and the quality of research in areas, which did not qualify for the ESI.
It can also be observed that research areas in which these apparent overachievers have been most successful rely on large-scale international collaborations and/or joint publications with more scientifically advanced countries. For example, it is typically the case that highly cited Panamanian papers were written in collaboration with large international partners from the United States, Germany, United Kingdom, or Canada (Monge-Najera & Ho, 2015). The most cited article by researchers from Panama—which has already collected more than 5,500 citations—is a product of a large-scale international project (Global Burden of Disease Study) that has 189 coauthors from 119 institutions from all over the world (Lozano et al., 2012). The first five most cited Panamanian papers were produced by this project, and these account for more than 15% of the country’s total number of citations. Among the most cited papers, there were no papers authored exclusively by Panamanian researchers.
Clarivate Analytics recently published a list of the top 6,000 highly cited researchers in 2018 (https://hcr.clarivate.com/). It is symptomatic that Panama contributed to this list only one researcher, Georgia none, and Peru two. Other countries in the top 10 of the HQSI were more productive in terms of reaching the list of highly cited researchers: Iceland had 14, Switzerland 148, the Netherlands 198, Denmark 77, Singapore 80, Estonia 16, and the United Kingdom 588. Thus, this is another demonstration that some countries were able to reach the top without producing too many highly cited researchers of their own.
The Republic of Georgia’s high ranking on the HQSI also seems to owe much to international collaboration. From the 5,785 papers coauthored by Georgia’s researchers that passed ESI thresholds, almost half (2,248) were published by physicists. Two hundred eighteen of Georgia’s papers reached the top 1% of citations, of which 145 (66.5%) were coauthored by physicists, or more precisely by groups collaborating in the ATLAS and other CERN projects. For example, two researchers, Drs. Tamar Djobava and Maia Mosidze from the High Energy Physics Institute in Tbilisi, each coauthored more than 700 papers over the 11-year period and these were cited more than 29,000 times, which is about 25% of all the citations that papers authored by Georgian researchers received.
Can the HQSI Be Improved?
The HQSI, as we show above, may need some modification to be a more valid measure of scientific excellence. One way to improve the index would be to consider the percentage of papers indexed in the WoS per country that are included in the ESI. With this goal in mind, we computed the total number of papers indexed in the WoS (the Core Collection except the Arts and Humanities Citation Index) for the 11-year period from 2008 to 2018. Knowing the number of papers published in the journals that were indexed in the WoS, we computed the percentage of papers that qualified for the ESI. The median percentage over the 97 countries was about 61%, with (Russia) 4 having the highest percentage at 76.4%. There were four countries—Indonesia, Azerbaijan, Lebanon, and Latvia—which had less than 40% of all their published papers included in the ESI. Among the top 10 HQSI countries, Iceland published 15,432 papers that were indexed in WoS, from which 10,537 or 68.5% qualified for the ESI. Most of the other top 10 countries performed similarly well (e.g., Switzerland, 66.1%; the Netherlands, 66.0%; Denmark, 66.9%; Singapore, 65.3%; Estonia, 66.7%), with only Panama (57.5%) and Peru (54.7%) having slightly lower success rates in entering the ESI.
However, when we computed the correlation between the percentage of papers indexed in the WoS that were also included in the ESI and the HQSI across the 97 countries, it was insignificant, r = .08, N = 97, p = .418. Thus, there was no justification for supplementing the HQSI with this third additional component, which essentially characterizes the rate of success to be qualified for the high-quality science. There seem to be multiple reasons for how many papers enter the ESI from the total number of publications in WoS, and not all of them show a country’s scientific weaknesses or strengths.
We also explored the possibility that the number of papers that are never cited could be used as a correction for the HQSI. Because it is very difficult to see how papers that were never cited can contribute to the growth of scientific knowledge (cf. Nicolaisen & Frandsen, 2019), it may be used as an additional indicator of quality. Although, even if a paper remains uncited for a long period, this is not necessarily a sign of its poor quality (Garfield, 1991). However, if two countries differ substantially in the percentage of their uncited papers, then it may indicate that these two countries have different levels of scientific performance. For instance, both Georgia and Peru were characterized by a relatively high percentage of papers (38.9% and 43.5%, respectively) indexed in the WoS from 2008 to 2018 that have never been cited. In contrast, Panama (22.5%), Iceland (28.6%), and Estonia (28.5%) had a considerably lower percentage of uncited papers. One possible reason for the different uncitedness rates may be the number of local journals, which typically have lower impact factors (cf. van Leeuwen et al., 2001). Yet, without a thorough analysis, it is difficult to say whether uncitedness statistics can be used for improvement in bibliometric indicators.
Predictors of Scientific Excellence
As we predicted, the HQSI had positive and statistically significant correlations with both GNI (r = .36) and GERD (r = .35), p < .001. To test the question of whether national wealth is equally important for producing high-quality science in both more and less economically advanced nations, we computed correlations between the GNI and the HQSI separately for countries in which GNI was below or above the median value US$22,162 for the current sample of 97 countries. In accordance with previous research (e.g., King, 2004), the correlation between the GNI and the HQSI was statistically significant in the group of more affluent countries (r = .33, n = 49, p = .022), but not in the group of lower income countries (r = .00, n = 48, p = .988). Thus, the economic wealth of countries seems to play a role in supporting scientific excellence only in those countries, which are sufficiently wealthy.
In addition to economic indicators, the HQSI was also significantly correlated with almost all other societal variables in our analysis, except for the Gini index (please see the last two columns in Table 2). As expected, countries with higher levels of education (r = .41) and life expectancy (r = .38) also tend to have higher levels of scientific success (both correlations significant at p < .001). However, the strongest correlation we observed was between the HQSI and the good governance indicators (WGIs, r = .59, p < .001). Figure 1 demonstrates the scatter plot between the WGIs and the HQSI across the 97 countries. Three countries in the top 10 of the HQSI by scientific achievement—Panama, Georgia, and Peru—seem to be overperforming in terms of their scientific success compared with the quality of governance that these countries demonstrate. If we exclude the three countries from the analysis, the correlation increases from r = .59 to r = .64, N = 94, p < .001. Thus, quality of governance appears to have a strong effect on the quality of science.
The Results of the GLM Analysis When Predicting the HQSI From the Contextual Variables, R = .70, R2 = .49, F(9, 79) = 8.36, p < .001.
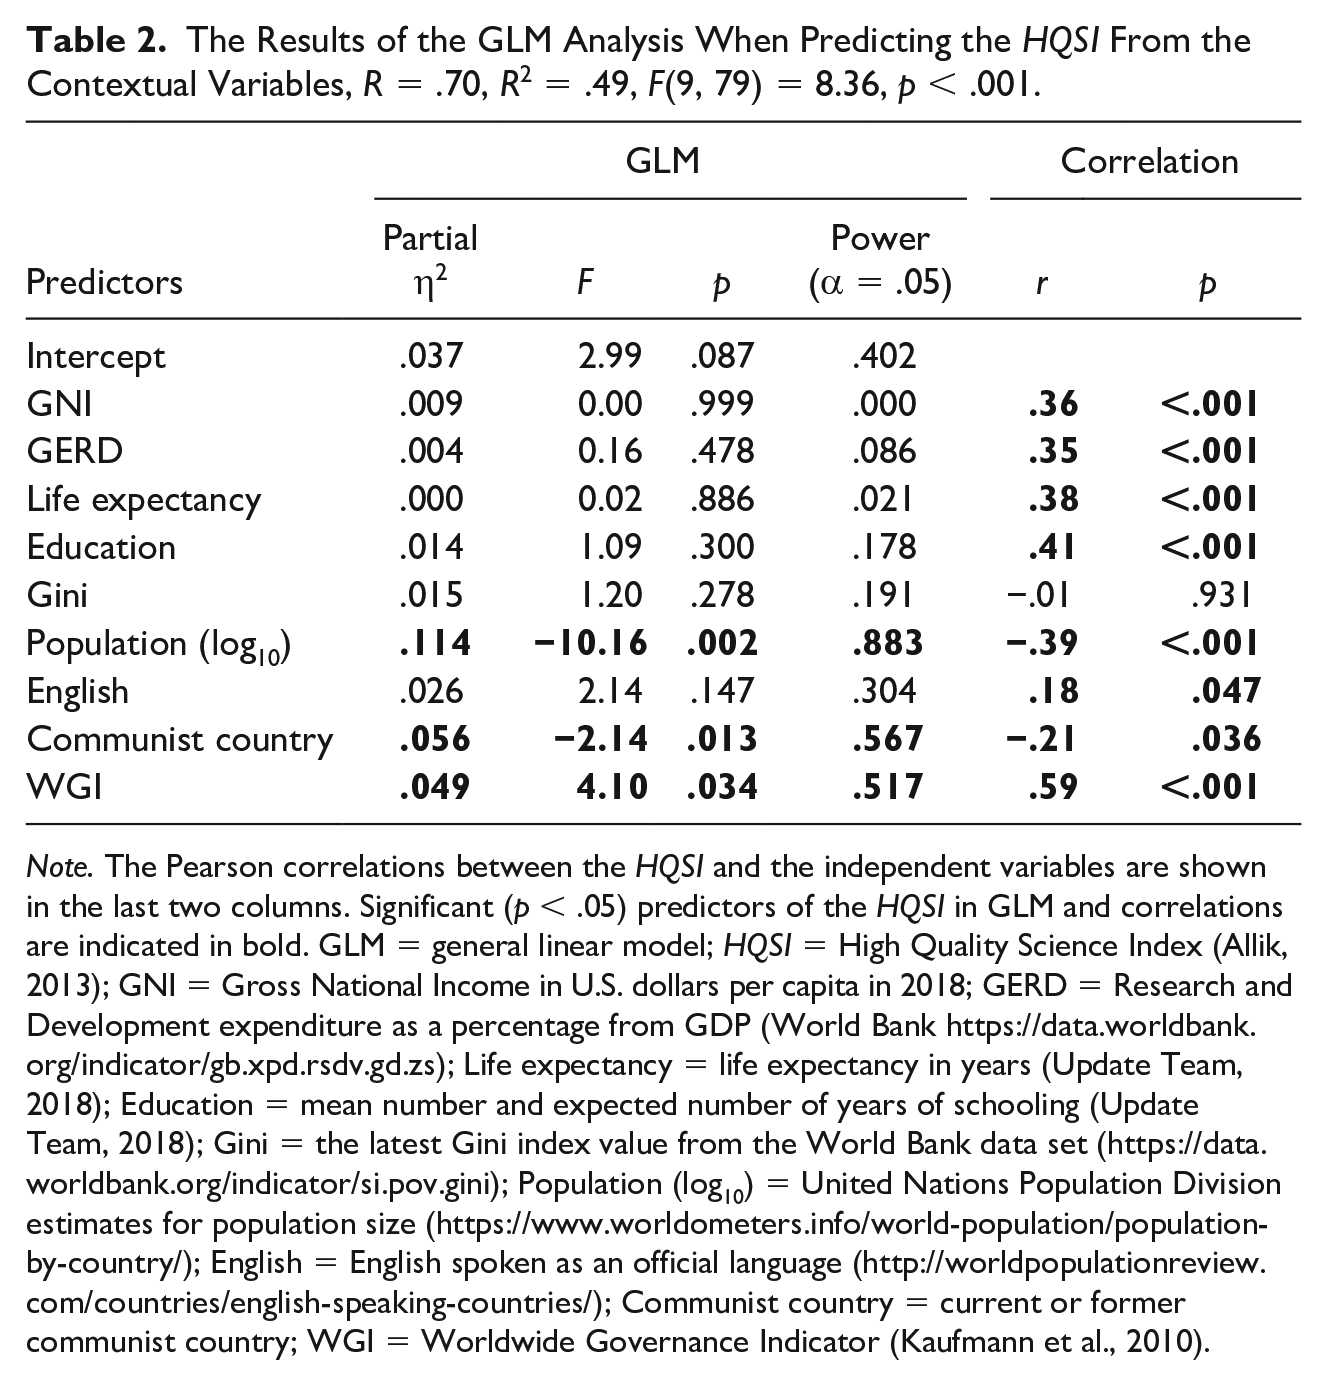
Note. The Pearson correlations between the HQSI and the independent variables are shown in the last two columns. Significant (p < .05) predictors of the HQSI in GLM and correlations are indicated in bold. GLM = general linear model; HQSI = High Quality Science Index (Allik, 2013); GNI = Gross National Income in U.S. dollars per capita in 2018; GERD = Research and Development expenditure as a percentage from GDP (World Bank https://data.worldbank.org/indicator/gb.xpd.rsdv.gd.zs); Life expectancy = life expectancy in years (Update Team, 2018); Education = mean number and expected number of years of schooling (Update Team, 2018); Gini = the latest Gini index value from the World Bank data set (https://data.worldbank.org/indicator/si.pov.gini); Population (log10) = United Nations Population Division estimates for population size (https://www.worldometers.info/world-population/population-by-country/); English = English spoken as an official language (http://worldpopulationreview.com/countries/english-speaking-countries/); Communist country = current or former communist country; WGI = Worldwide Governance Indicator (Kaufmann et al., 2010).
Interestingly, it is smaller countries that tend to publish more highly cited papers, rather than those with larger populations, r = −.39, N = 97, p < .001. Except for Peru (32 million inhabitants), the United Kingdom (66 million), and the Netherlands (17.1 million), all other countries in the top 10 of the HQSI have relatively small populations: Panama 4.1, Georgia, 3.7, Switzerland 8.4, Denmark 5.7, Singapore 5.6, and Estonia 1.3 million inhabitants, to say nothing about Iceland with a population just slightly above 0.3 million. Thus, countries with smaller populations seem to have a competitive advantage over larger ones in producing high-quality scientific publications.
Finally, we also found statistically significant correlations between the HQSI and the country’s language and political past. Namely, it is English-speaking countries (r = .18, p = .047) and countries with no communist past or presence (r = −.21, p = .036) that seem to produce scientific papers of the highest quality.
Predictors of Scientific Excellence Beyond Economic Wealth
Finally, we were interested to find out whether other societal factors can enhance or suppress the effect of economic wealth of countries on their scientific success, as measured by the HQSI. To this end, we used a general linear model (GLM) analysis to examine the effect of economic wealth (as measured by GNI and GERD) on the HQSI when also controlling for other relevant societal indicators. 5 We used a method in which the sums of squares was invariant to the order in which predictor variables were entered into the model. Table 2 demonstrates that nine societal indicators explain about 50% of the variance in the HQSI: F(9, 79) = 8.36, p < .001.
The results of the GLM analysis indicate that the economic factors (i.e., GNI and GERD) no longer had any significant effect on the scientific excellence of countries when other societal factors were controlled for. Instead, it is the country’s population size (η2 = .11), communist past or presence (η2 = .06), and the quality of governance (η2 = .05) that seem to contribute most to their level of scientific excellence (all significant at p < .05): That is, it is the smaller countries without a communist past or presence and with good governance that appear to be most successful in publishing high-impact scientific papers.
Discussion
Do the HQSI Rankings Make Sense?
Measuring the scientific excellence of countries is not an easy task, not just because it is a multidimensional concept (Aksnes et al., 2019) but also because there is no consensus on what the best performance criteria to assess scientific success are. In this study, we used a composite indicator of scientific wealth—the HQSI—which in equal parts considers the mean citation rate per paper and the percentage of papers that have reached the top 1% of citations in a respective field of science and the time of publishing as indicated by the ESI (Allik, 2013). As in previous research (Lauk & Allik, 2018), the use of the HQSI resulted in somewhat unexpected or counterintuitive rankings of scientific success, with countries such as Panama, Iceland, and Georgia being at the top of the ranking list of the world’s most scientifically successful countries. Although the first reaction is to look for possible statistical flukes, there are also some other recent studies that have shown that at least some of the countries at the top of the HQSI ranking, such as Panama, seem to also have the highest impact in the Elsevier’s Scopus database (Erfanmanesh et al., 2017, Figure 1C). Although it was surprising to see the United States only in 15th position in the HQSI ranking, this is not completely unexpected, as many previous studies have indicated that the United States is about to lose (or has already lost) its dominance in science (Adams, 2018; Leydesdorff et al., 2014; Leydesdorff & Wagner, 2009a). Finding Russia in the 95th position is hardly a surprise because its failure to modernize scientific research has been repeatedly verified by other indicators of scientific excellence (Adams & King, 2010; Markusova et al., 2018; Markusova, Ivanov, et al., 2009; Markusova, Jansz, et al., 2009). Although our findings confirmed earlier research that a communist past may have a long-term detrimental effect on countries’ scientific success (Jurajda et al., 2017; Kozak et al., 2015), this did not prevent Georgia (3), Estonia (8), and Armenia (18) from occupying relatively high positions in the HQSI ranking.
Interestingly, several African countries also ranked quite highly on the HQSI, especially Kenya (20), Malawi (22), and Uganda (33), which one would not predict from their level of economic wealth or when thinking about Africa’s total share (less than 1.5%) in world scientific output (Confraria & Godinho, 2015). Their scientific success seems to be owed more to their participation in large-scale international consortia and networks in a limited number of scientific fields. For example, Kenya entered the ESI in 16, Uganda in 14, and Malawi in only 11 fields of science out of 22. Economically and scientifically advanced countries seem to use African countries as “laboratories” in which ecological, agricultural, and human disasters can be studied in exchange for local collaboration. Not surprisingly, Kenya and Malawi have the same most cited paper, which deals with HIV therapy, and has been cited more than 3,000 times (Cohen et al., 2011). In turn, the most cited paper by Ugandan researchers is the same that helped elevate Panama to the top of the HQSI (Lozano et al., 2012). Thus, the relatively high position of Kenya, Malawi, and Uganda in the HQSI (Table 1) may be due to (a) their participation in large international consortia that produce many highly cited papers (cf. Hirv, 2019) and (b) the absence of scientific papers in some other fields that would decrease their mean citation rate. The true leaders in African science such as South Africa, Egypt, Tunisia, Nigeria, and Algeria (Sooryamoorthy, 2018) foster a wider range of disciplines even if not all of them are necessarily beneficial for the nation’s mean citation rate.
Thus, there are some problems with the HQSI, which were probably inherited from the methodology that the ESI uses. The main idea on which the ESI was founded was to define what essential or excellent science is through an examination of the top citation layer of scientific papers. The proposed HQSI reflects a similar shift from bibliometric impact scores based on average values toward indicators reflecting the top of the citation distribution (van Leeuwen et al., 2003). However, paying selective attention to the top citation layer creates a new problem, which was not entirely foreseen. Although the number of highly cited papers is an appropriate indicator of top science, those papers that were unable to pass the citation thresholds can also affect indicators. It is important to remember that the WoS, from which the ESI makes its selection, covers only a fraction of the world’s top tier international and regional journals whose citation impact is carefully monitored. As a result, the ESI is even more selective than the WoS by choosing the most outstanding research and rejecting papers with a low citation rate from further analysis. An unwanted consequence of such a highly restrictive selection process is that the mean citation rate can also go up by the elimination of weaker papers from the analysis. If we do not consider how many low-impact papers were discarded by the selection process, then we introduce an error, which may artificially boost the HQSI score. Thus, the highly selective process of the ESI has a built-in flaw that allows artificial enhancement of a country’s scientific impact and its standing on the HQSI. One way to achieve this is to support participation in high-profile international projects and provide less support for local projects, the output of which is typically oriented toward obscure local journals having no ambition to fight for a place in the ESI database.
Despite these problems, the mean citation rate combined with the percentage of papers that reach the top citation rate—the HQSI—still seems to be a sufficiently adequate measure of what can be called the scientific wealth of nations, better than the mean citation rate alone (cf. Docampo & Bessoule, 2019; Harzing & Giroud, 2014; Horta, 2018; King, 2004; May, 1997; Rousseau & Rousseau, 1998). Even though it has been argued that the traditional method of counting citations may not be the most accurate or optimal measure of scientific excellence (cf. Aksnes et al., 2019), it is still one of the most practical tools for assessing countries’ scientific wealth, especially because bibliometric indicators are strongly related with other indicators of scientific excellence, such as the number of Nobel Prize awards (Rodriguez-Navarro, 2011), and they are relatively free from bias, from which expert opinions typically suffer (cf. Bornmann, 2011; Cicchetti, 1991; Cole et al., 1981).
Science Is a Collaborative Enterprise
Collaboration and cooperation are often imperative to success in science (Figg et al., 2006; Glänzel & Schubert, 2005; Moed, 2005). Many fundamental problems in modern science cannot be solved without international networks involving many countries and sometimes thousands of collaborators (Adams, 2012). As a sign of international and other forms of collaboration, the average number of authors listed on a paper has surged considerably upward during the last years (Mallapaty, 2018). Although the number of authors per paper has increased in all fields of research, the average number of coauthors in nuclear and particle physics has surged well ahead of other fields, reaching an average of 140 authors per paper (Mallapaty, 2018). In 2015, a team of physicists working at the Large Hadron Collider published a paper with 5,154 authors, which broke the existing record for the largest number of contributors to a single research article (Castelvecchi, 2018). Because the same team was also very prolific, publishing almost 100 papers every year over a decade, the threshold for a physicist to enter the club of the top 1% most cited physicists has reached an astronomical 10,253, which is almost 30 times more than what is required for a mathematician to reach the exclusive club of the top 1% citedness (i.e., 346 citations). As we saw in the case of Georgia, results in one field, physics, can elevate national indicators of research excellence in general. The Hirsch or h-index was devised to diminish the impact of only one highly cited paper, which could distort the mean citation rate. Analogously, countries or territories that have succeeded in passing the essential thresholds in most or in all 22 fields of science should receive more credits than those able to excel in a few research fields only.
Large-scale collaborative projects, however, are not characteristic of physics alone. Many medical and environmental problems cannot be solved without large international collaborative efforts with partners from many countries. Panama is a good example here, as its scientific excellence has strongly benefited from the participation of Panamanian researchers in large international networks designed for the study of disease burden, diabetes, deforestation, and ecology. Paradoxically, Panama has greatly benefited from the very tough criteria that the WoS has for inclusion of journals and how they then get into the ESI. It was observed, for instance, that Panama has nearly 100 scientific journals that are not included in the WoS and, because of this, cannot be counted in the ESI, in addition to the ESI’s own strict acceptance thresholds (Monge-Najera & Ho, 2015). Thus, although international collaboration is usually mutually beneficial, sometimes it is even more advantageous for researchers from smaller or less advanced countries. This is well exemplified by a recent study by Hirv (2019) who showed that, when controlling for the share of hyperauthored papers resulting from large-scale international consortia (e.g., CERN, IDEFIX consortium), Iceland plunges from the first position in the HQSI to the 12th, Peru from sixth to 30th, and Estonia from 12th to 31st.
If a paper has many coauthors from different countries, databases attribute equal credits to each author and to each country according to all named author’s affiliations. Because equal credits to all authors, even if their number is more than a hundred, or even a thousand, may seem unjust, various options for fractional counting have been proposed (Leydesdorff & Bornmann, 2011; Leydesdorff & Opthof, 2010; Prathap, 2011; Sivertsen et al., 2019), in which a fraction of the credit is attributed to each author of the paper instead of the full credit to everyone. A fractional attribution of authorship credits may be warranted for those coauthors whose roles were modest, but it may be unfair for those who indeed had principal roles in designing the research and writing up the papers. There is no convincing evidence that fractional counting can correct one of the problems by not creating another form of injustice, for example, diminishing the credits of main authors whose ideas were crucial for the study. Although fractional counting may seem promising, it remains an impractical option until databases start providing tools for doing it. It is also important to note that the model of a “lonely genius” who works in solitude and thus receives all the credits for their work is no longer the ideal or the most practical way of doing research. Science is a collective enterprise, more than ever, in which the contributions of all participants deserve recognition.
Can Money Buy Scientific Excellence?
Although previous studies have shown that scientific wealth is strongly associated with a country’s level of economic development (e.g., Aksnes et al., 2017; King, 2004; May, 1997; Mueller, 2016; Vinkler, 2008), our findings indicate that the relationship between economic and scientific wealth only exists within a group of sufficiently wealthy countries, that is, countries in which GNI was above the median value US$22,162 for our current sample of 97 countries. Thus, it seems that money can indeed buy scientific excellence, but only when a certain threshold of wealth has been achieved.
Furthermore, there seem to some other societal factors that are even more important when predicting the scientific wealth of nations—across all countries, the positive relationship between scientific excellence and economic indicators was no longer significant when other societal factors were controlled for. Thus, there is no guarantee that national wealth and investments into R&D automatically lead to an increase in scientific excellence—although money is important, there are also several other factors, such as good governance, population size, and communist past or presence that need to be considered when trying to understand and explain the scientific success of nations.
Scientific Excellence Needs Good Governance
Academia is not a separate place or entity from the rest of society, but rather an integral part of it. Therefore, it was not an unexpected finding that one of the most significant predictors of high-quality science was an indicator characterizing how state authority is implemented and how social institutions, not only science, function. As it turned out, excellent results in science cannot be achieved without good governance, measured by the WGIs. Good governance means that state authority is exercised deliberately and meticulously, including an absence of violence and corruption and respecting the rule of law and citizens. Good governance also presumes an ability to formulate and implement sound policies from which the whole of society benefits, not only a privileged group of people (Kaufmann et al., 2010). Although we cannot say anything about the causality of the relationship, it looks like countries with good governance are the ones, which are more successful in nurturing and producing high-level research. If bad governance may occasionally produce an economic surge (Wilkin, 2011), there do not seem to be too many examples of how poor governance can generate outstanding science.
Social scientists have also noticed that social institutions can be classified into inclusive and extractive ones based on how they are governed. Inclusive institutions, opposite to extractive ones, allow and encourage participants to enter new activities, allowing them to freely choose their careers. There is no, or only minimal, competition between elites in inclusive institutions, ensuring open access to societal resources, which is independent of the configurations of social or other groups (Acemoglu & Robinson, 2012; North et al., 2009). In science, inclusiveness means that research is open to everyone, not to relatively small elite only; individuals can choose the careers that make the best use of their own skills and education to achieve results that correspond to their efforts. Extractive scientific institutions discourage people from taking their own initiative because they know that credit will not always go to themselves and their opportunities for achievement are restricted by regulations, bureaucracy, and nepotism. One of the main purposes of good governance is to create inclusive scientific institutions, which obviously help to translate economic wealth into high-quality scientific publications.
Does Population Size Matter?
Our findings also indicate that smaller countries seem to have an advantage over larger ones in producing papers with high-level scientific impact. This is in accordance with earlier studies that have shown that most smaller European countries (e.g., Iceland, Sweden, Finland, Denmark, Ireland, and Belgium) have a very balanced development between different fields of science, but still with an emphasis on the biomedical and environmental sciences (Harzing & Giroud, 2014).
Yet, it is obvious that the size of a population by itself cannot influence the quality of scientific papers produced by the scientists of any given nation and that it must be something in the way social institutions work which gives smaller countries a competitive advantage over larger ones. Previous studies have shown that the probability of violence increases with the size of a country’s population (Van de Vliert et al., 1999). According to some estimates, a 1% increase in population size raises the risk of civil conflict by more than 5.2 percentage points (Brückner, 2010). Thus, one of the explanations may be that a smaller population size helps to avoid civil conflict, which may be distractive to a full commitment to science.
Likewise, a robust negative relationship exists between the size of a country’s territory and the measure of the rule of law implemented in the country (Olsson & Hansson, 2011). Larger countries generally have larger governments and more politicians, both of which are potential sources of corruption (Arvate et al., 2010; Bergh et al., 2017; Goel & Nelson, 1998; Kotera et al., 2012), and, as a result, a larger population makes the risk of bribery more likely (Mocan, 2008), which, in turn, may restrict a merit-based (or equal) access to a scientific career and research opportunities.
Concluding Remarks
There are no doubts that the ESI is a useful instrument that can summarize the scientific strength of any country or territory in only a few minutes. The mean citation rate per article combined with the percentage of papers that reached the top 1% citation rate—shortly, the HQSI—is a relatively reliable index characterizing the scientific wealth of a given country. However, sometimes the rankings of countries based on their HQSI may look different from what common sense could tell us. Relatively small countries without an acknowledged reputation can occupy higher positions in the high-quality science rankings than many well-known scientific superpowers, which may have more modest positions in the HQSI ranking. We noticed, however, that a high position in the HQSI ranking could be achieved in different ways. In addition to increasing the quality of scientific publications, it is possible to maintain a position in the ranking by avoiding weaker publications in some research areas and consequently decrease the mean citation rate. Our attempts to correct the HQSI by considering the percentage of papers that did not pass the thresholds for entering the ESI were not successful because the percentage of rejected papers did not correlate with the other high-quality science indicators.
The results demonstrated that an initially strong correlation between a country’s economic indicators and the HQSI became insignificant when their relative impact competed with certain other predictors. The role of economic wealth and R&D expenditure is insignificant compared with a country’s size, communist history, and the quality of governance. It seems that avoiding violence, civil conflict, and corruption, and obeying the rule of law, in all of which smaller countries tend to be more successful than bigger ones, are the essential components of a climate in which science can flourish.
Footnotes
Acknowledgements
We thank Delaney Michael Skerrett for his helpful comments on an earlier draft of this article.
Declaration of Conflicting Interests
The author(s) declared no potential conflicts of interest with respect to the research, authorship, and/or publication of this article.
Funding
The author(s) received no financial support for the research, authorship, and/or publication of this article.