
Abstract
This article introduces a new dataset of historical family characteristics based on ethnographic literature. The novelty of the dataset lies in the fact that it is constructed at the level of the ethnic group. To test the possibilities of the dataset, we construct a measure of family constraints on women’s agency from it and explore its correlation to a number of geographical factors.
Introduction
Families are a fundamental component of the fabric of society. However, across the world, we observe important distinctions in how societies arrange familial relations. These differences have important ramifications. As a result of different family characteristics, children are brought up within varying gendered, class-based, or age-based hierarchies in the setting of their natal home. But how can we measure these differences in family organization? And what factors can we discern to offer a tentative explanation for where these differences come from? In this article, we introduce a new global dataset on historical family characteristics at the level of the ethnic group. Using these data, we construct a composite measure of the Family Constraints on Women’s Agency (FCOWA) and explore the geographical factors that may drive differences in such constraints in an attempt to explain the patterns that can be observed.
In recent years, a growing interest in what is often called New Institutional Economics has led to a wave of research in economics and economic history geared toward capturing facets of societies that go well beyond classic economic data (Guiso, Sapienza, & Zingales, 2006). The original formulation of New Institutional Economics argues that the way that transaction costs and property rights are arranged is crucial to growth and development (North, 1990). In this model, secure property rights and low transaction costs will lead to the efficient allocation of resources through investment in physical and human capital. However, New Institutional Economics has also spawned an interest in informal institutions which were long excluded from standard economic analysis. One element of this is the attempt to incorporate culture into economic models (Guiso et al., 2006). Cultural variation is challenging to capture empirically in large part due to its multifaceted nature. As such, it had largely disappeared from economic models as an explanatory variable in the middle decades of the 20th century. However, the recent interest of economists in culture has resulted in research claiming societies’ norms and values as well as their institutions may persist, rather than simply following in line with the development process (overviews in Alesina & Giuliano, 2015; Nunn, 2009; Spolaore & Wacziarg, 2013; examples include Alesina, Giuliano, & Nunn, 2013; Branisa, Klasen, & Ziegler, 2013; Nunn & Wantchekon, 2011).
In much of the economics literature, topics of culture and the institutional determinants of development are tackled at the national level. 1 However, this ignores the wealth of variation that can often be found at the subnational level, particularly in ethnolinguistically diverse countries (Alesina, Devleeschauwer, Easterly, Kurlat, & Wacziarg, 2003; Michalopoulos, 2012; Szołtysek, Gruber, Klüsener, & Goldstein, 2014, on the historical case). In this article, we explore the possibilities for developing a global dataset of the distribution of family characteristics at the regional level to get a sense of how certain institutions cluster at the subnational level (see also work in a similar vein Michalopoulos & Papaioannou, 2014 and Michalopoulos & Papaioannou, 2013). One of our two aims in this article is therefore to introduce a global, geo-referenced dataset of societal characteristics with a focus on family organization. Our second objective is to explore how the global distribution of family organization, specifically the existence of FCOWA, relates to a set of geographical variables: ruggedness, elevation, distance to coast, and distance to the centers of the Neolithic Revolution. We hope that this will contribute to further understanding of why certain features of family organization occur in one place but not in another, and by doing so also give insight into the wider determinants and consequences of cultural differences.
Here, we are interested in one particular element of culture, that of family organization and in particular how family organization impinges upon or empowers women. Why focus on women and family organization? For a start, the family is the key nexus of socialization. This means that family organization and gender roles are particularly likely to be passed on from one generation to the next. Moreover, family life and the household are central to many societies and cultures, which means that they are likely to have effects well beyond the realm of the family. This has even been argued to mean that what children learn about authority and equality within their families can be seen reflected at the level of the polity (Aristotle, 2014; Todd, 1985, p. 6). An important element of such power relations within familial arrangements is that of men versus women. In situations where women have greater freedoms, rights, and access to resources, this will likely be reflected in better development outcomes, broadly construed, for the society at large (Currie & Moretti, 2003; Dollar & Gatti, 1999; Eswaran, 2014; Food and Agriculture Organization of the United Nations, 2011; King, Peterson, Adioetomo, Domingo, & Syed, 1986; Schultz, 1988; Strauss & Thomas, 1995).
The position of women is integrally entwined with culture. In defining a gender system, Karen Mason (2001) writes the following: A set of beliefs and norms, common practices, and associated sanctions through which the meaning of being male and female and the rights and obligations of males and females of different ages and social statuses are defined. Gender systems typically encompass both a division of labor and stratification of the genders. (p.161)
The beliefs, norms, and common practices in Mason’s definition are all part of what may be called culture. These gender systems may thus be influenced by norms and values which, in turn, are historically determined.
In other work, we have addressed how the position of women within family systems affects current day outcomes (Carmichael, Dilli, & Rijpma, 2014; Dilli, Rijpma, & Carmichael, 2015; Rijpma & Carmichael, 2016), and this is generally also the focus of the interest in culture from the New Institutional Economics (Alesina & Giuliano, 2015). However, an important question remains: Why do certain family organization arrangements occur in one region but not another?
Szołtysek (2014) distinguishes a number of explanations for variation in family systems in Eurasia. Important for our purposes is the distinction between functionalist, developmental explanations on one hand, and a number of slow-moving, persistent explanations on the other. The former view basically argues that family systems change as societies develop, become wealthier, and change demographically (e.g., Ruggles, 2009). Szołtysek also discusses a number of explanations of family organizations that one can expect to be persistent over a long period of time: ecology, institutions, religion, and kinship. Although we will also try to include developmental explanations in our analyses, our main focus is on explanations that have an important role in the persistence of family organization. We are particularly interested in geographical explanations. Although kinship, for example, is also very important for female autonomy (Dyson & Moore, 1983; Whyte, 1978), our outcome variable (discussed below) already includes a number of aspects of kinship (e.g., descent). This limits our set of explanatory variables to geographical variables that go back centuries or even millennia.
Several ideas have been put forward as to the deep causes of the distribution of female-friendly family arrangements. A number of scholars have identified the agricultural system of a given region as one of the underlying determinants of family organization. Goody (1976) argues that societies practicing hoe agriculture tend to transmit property (land) to members of the same gender in a descent group, whereas societies practicing plow agriculture transmit to descendants of both sexes. This, in turn, affects other outcomes such as the prevalence of dowries or control of premarital sex. Others have argued that plow agriculture is detrimental to the position of women (Alesina et al., 2013; Boserup, 1970). Similarly, the very introduction of agriculture since the Neolithic Revolution is argued to have had a negative impact on female freedom (Hansen, Jensen, & Skovsgaard, 2015, Todd, 2011). For historical Europe, Mitterauer (2010, see also Mitterauer & Sieder, 1982) suggests that cropping regimes shaped inheritance practices and family organization. Fauve-Chamoux (2006) indicates that stem families are associated with pastoral, mountainous regions. Finally, Brunnbauer (2002) argues that political–legal environs could lead to diversity in family organization within similar geographical settings although he does not dismiss Mitterauer’s hypothesis. Many of these approaches boil down to geography as a fundamental explanation for societal developments related to family and women.
In this article, we take a first exploratory look at a number of geographical characteristics which are suggested by the literature to have an effect on family systems particularly as they pertain to the position of women. These characteristics are distance to coast, ruggedness, elevation, and distance to the nearest center of the Neolithic Revolution. In the next section, we discuss briefly the motivation for the inclusion of each variable. The rest of the article proceeds by sketching the method of matching the family characteristics to locations and the measurement of the geographic variables. The subsequent “Results” section is split in two with the first part presenting the patterns we find for the family systems variables and the second section demonstrating the correlations we find with the various geographic features. The final section concludes.
The Geographical Determinants of the Position of Women
We use distance to the coast on the basis of the qualitative literature. The underlying idea is that the position of women is better in coastal areas where men are often away at sea for long periods of time as fishermen or sailors. Polónia (2009), in her work on early modern Portugal, shows that the phenomenon of “absent men” had positive results for women; “mobility and multiple male absences” led to “a growing demand for female labor and economic participation” (Polónia, 2009, p. 710; see also Polonia, 2006). A similar type of relationship has been proposed linking the “North Sea culture,” male absence, and female autonomy for North-Western Europe (Pye, 2014, pp. 251-252). 2
Distance to the nearest center of the Neolithic Revolution is used as a proxy for the timing of the Neolithic Revolution. 3 The Neolithic Revolution represented a sea change in societal organization. The argument for the effect on gender relations runs as follows; as societies shifted from a nomadic existence to one of settled agriculture more rigid hierarchies emerged between classes, generations, and men and women. Evidence for this claim has been presented by Hansen et al. (2015). The suggestion is that societal organization prior to the Neolithic Revolution (for instance, in hunter–gatherer groups) was relatively female friendly, with goddess worship and associated fertility ritual paramount. This idea has received some recent support from work done on hunter–gatherer groups in the Congo and the Philippines (Dyble et al., 2015). They demonstrate that in these modern day hunter–gatherer groups, equality between the sexes is the norm, with men participating in child care and unanimous decision making the norm. These findings hark back to the work of Morgan (1877/1985) and Engels (1884/2010). Engels argued that the subordinate position of women follows as a direct result of the rise of alienable property rights which together with monogamy underpin modern civilization. 4 Similarly, Goody argues that the differences in family organization that can be observed within Eurasia were small compared with the differences between Eurasia and Sub-Saharan Africa. This he ascribes to the presence of intensive agriculture in Eurasia and the associated importance of landownership, inheritance, and social stratification (Goody, 1972, 1996; Nimkoff & Middleton, 1960). 5
Two more variables that we explore are ruggedness and elevation. Both of which represent, to some extent, an inhospitable environment which could result in societies being isolated from larger cultural developments. Transportation in such regions is more difficult, making them hard to access. Cultivation is also more difficult (Nunn & Puga, 2010). In a way, these are therefore used as measures of a later advent of such events as the introduction of agriculture or the incorporation into states (Scott, 2009). Harsher environments are likely to mean that women’s labor is required outside the household and therefore possibly improve the position of women. However, the effect of these variables could cut both ways as isolation from wider societal security networks could force people to rely more heavily on family connections and drive the formation of joint families. In addition, ruggedness and elevation could leave regions beyond the influence of state authority and wider societal developments. 6
Data and Method
This article is built around a dataset which uses two sources: the Ethnographic Atlas compiled by George Murdock (1969) and the Atlas Narodov Mira (ANM). In the Ethnographic Atlas, Murdock brought together as many ethnographies as possible in such a way as to make cross-cultural comparison possible. To this end, he created more than 100 variables which were coded from the various monographs, manuscripts, and articles consulted to allow researchers to examine how societies compared with one another in a consistent manner. The ANM (Bruk & Alenčenko, 1964), meanwhile, was a project undertaken in the 1960s by Soviet academics to map and quantify the location of each ethnic group globally. By using a geo-referenced version of the ANM, the “Geo-referencing of ethnic groups” (GREG) dataset (Weidmann, Rød, & Cederman, 2010), we are able to link the cultural traits described per group in the Ethnographic Atlas (from hereon EA) to the location of the ethnic groups.
The two sources were combined by matching the ethnic groups coded in Murdock with a list of names of ethnic groups listed in the ANM (Bolt, 2010, 2012). 7 The matching was done using a string-distance algorithm (van der Loo, 2014) which provided a list of the most likely candidates in the ANM database based on the EA names. 8 We then selected by hand the correct group, either on the basis of the same names or close matches. By doing this, we were able to match 597 societies, 88% of the ethnic groups available in Bolt’s dataset. This amounts to 47% of the 1,267 societies in the Ethnographic Atlas and 53% of the 1,071 principal ethnic groups in the ANM. The unmatched percentage can be attributed to changing naming practices as well as the ethnographies covering a different set of societies than covered in the ANM. 9
Figure 1 shows which societies from Murdock we were able to match to the ANM. It highlights three important lacunas. First, there is Europe for which coverage in the Ethnographic Atlas is poor (Rijpma & Carmichael, 2016). Australia and the western part of Latin America are also frequently unmatched. Besides these specific regions with low matching rates, missing societies are fairly evenly spread across the continents. An important exception, however, is Africa, for which coverage is very good.
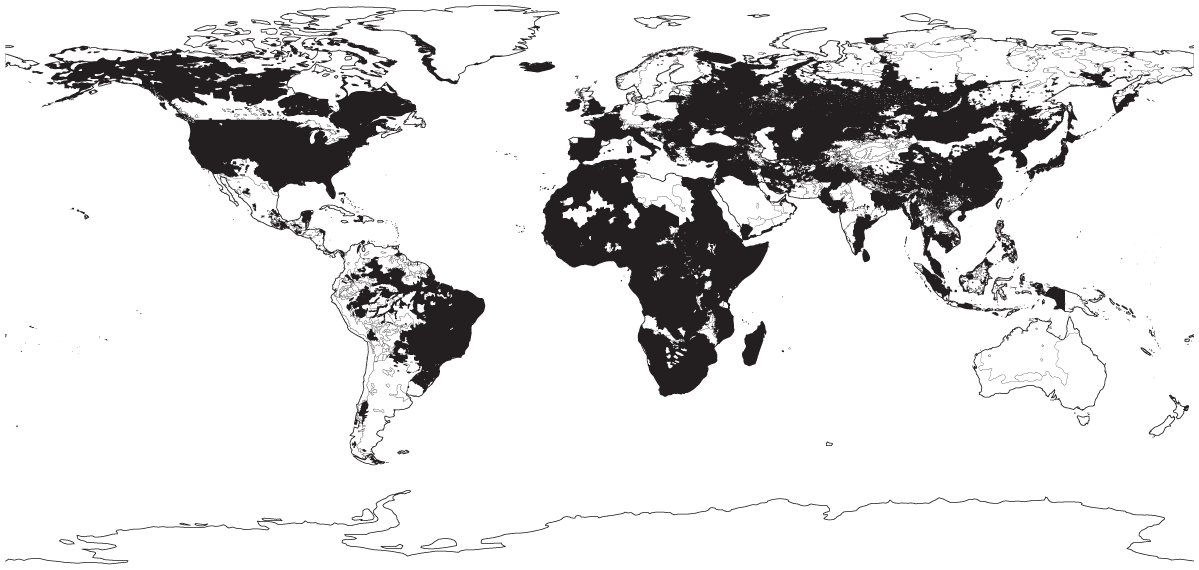
Matched (Black) and unmatched (White) societies.
From this dataset, we create a composite variable to measure FCOWA (this measure is described in more detail in Carmichael and Rijpma, in press). We look at a number of variables from the Ethnographic Atlas. Our choice for these variables is based on an overview of FCOWA written by Jan Kok (in press). In it, he discusses a number of family situations limiting women’s ability to make their own life-course decisions. Of course, we were also dependent on the data available in the Ethnographic Atlas. For instance, this meant Kok’s argument for the inclusion of a variable measuring the right of women to initiate divorce could not be addressed.
First of all, we look at descent systems as patrilineal descent could deny women status, power, and claims on inheritance. We also look at whether women have access to property, specifically inheritance rules and property transfers at marriage. We consider patrilocal residence arrangements after marriage, arguing that the absence of nearby kin could remove the support network of the spouse in the new marriage. Nonmonogamous marriage is also included as it could weaken women’s bargaining position in the household. We look at a preference for cousin marriage to capture whether women have a choice in their marriage partner which would again mean a stronger bargaining position (ideally, we would use a direct measure such as the practice of arranged marriages, but this is not in the Ethnographic Atlas). Members of a family tend to have different power positions. Again, we use an indirect measure to capture this: The hierarchies present in complex (extended) households. Our final measure is the presence of kin networks or clans. Their expected effect is ambivalent: They could either provide support and resources, or they could constrain the decision-making freedom. 10 For all these variables, we created dummy variables indicative of low women’s agency (e.g., patrilineal rather than bilateral or matrilineal descent).
These 8 variables are brought together into a composite indicator which we call the FCOWA measure. This measure has been constructed through polychoric factor analysis, a dimensionality reduction technique. It tries to find a latent variable that accounts for the variation and correlation among the multiple variables. The resulting index is a linear combination of the eight variables, using weights that ensure that the index explains as much of the variation in the eight variables as possible. More details about the procedure can be found in the Appendix and in Carmichael and Rijpma (in press).
Besides geographical coverage, it is also important to be aware of other limitations of the Ethnographic Atlas. In other work, we have detailed some of the issues with Murdock’s data that surface if one checks it with external datasets and if one looks at the original source material (Rijpma & Carmichael, 2016). Comparison with external datasets (Todd, 1985) on a selection of family-related variables showed that Murdock’s data could be corroborated for about 70% of the countries. In cases where there was a mismatch, the issue could frequently be traced to the choices made in coding the ethnographies. Some nuances in the original material could easily be lost. Likewise, it was also found that substantial variation could exist within the ethnic groups described. This was especially likely for ethnic groups that were spread across a large geographical area or were observed during times of great social change. 11 Because our starting point is the Murdock dataset and we are not able to redo his work, these quality issues cannot be fully addressed. In the analyses below, we will try to control for them indirectly.
Finally, there is the issue of time. The Murdock’s data are frequently claimed to be preindustrial or precolonial (e.g., Nunn & Wantchekon, 2011), but the truth is more complicated. Most observations were made between 1860 and 1960 with the median in 1920. Because geography will largely be constant over time, the heterogeneity in time of observation should not cause a discrepancy between our outcome and explanations. However, it is important to remember that some societies are observed much later than others and, accordingly, some will have been influenced by global trends in family practices. In our analysis below, we try to correct for this by including a variable for the moment of observation.
Because GREG allows us to geospatially locate all societies as polygons on a world map, we are able to use a number of geographical datasets. To calculate the distance to the coast of a society, we used the 1:50m coastline map from Natural Earth. 12 The shortest (“as the crow flies”) distance on the World Geodetic System (WGS) ellipsoid between the central point of the society’s polygon and the coastline was calculated (Hijmans, 2015). Figure 2 shows the resulting distance to coast for each society in the ANM. The distribution is as expected, though it is important to note that in our procedure, societies that are spread over a large geographical area have large polygons and that their center is therefore far removed from the coast. To the extent that these societies are concentrated near the coast may introduce a bias in our data.
Distance (as the crow flies) from the society’s spatial central point to the coast.
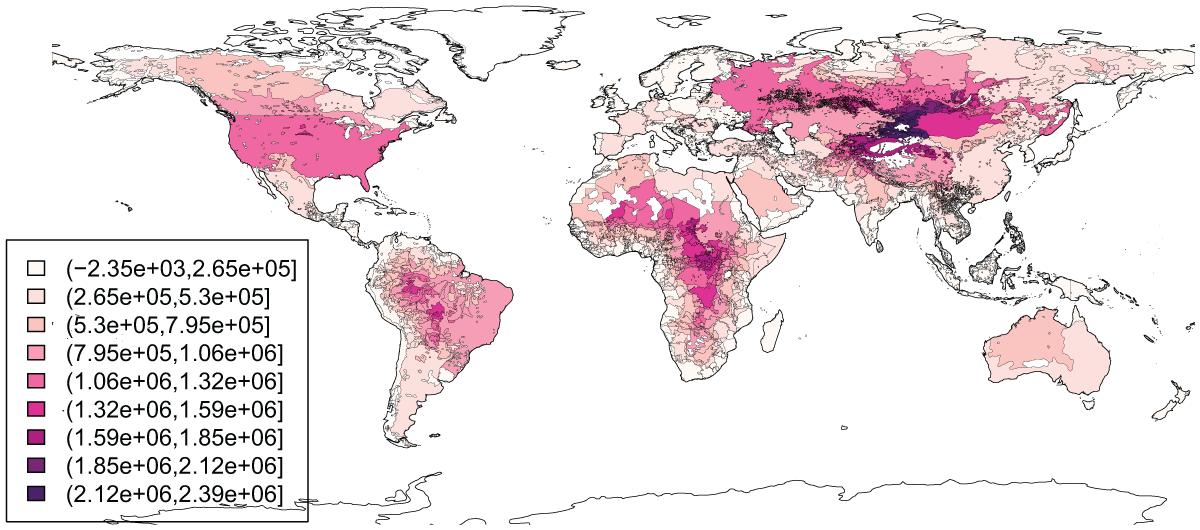
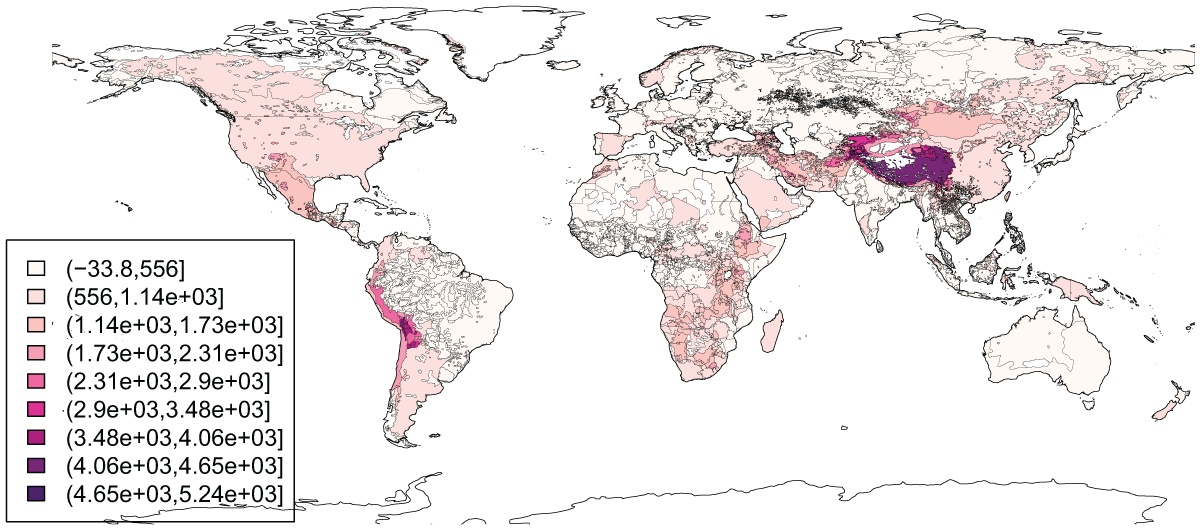
Our two measures for the inhospitability of the environment are calculated using elevation data. We use the widely used GTOPO30 digital elevation model from the U.S. Geological Survey’s Earth Resources Observation and Science (EROS) Center. 13 Elevation data are directly available from this dataset. We calculate the grid cell size weighted average elevation for each society’s polygons (Nunn & Puga, 2010: 22 on the need for weighting; Hijmans, 2016, for the computations). Ruggedness is a measure of local variation in terrain and makes cultivation and transportation more difficult (Nunn & Puga, 2010). It was calculated as the average of the absolute differences of a grid cell with its neighbors (Wilson, O’Connell, Brown, Guinan, & Grehan, 2007). Again, we took a grid cell size weighted average for each society’s polygon. Figures 3 and 4 present our two measures of inhospitability for each ethnic group’s polygon. The distribution is as expected, with the Himalayas and the Andes standing out as particularly inhospitable regions.
Mean terrain elevation for each ethnic group.
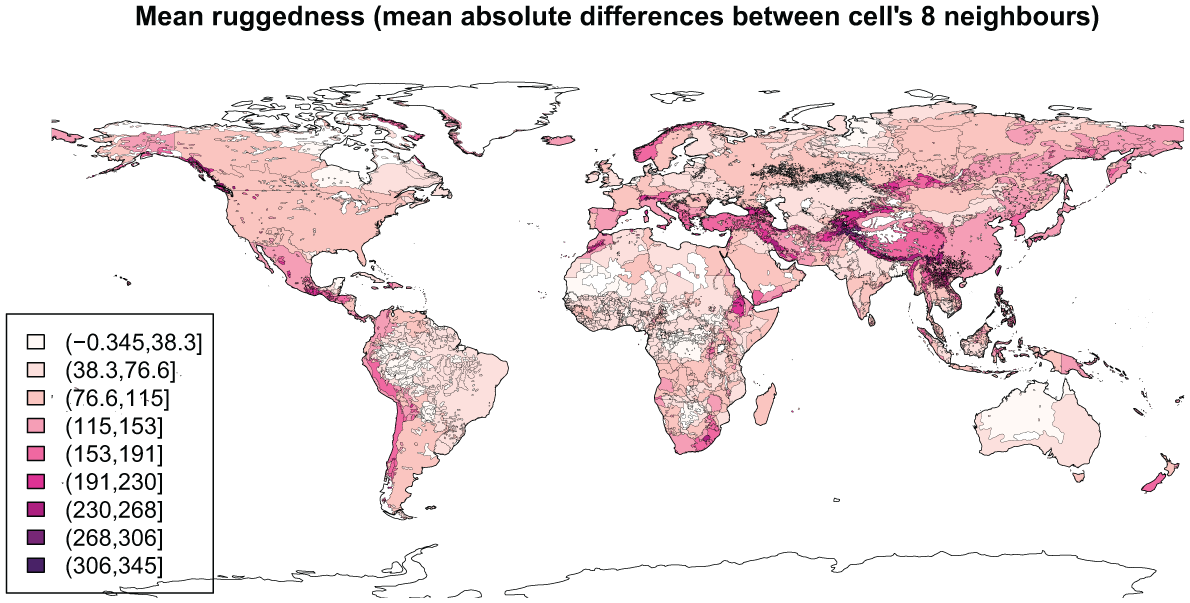
Mean terrain ruggedness for each ethnic group.
The distance to the centers of the Neolithic Revolution was based on a map produced for a supplementary issue to Current Anthropology which provides 11 major regions of domestication of plants and animals (Price & Bar-Yosef, 2011). This includes one region in the Middle East, one in present-day India, two in China, one in New Guinea, one in Africa, and five in the Americas. The map also roughly dates the major domestication sites, and we use this below to correct distance measures for the time since domestication. We calculate two distance measures on the basis of this map. One is the absolute distance on the WGS ellipsoid from the society’s spatial center to the closest center of domestication (Figure 5).
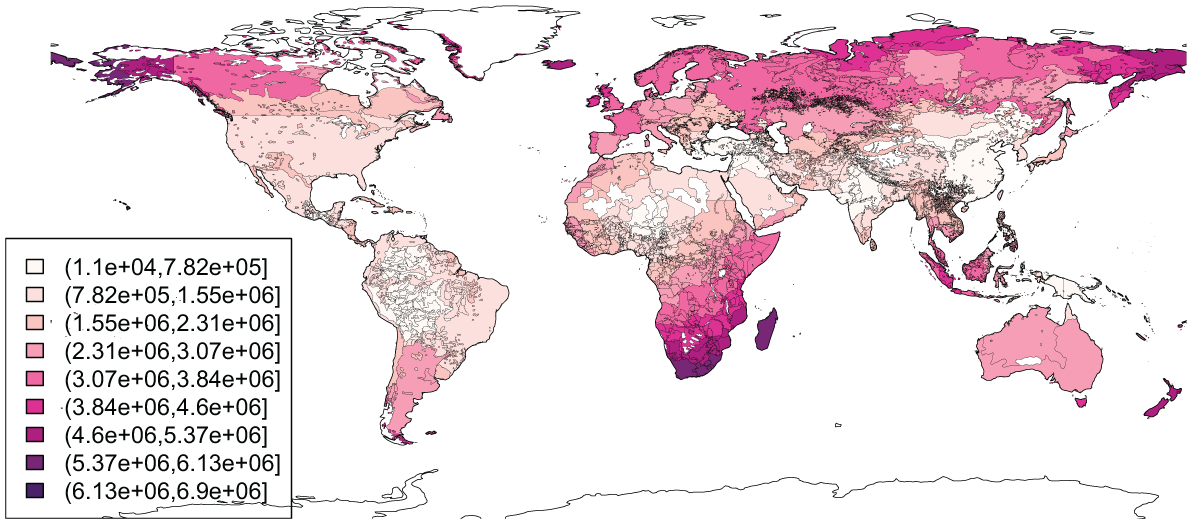
Distance “as the crow flies” from closest major center of plant/animal domestication.
However, the “as the crow flies” measure has some shortcomings. At distances of many 1,000s of kilometers, obstacles such as large bodies of water start to matter. For this reason, we also calculated the least-cost distance, which takes into account these characteristics to calculate a distance “as the wolf runs” (van Etten, 2015). The GTOPO30 elevation data were combined with the major domestication sites to make this calculation. Large bodies of water were set to be very costly to traverse, though the grid had been smoothed at the coastline to allow crossing of small bodies of water such as the Strait of Dover. Figure 6 shows an example distance for the Afghans, and Figure 7 shows the global distribution of this measure.
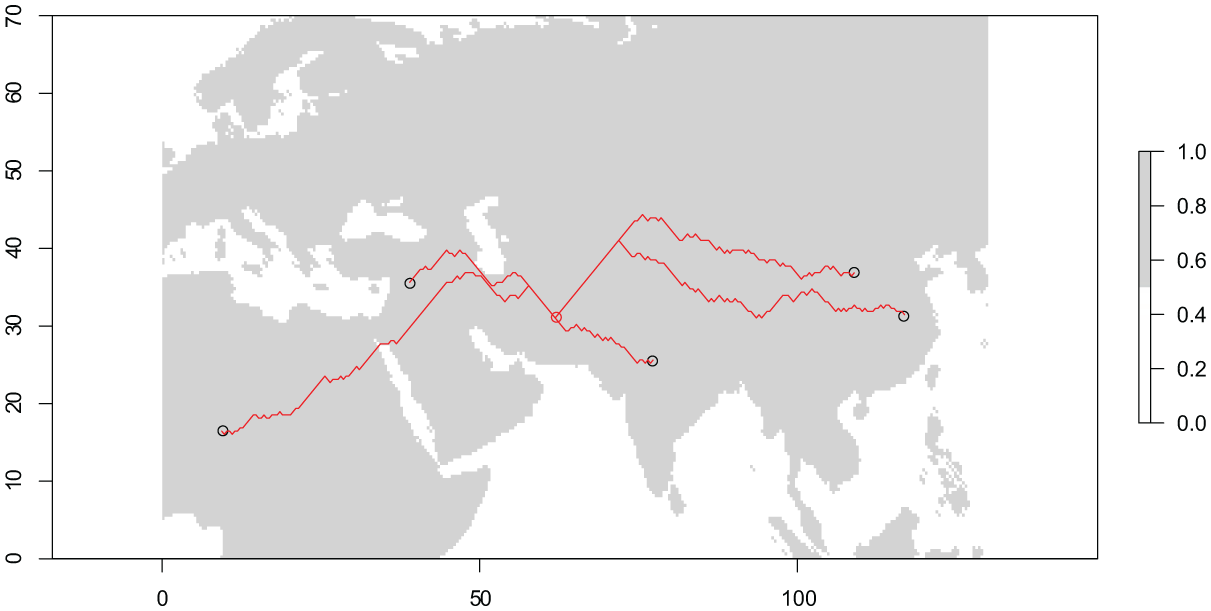
Example least-cost distance to major center of plant/animal domestication.
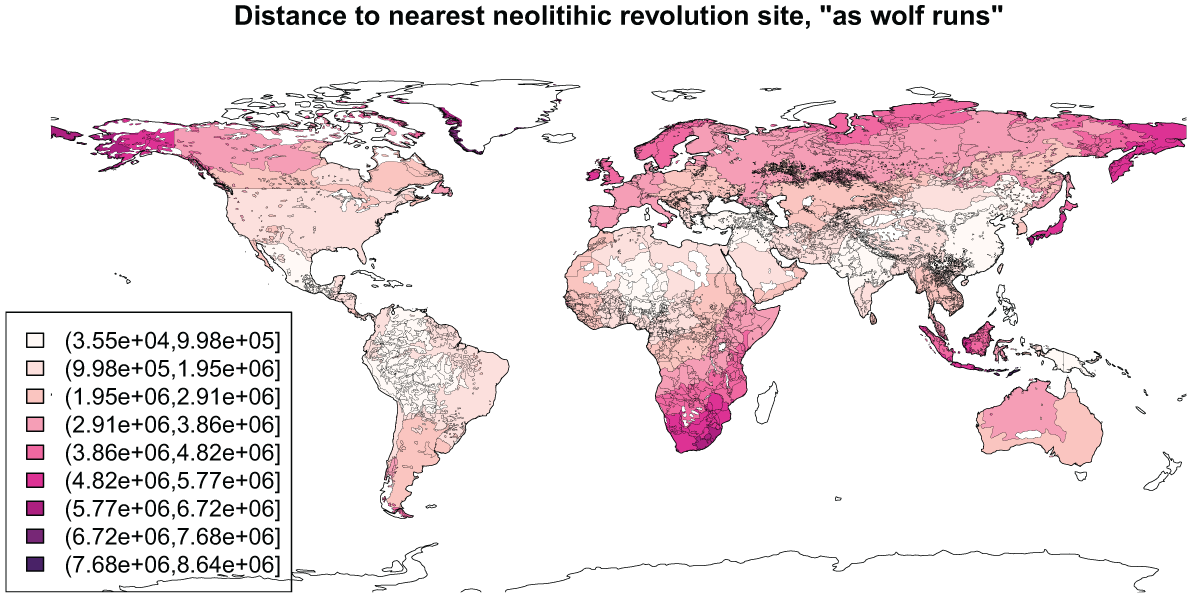
Least-cost distance to major center of plant/animal domestication.
Results: Patterns and Spread
The following maps present first the composite index as well as three of its eight components to give an idea of the geographic spread of the family systems variables we look at.
Figure 8 shows the distribution of the FCOWA measure across the globe. Note that to be able to calculate the score on this index, all eight of the variables discussed earlier had to be present. This explains the gaps in addition to those shown in Figure 1.
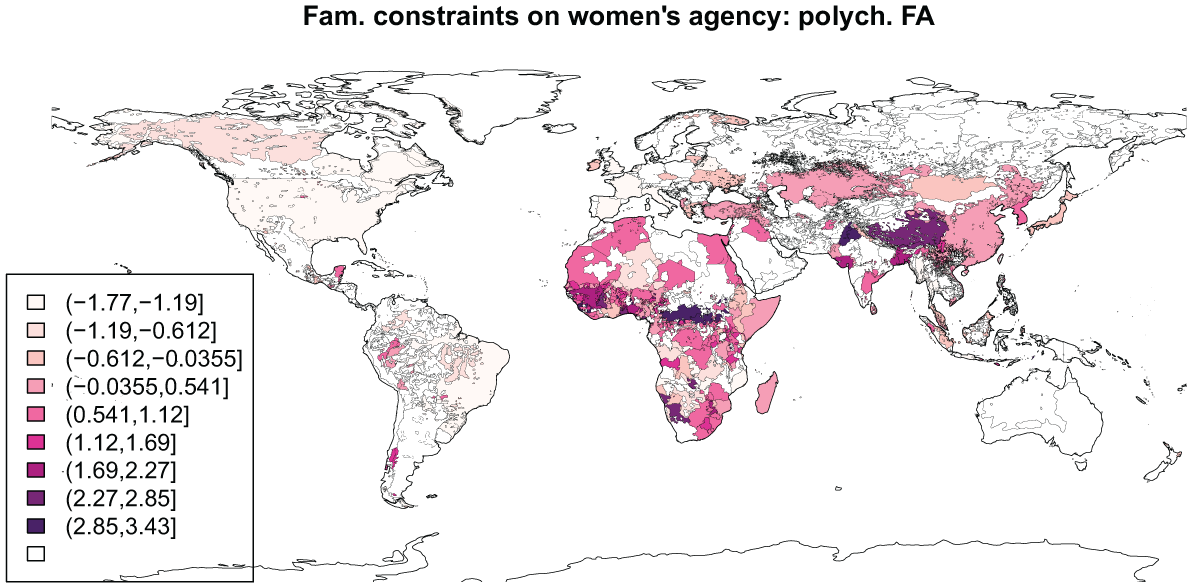
Distribution of the FCOWA measure by ethnic group.
The map shows high family constraints on female agency in western and southern Asia, as well as China. Africa, both north and south of the Sahara, also shows high constraints, especially around the equator. Some features are familiar: Female agency was lower in the Middle East than it was in Western Europe, for instance (Carmichael et al., 2014). Moreover, though there are many ethnic groups unaccounted for in India, we confirm that family constraints on female agency were higher in the North than they were in the South, especially Sri Lanka (Dyson & Moore, 1983).
In Figure 9, the prevalence of extended family is mapped. The variable here is extended (joint) families versus nuclear and stem families which tended to dominate European family systems. 14 We see that extended households are a phenomenon occurring in a belt across the central region of the Eurasian continent, as well as in the East of China and in parts of Africa. The areas West of China, South-East Asia, and Southern Africa are not characterized by extended families. 15
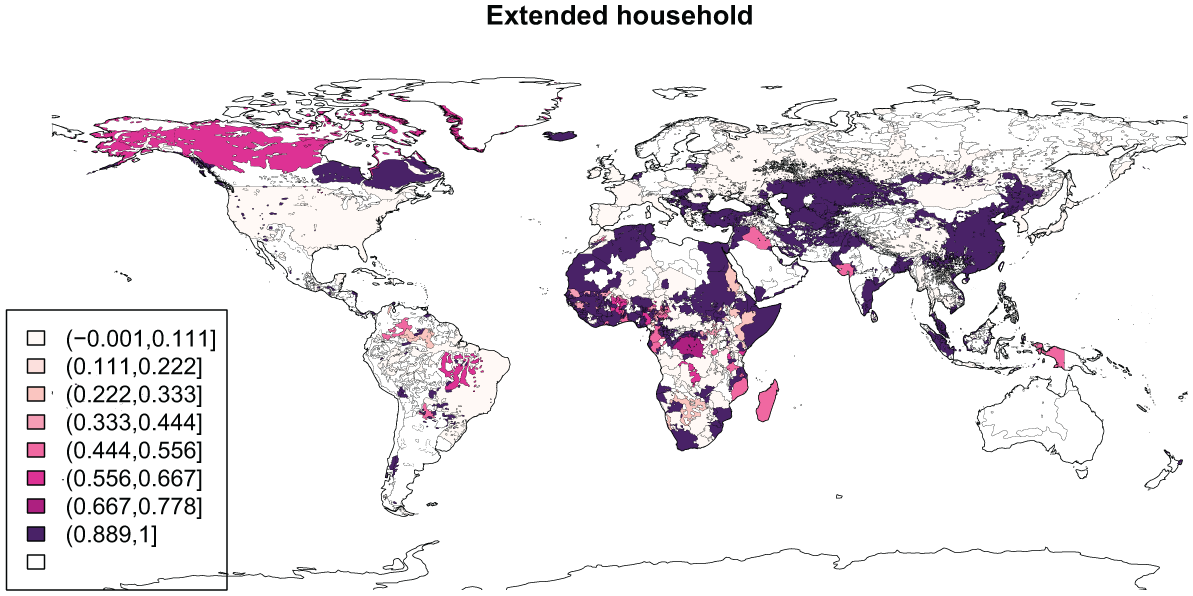
Co-residence practices.
Figure 10 shows societies practicing patrilineal descent. Here, we see that a large part of Asia, North Africa, and Sub-Saharan Africa have family systems organized around patrilineal descent, while Europe and the Americas tend not to have patrilineal descent systems (the alternatives are matrilineal or bilateral).
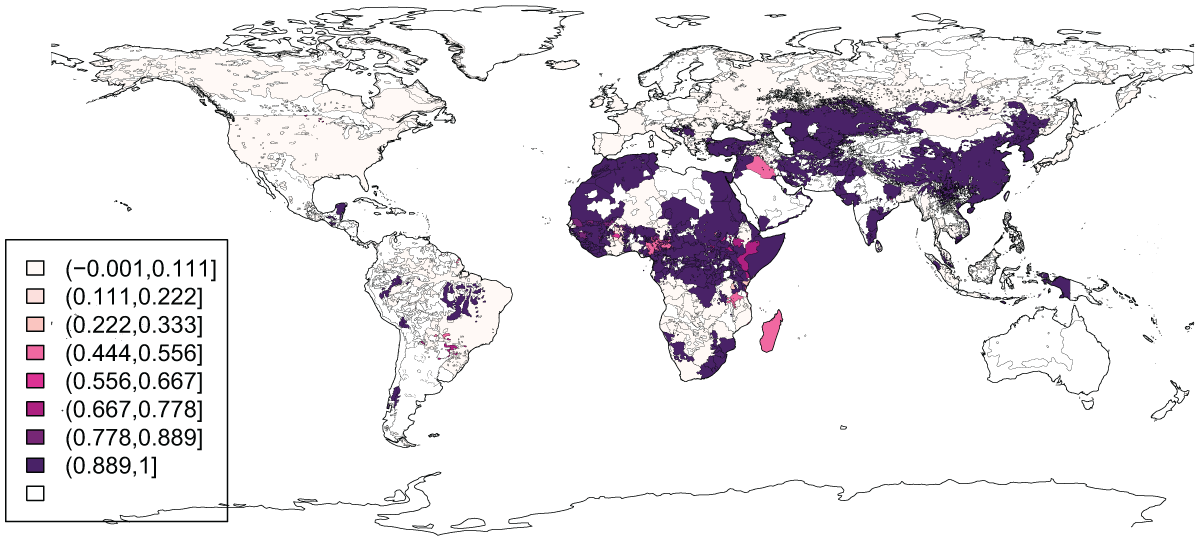
Patrilineal descent.
Finally, turning to preferred cousin marriage, we see that this appears in the central parts of Eurasia, the east of India, Canada, and in large parts of North Africa (Figure 11).
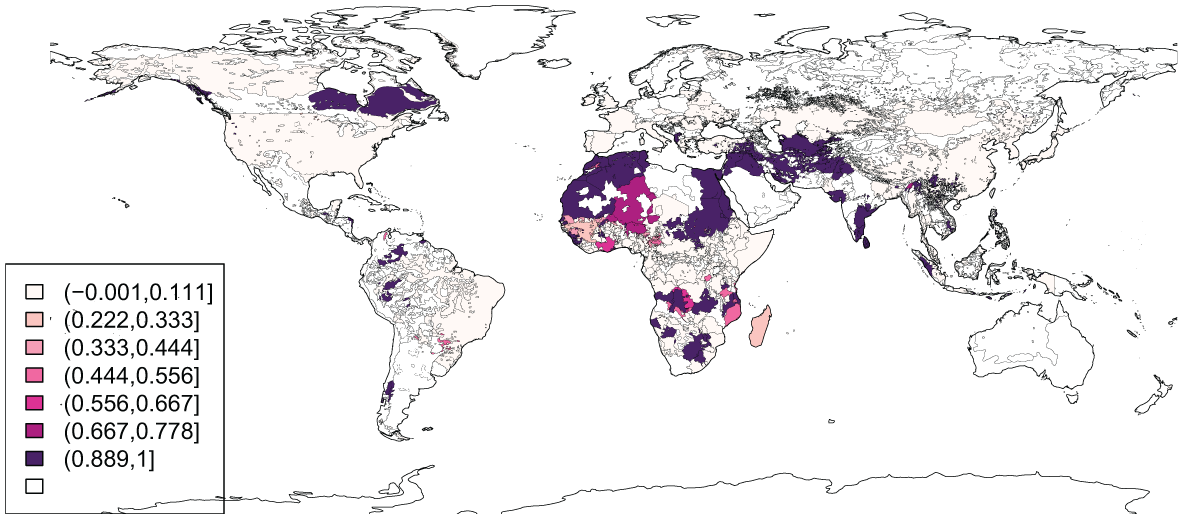
Preferred cousin marriage.
Results: Correlations
In this section, we check the correlation of the geographical data with the FCOWA measure. For this, we use linear regression models. In an exploratory paper such as this, scatterplots and simple correlation coefficients might be more apt. However, we think it is important to at least control for the year of observation in Murdock (Henderson & Whatley, 2014). Moreover, we also want to ascertain that the distribution of our FCOWA measure is not better explained by very broad geographical or developmental characteristics (e.g., the fact that Sub-Saharan Africa is poorer than other parts of the world). In short, some basic control variables are necessary even at this exploratory stage.
One issue we try to deal with is heterogeneity at the ethnic group level. Research has shown that even at close proximity, there can exist substantial variation in household structure (Szołtysek et al., 2014). Our own detailed reading of some of the source material used in the Ethnographic Atlas also revealed that substantial variation can lie behind Murdock’s coding of ethnic groups (Rijpma & Carmichael, 2016). This issue cannot be truly solved with these data: It is after all reported at the level of the ethnic group. We can, however, try to include a number of proxy variables to control for the issue. One such variable is the area inhabited by the ethnic group, based on the intuition that an ethnic group spread over a larger area (e.g., the Russians) would be more likely to display heterogeneity. The area of each polygon is directly available from the digitized ANM (Weidmann et al., 2010). For similar reasons, we include population size in c. 1920, the average year of observation in Murdock’s atlas (data from Klein Goldewijk, Beusen, van Drecht, & de Vos, 2011). Finally, we include the number of polygons that an ethnic group was assigned to in the Narodov Mira atlas. Again, this can be interpreted as a sign of substantial dispersion of the population over a diverse terrain (e.g., islands) or living among other ethnic groups, which would make it more likely for the ethnic group to display diversity in its family structures.
We also include basic socioeconomic and political control variables from Murdock’s atlas. It is likely that economic activities and government policies could have a substantial impact on family organization. Examples of these ideas include Ruggles’ (2009) work on the economic and demographic determinant of family systems in historical Western Europe and Nimkoff and Middleton’s (1960) work on the relation between subsistence patterns and the prevalence of extended families. Although the Ethnographic Atlas is a very rich source providing a lot of potential variables, two seem particularly pertinent: “jurisdictional hierarchy beyond local community” and “subsistence economy.” The former is a variable coding whether the ethnic group was part of a larger state structure which may have been able to influence family customs. It can take the values ranging from none to four levels of political authority beyond the local community (four levels would usually mean being part of a large state). “Subsistence economy” is an additional variable in the extended version of the Ethnographic Atlas (Gray, 1998). 16 It codes which economic activity contributed most to the society’s subsistence: gathering, hunting, fishing, or one of a number of types of agricultural activity.
Many ethnic groups are represented by more than one polygon. Because these observations all share the same score on the outcome variable, the data have been aggregated at the ethnic group level by calculating the mean of the geographic characteristics for each ethnic group (taking the population or area-weighted mean gave qualitatively similar results). Although this does discard some important variation in the model, it also prevents shrinking the standard errors too much in the regressions. 17 Missing observations for certain variables for some polygons or ethnic groups means the aggregation procedure discards additional observations, meaning we end up with fewer than the 597 societies we were able to match. The alternative was to estimate a full multilevel model which should give similar results (Bates, Maechler, Bolker, & Walker, 2015; Primo, Jacobsmeier, & Milyo, 2007; Snijders & Bosker, 1999). Although we tried to estimate such a model, the models gave substantial convergence problems (c.f. Primo et al., 2007, pp. 455, 458). Given the fact that our motivation is exploratory, we did not pursue this option further, but we do think that a full analysis of these data would require thorough exploration of the possibilities of fitting a full multilevel model.
The results are presented in Table 1. Overall, societies that are further away from a major center of plant and animal domestication display lower family constraints on female agency. However, the mixed results on our two measures (absolute distance and distance over land), and especially the fact our preferred measure (distance by land) gives less precise results, means these results are not very strong. Moreover, correcting the measure for the time span since the start of agriculture in the relevant site reversed the relationship.
OLS Regressions of the FCOWA Measure on Geographical Characteristics.
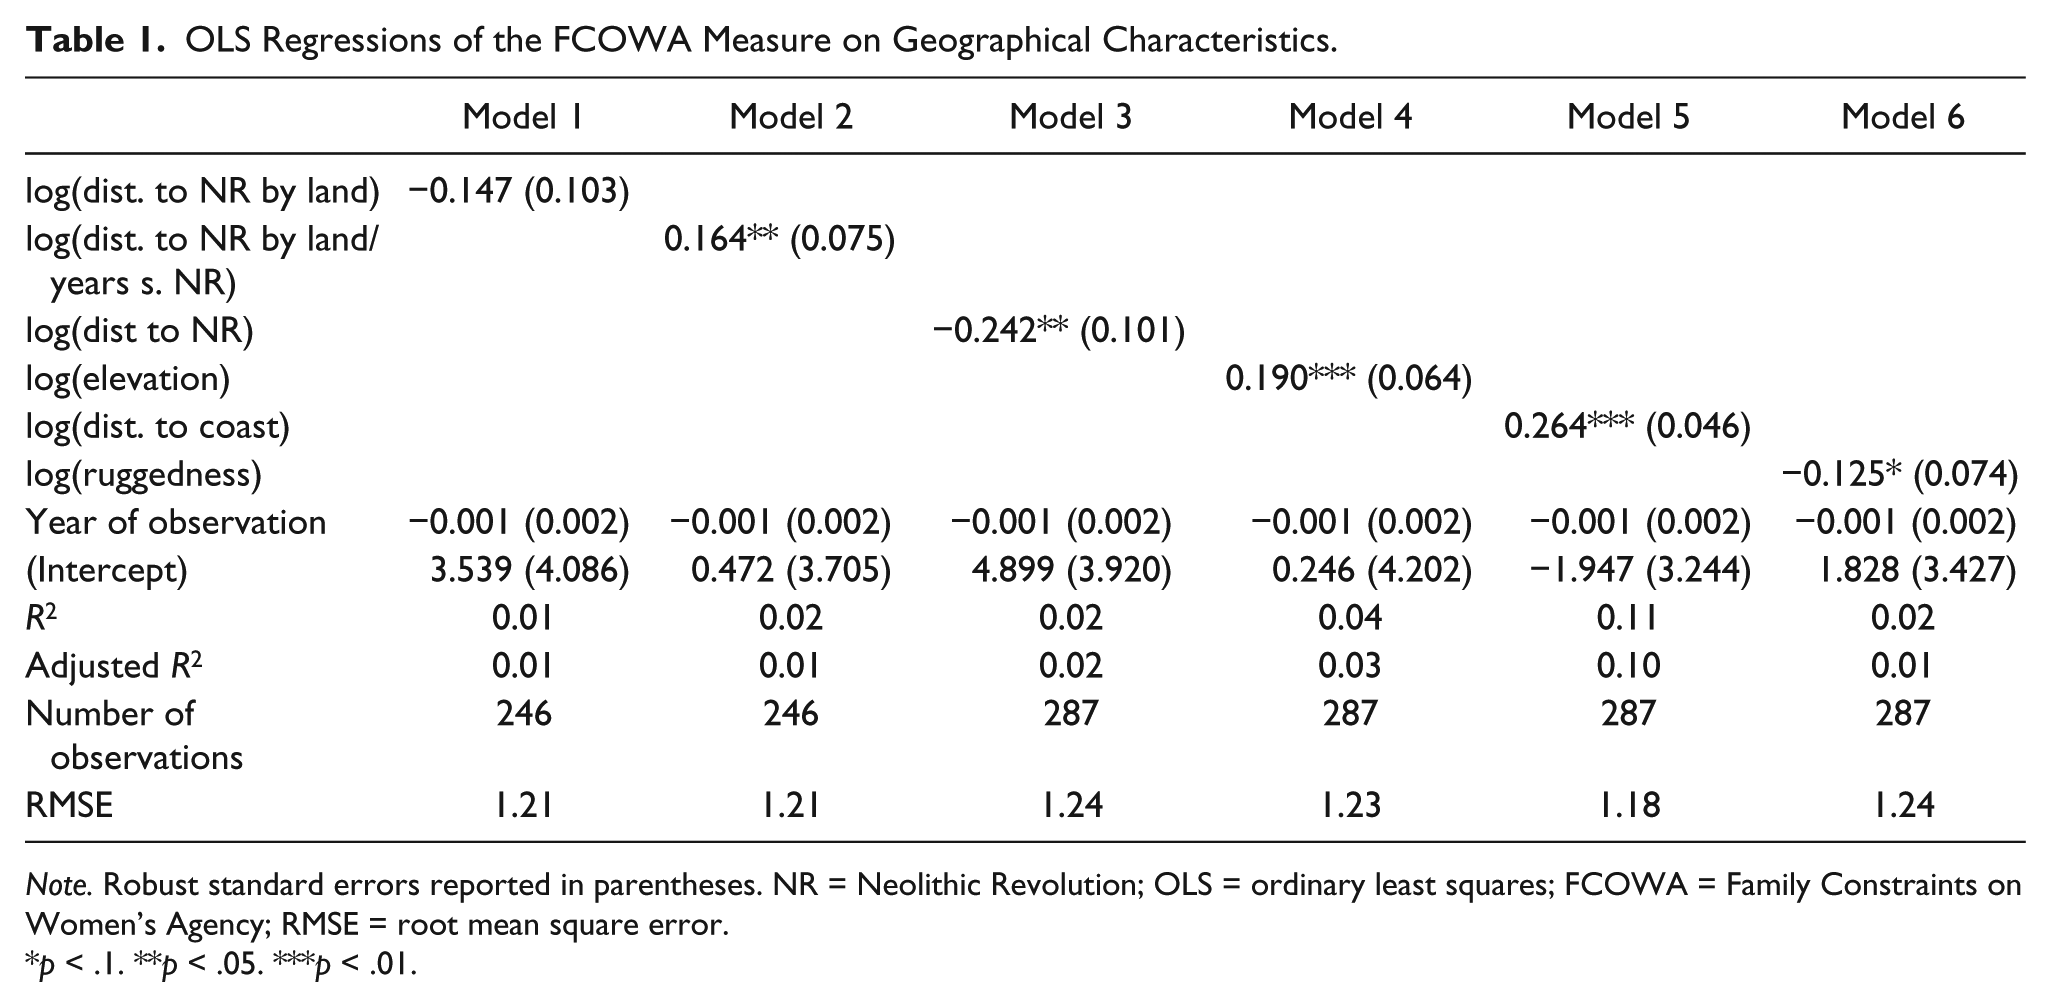
Note. Robust standard errors reported in parentheses. NR = Neolithic Revolution; OLS = ordinary least squares; FCOWA = Family Constraints on Women’s Agency; RMSE = root mean square error.
p < .1. **p < .05. ***p < .01.
A greater distance to coast was associated with a higher FCOWA score, meaning that societies close to the coast had more female-friendly family characteristics. 0.003 lower score on the FCOWA measure. With the FCOWA measure ranging from −1.8 to 3.4 and with distance to coast ranging from less than a 100 m to more than 2,000 km, this could amount to a sizable effect.
Our measures of accessibility and hospitability of the terrain show mixed results. Ruggedness has a negative effect, though the parameter estimate is only significant at the 10% level. Elevation has a positive effect, which means that higher, less accessible and less hospitable regions had polities that typically scored higher on the FCOWA index, that is, there were more FCOWA. The magnitude of the effect is similar to those discussed above: 1% higher mean elevation in a region was associated with a 0.002 higher score on the FCOWA measure. With mean regional elevation ranging from sea level to more than 5,000 meters, this could again amount to a substantial effect.
The models in Table 2 add further control variables. This includes the indicator variables for the macroregions of the world as crude controls for unobserved developmental and geographical effects. Here, we also add the subsistence economy and jurisdictional hierarchy variables. Because we are not primarily interested in the correlation of these variables with the FCOWA index, we report the full regression tables in the Appendix (Tables A1 and A2).
OLS Regressions of the FCOWA Measure on Geographical Characteristics.
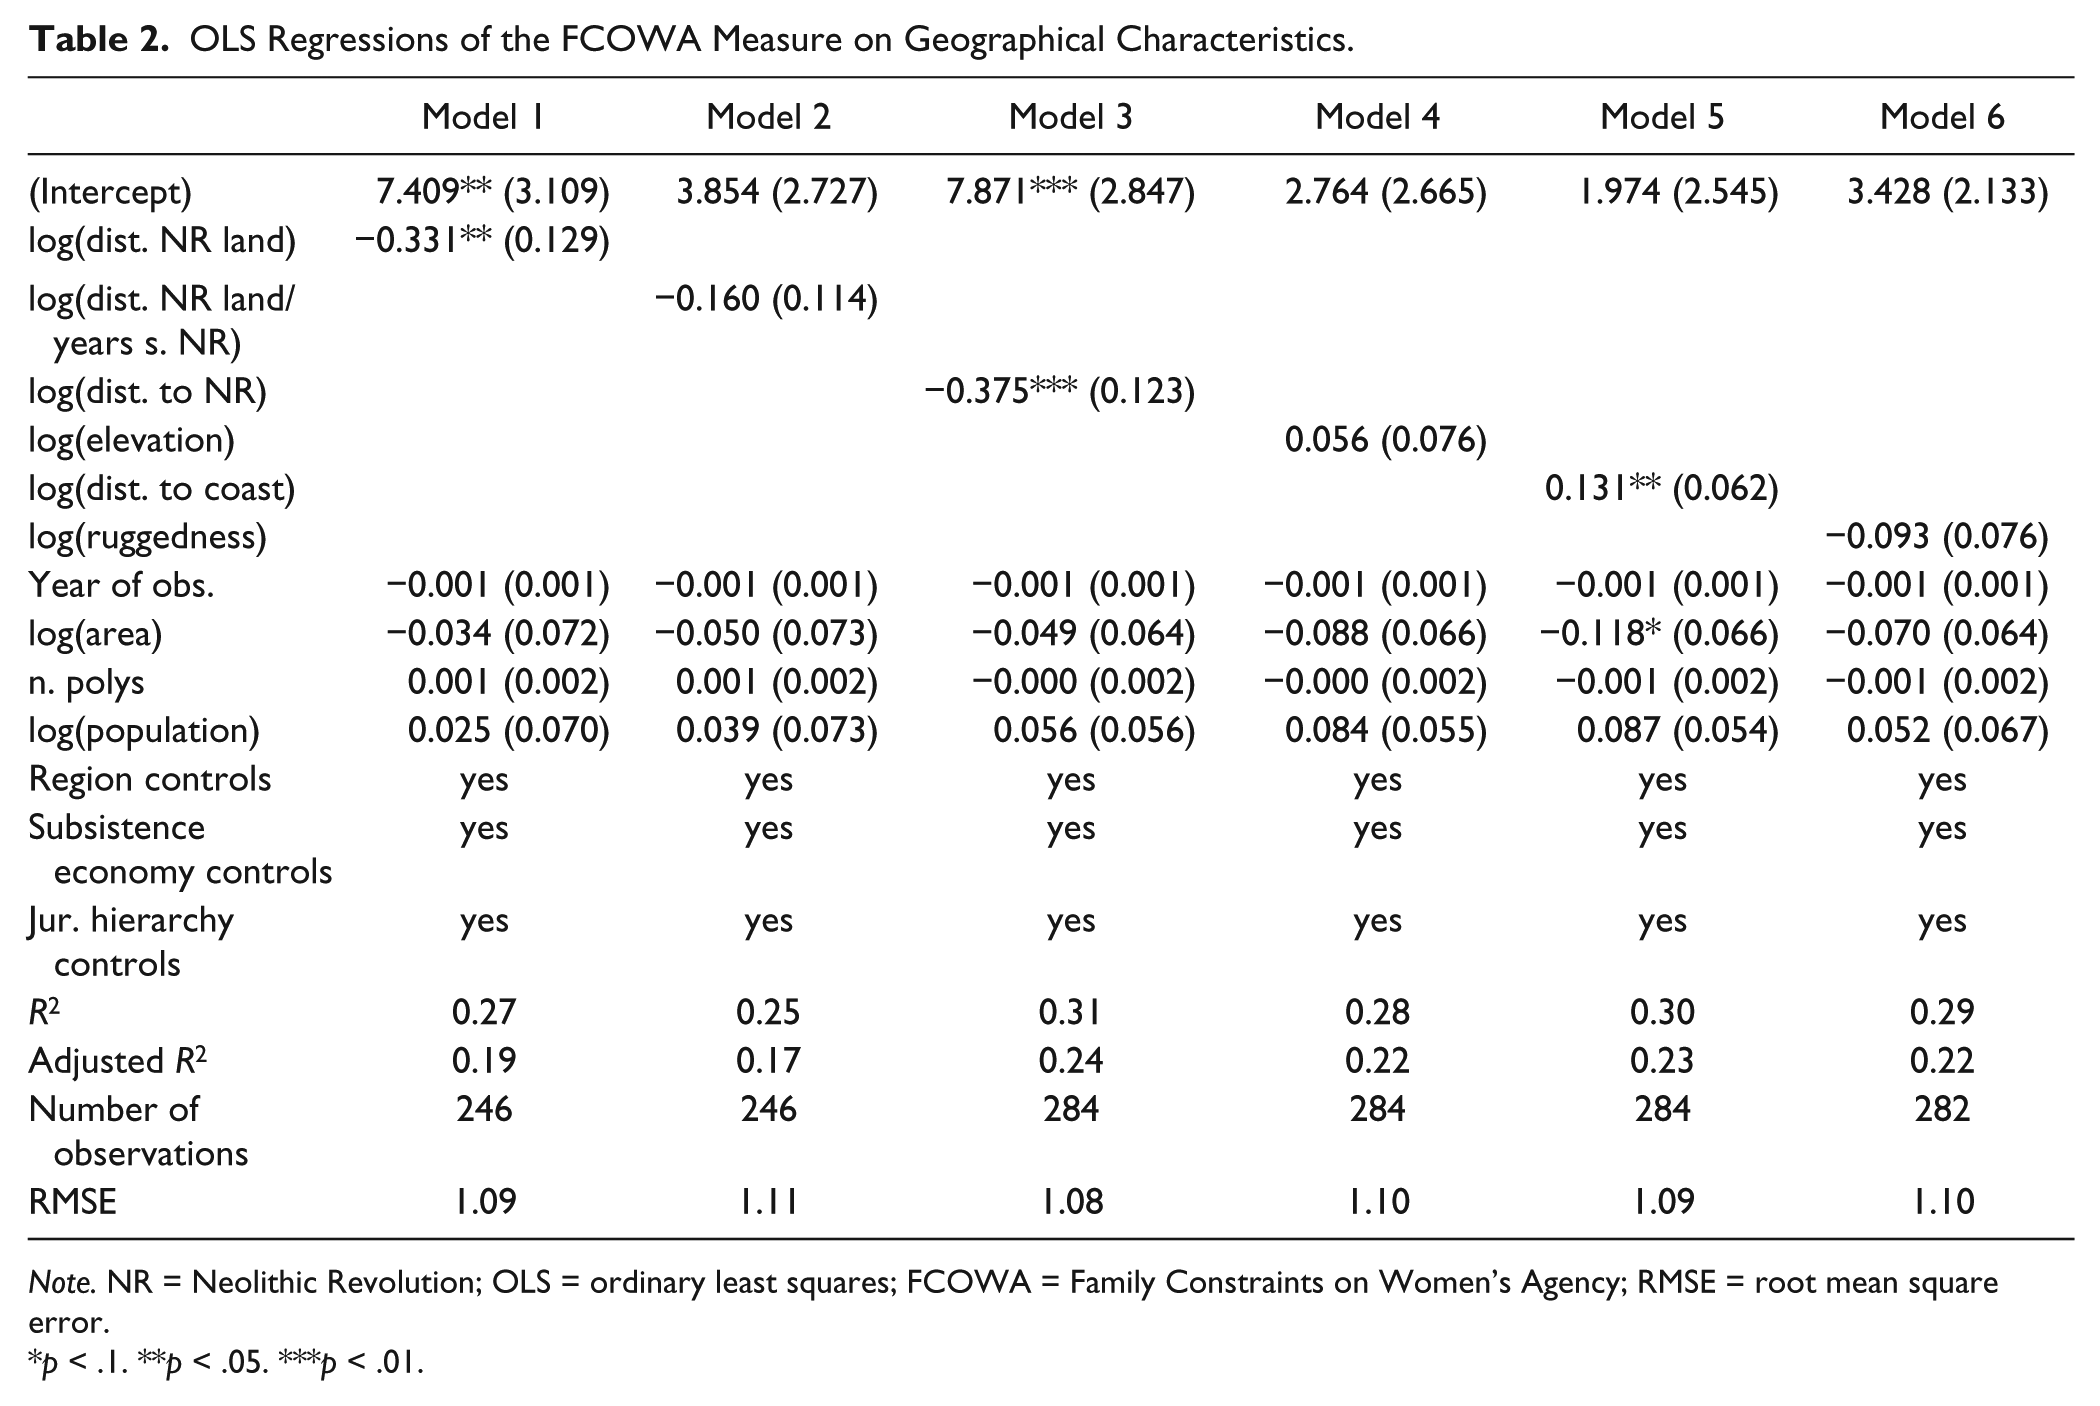
Note. NR = Neolithic Revolution; OLS = ordinary least squares; FCOWA = Family Constraints on Women’s Agency; RMSE = root mean square error.
p < .1. **p < .05. ***p < .01.
Here, we observe that including these controls changes the effects of our variables of interest. Notably, the association of the FCOWA measure with the variables measuring the distance to the Neolithic Revolution and elevation is stronger and more accurately estimated. Moreover, the contradictory effect of distance corrected by duration since the Neolithic Revolution has disappeared. This change is largely due to the inclusion of regional controls. Although we remain cautious about the relation between the sites of origins of agriculture and the existence of FCOWA, it is a factor worth further investigation. The strength of our other geographical variables has lessened as well. Distance to the coast is the one consistent geographical predictor of the FCOWA index. Evidently, part of the global variation in FCOWA can be explained by other factors than geography.
Conclusion
This article had two goals. The first was to present a new subnational dataset on family characteristics to supplement our earlier country-level dataset. At the same time, we explored a number of ideas about the spread of family institutions that constrain women’s agency. Concretely, we investigated the role of the spread of agriculture, the role of being a coastal community or landlocked, and the role of terrain inaccessibility. The choice for these factors was driven by a literature which links the position of women to agricultural developments which themselves are largely driven by geography.
We were able to create such a database based on a combination of Murdock’s Ethnographic Atlas and a digitized, geo-referenced version of the ANM. Doing so resulted in a database of 597 societies spread over 8,952 locations. Although we focused on a number of family characteristics we have previously investigated (Carmichael & Rijpma, in press), this procedure allows us to spatially place any ethnographic variable from Murdock’s Atlas. We think that being able to account for this regional diversity is an improvement over the frequent country-level analyses of Murdock’s data. 18
In our investigation of the distribution of FCOWA, we found some support for the role of the distance to the major centers of plant and animal domestication, with societies further removed showing fewer constraints. Likewise, we found support for an impact of distance to coast, with societies closely located to the sea displaying less FCOWA. However, our measures of terrain inhospitability, elevation, and ruggedness did not show a consistent relation to our measure of FCOWA. Regions with a higher mean elevation showed less female-friendly family institutions, and there was no discernable relationship with ruggedness.
Some caveats to our dataset and these explorative analyses are called for. In previous work, we have critiqued some of the codings in Murdock’s data (Rijpma & Carmichael, 2016). Although our dataset tries to solve the issue of geographic variation at the subnational level, it cannot address this shortcoming. Better matching might also be possible. Although our matching procedure gave us reasonable coverage, future effort to extend it is likely worthwhile. Furthermore, better measures of the timing and location of the agricultural transition for each society are possible. Distance to the major centers of plant and animal domestication is of course a very crude measure. It would be useful to have a more fine-grained measure that, for example, incorporates actual migration patterns in humanity’s early history (Pagani et al., 2016).
Finally, the possibility exists to use the extensive work done on European household and family history to alleviate the poor coverage for Europe in Murdock’s Ethnographic Atlas. Especially promising from this perspective are projects systematically collecting data on households such as the North Atlantic Population Project and the Mosaic Project (Ruggles, Roberts, Sarkar, & Sobek, 2011; Szołtysek & Gruber, 2016). However, such an effort would require changes to our outcome variable. Although some parts of the FCOWA index can probably be measured in this way (polygamy, the existence of extended households and perhaps consanguineous marriage), others such as descent or the presence of clans would have to be reconstructed from the literature. Updating the Ethnographic Atlas in this way has revealed interesting correlations but future research could do more to revisit and revise Murdock’s work to improve our understanding of the cross-cultural patterns of developments we can still observe today.
Footnotes
Appendix
Acknowledgements
We thank Jan Kok and Oded Galor for encouraging us to write this article, the referees and editors of the special issue, Patrick Heady and Mikołaj Szołtysek, for their valuable comments, and Pim de Zwart for his input.
Declaration of Conflicting Interests
The author(s) declared no potential conflicts of interest with respect to the research, authorship, and/or publication of this article.
Funding
The author(s) disclosed receipt of the following financial support for the research, authorship, and/or publication of this article:
The authors worked on a project funded by the Dutch Science Foundation NWO entitled “Gender, Agency and Economic Development in the World Economy, 1850-2000”.