
Abstract
The incidence of enzootic bovine leukosis (EBL), a type of B-cell lymphoma, is increasing in Japan. EBL is caused by bovine leukemia virus (BLV; Retroviridae, Deltaretrovirus bovleu) infection and is diagnosed by detecting antibodies against BLV in milk and blood or BLV DNA in blood. We assessed the feasibility of using stable flies (Stomoxys calcitrans) as a sampling tool to assess BLV infection status in cattle herds. First, we collected blood from 3 cattle herds and, based on the measurement of BLV–proviral load (PVL) by quantitative real-time PCR (qPCR), identified 1) a BLV-free herd, 2) a herd with a low prevalence of BLV-infected cattle and low PVL, and 3) a herd wherein half of the cattle were BLV-infected with low-to-high PVLs. Next, we collected stable flies from the 3 herds, extracted DNA from their blood meals, analyzed it for BLV DNA, and measured the BLV PVL. Cattle DNA and BLV DNA, but not other mammalian DNA, were successfully detected by digestion of the flies. Based on fly blood meal qPCR, we identified one herd as BLV-free and the other 2 herds as having <50% prevalence of BLV-infected cattle with low PVLs. Our fly results were not consistent with preliminary BLV-PVL measurements on cattle blood. Our pilot study indicated that, to assess the feasibility of a stable fly blood meal test as an alternative technique for evaluating BLV infection status in dairy and beef cattle, additional investigations involving more cattle herds and stable flies are needed.
Enzootic bovine leukosis (EBL) is a B-cell lymphoma caused by infection with bovine leukemia virus (BLV; Retroviridae, Deltaretrovirus bovleu). 25 Among BLV-infected cattle, >50% remain healthy throughout their life; however, ~30% develop persistent lymphocytosis, and <5% develop EBL. 6 A nationwide serosurvey of BLV infection in Japan from 2009 to 2011 revealed that the seroprevalence of BLV infection was 28.7% in 9,722 beef breeding cattle and 40.7% in 11,113 dairy cattle. 18 The Ministry of Agriculture, Forestry and Fisheries, Japan, reported that the annual number of EBL cattle was 99 in 1998 and this increased gradually to 4,491 in 2023 16 (Suppl. Fig. 1).
There are no commercial vaccines or therapeutic drugs for BLV infection; thus, countermeasures against BLV infection and EBL development are urgently required. Most western European countries, Australia, and New Zealand have established eradication programs and control measures, which have resulted in negligible BLV infection rates.11,25 However, in Japan, the high prevalence of BLV antibodies makes it impractical to cull all BLV-infected cattle. Worldwide, herd management for BLV is performed by detecting antibodies against BLV in milk and blood using ELISAs and/or BLV DNA in blood using PCR testing. High BLV–proviral load (PVL) levels in cattle blood constitute a risk factor for EBL progression; 9 however, milk does not contribute to the measurement of BLV-PVL in cattle, and milk tests are available only for the detection of antibodies against BLV for dairy cattle herds, but not for beef cattle herds. Consequently, blood collection is still used for the routine detection of antibodies and BLV DNA, and assessment of BLV-PVL.
Stomoxys calcitrans (Diptera, Muscidae), commonly referred to as a stable fly, is a blood-sucking ectoparasite that is globally considered an economically important pest for the livestock industry. Its painful bites disrupt the feeding behavior of livestock and cause direct harm through blood loss, tissue damage, and allergic reactions.12,24 Moreover, stable flies are suspected to play a crucial role in the spread of infectious diseases owing to their potential as mechanical pathogen carriers, particularly in livestock. 2 Stable flies carry pathogens, such as bovine viral diarrhea virus, 4 lumpy skin disease virus, 13 and Anaplasma marginale. 13 In addition, BLV 3 and BLV genes 21 have been detected in stable flies that feed on BLV-infected cattle. We hypothesized that the BLV infection status of cattle herds would be reflected in the blood meals of stable flies. Furthermore, we aimed to determine the feasibility of using stable files as a sampling tool to assess BLV infection status in cattle herds without the need for blood collection.
First, we collected blood from cattle on 3 farms (A–C) in Gifu, Japan, which had ~20, 40, and 80 Holstein cattle, respectively. Hematologic tests, detection of serum antibodies against BLV via ELISA, and measurement of the BLV-PVL (copies/105 WBCs) using quantitative real-time PCR (qPCR) were performed by the Gifu Chuo Livestock Hygiene Service Center (Gifu, Japan), as described previously. 22 Studies have reported that higher activity of serum lactate dehydrogenase (LDH) and/or increased ratios of LDH isozymes 2 and 3 are diagnostic biomarkers for EBL.7,10 Therefore, we had the serum LDH activity and ratio of LDH isozymes analyzed by a clinical testing company (SRL, Tokyo, Japan). Although the percentage of LDH 2 + 3 from 2 of 33 cattle in 2023 on farm B and 2 of 78 cattle in 2023 on farm C increased 50% or more, these 4 cattle did not develop EBL during our study period. BLV infection of cattle on each farm was also confirmed using nested PCR detection of the pX 19 or envelope regions 5 of BLV in the blood (GoTaq hot start green master mix, Promega; Suppl. Table 1).
We detected no BLV-infected cattle on farm A among the 13 cattle tested in 2021 and 18 cattle in 2023 (Fig. 1; Suppl. Table 2). The prevalence of BLV-positive cattle on farm B was 9 of 36 (25%) in 2022 and 6 of 36 (17%) in 2023; on farm C, the prevalence was 51 of 74 (69%) in 2022 and 39 of 78 (50%) in 2023 (Fig. 1A; Suppl. Tables 3, 4). On farm B, most of the BLV-positive cattle were in the lower PVL category (<25,000 copies/105 WBCs), according to a classification described previously, 9 and the cattle with the highest PVL were included in the second PVL category (25,000–50,000 copies/105 WBCs). On farm C, most BLV-positive cattle were in the first PVL category (<25,000 copies/105 WBCs), but some were in the 4 other PVL categories, including the highest PVL category (≥100,000 copies/105 WBCs). Based on the PCR results, each cattle herd was characterized as follows: farm A was BLV-free, farm B had a low prevalence of BLV-infected cattle and low PVL, and on farm C, >50% of the cattle were BLV-infected with low-to-high PVLs (Fig. 1B).
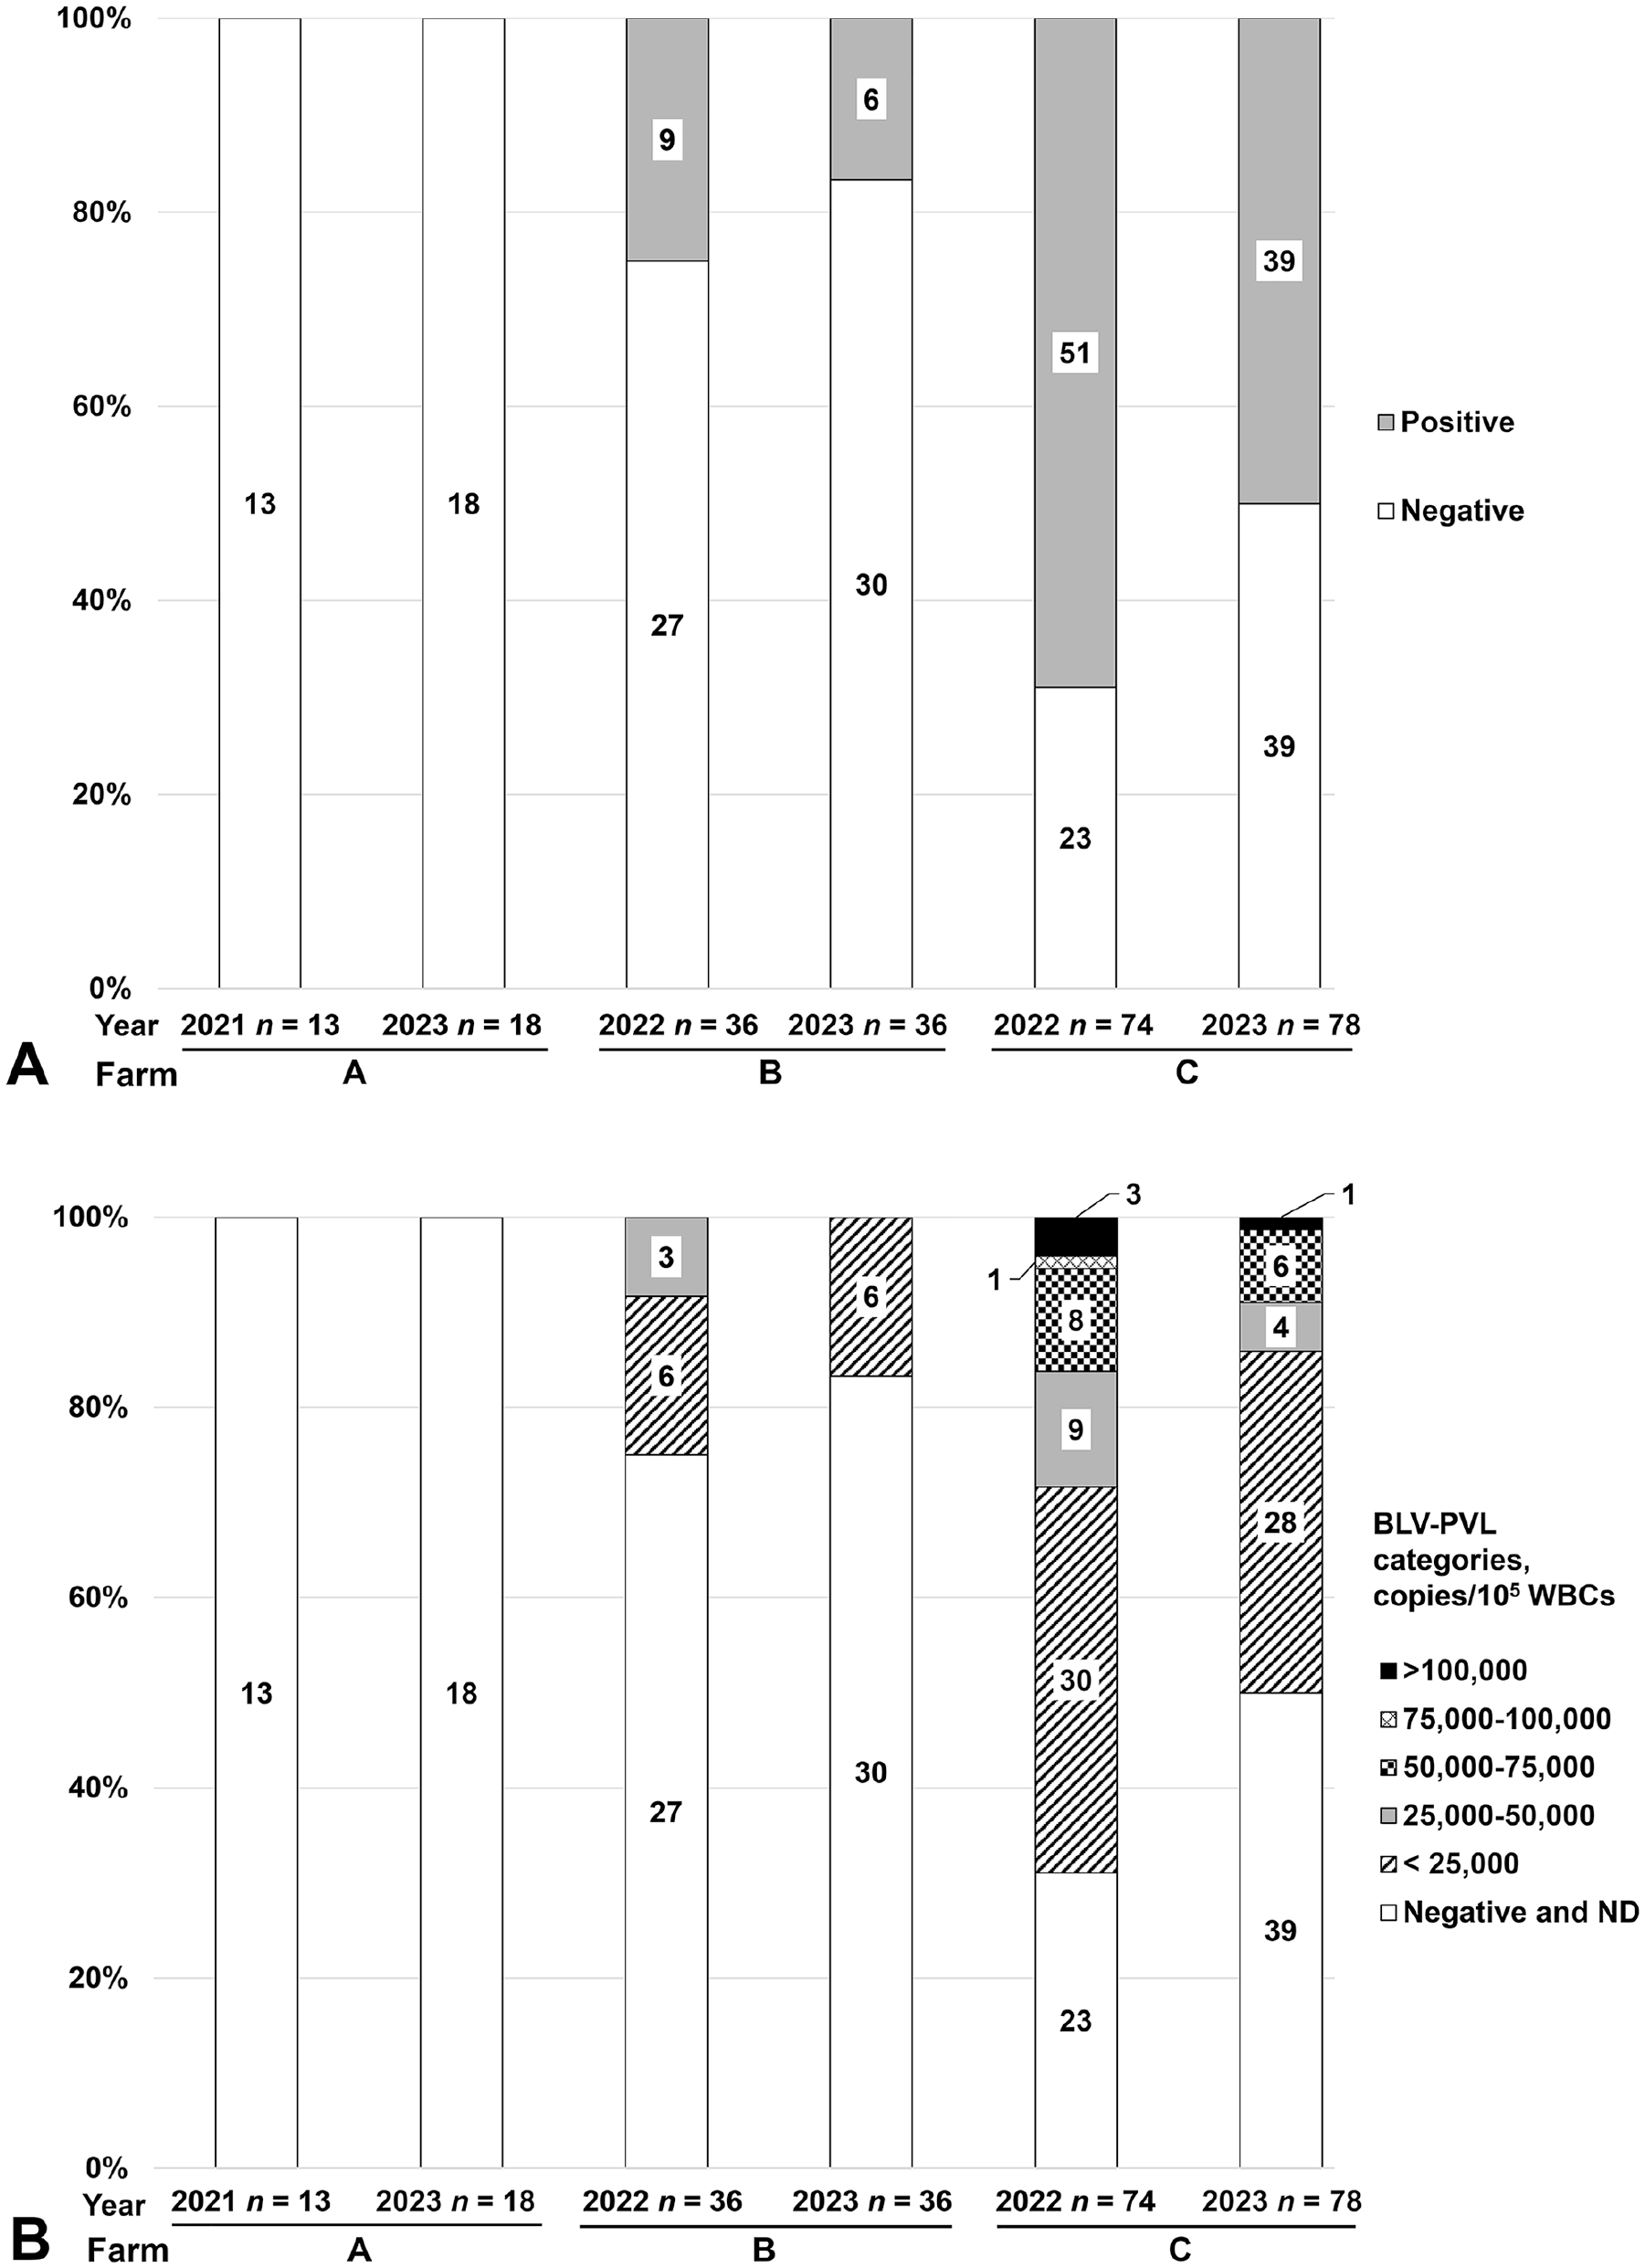
Bovine leukemia virus (BLV) infection status in cattle herds on farms A–C using cattle blood tests. Percentages and absolute numbers of
Next, we captured stable flies (Table 1) on the bodies of the cattle and inside the barns of each farm using a butterfly net. To avoid viral contamination, new butterfly nets were used for each farm and sampling period. The flies were transferred to our laboratory on the same day, and precautions were taken to prevent secondary viral pollution during sample delivery or preparation. All flies collected in plastic bags were killed by placing them in a −80°C freezer, followed by subsequent storage at −30°C. Captured flies were pooled and placed into 15 mL tubes, and the body surfaces of the flies were rinsed with 2 mL of PBS by gently rotating the tube for 10 min without crushing or releasing their bodily fluids. Then, the flies were crushed using sterile cotton swabs. The crushed liquid was filtered using 1.0- and 0.45 μm pore filters (Merck Millipore), and the filtrate was centrifuged at 20,400 × g for 1 h at 25°C. Total DNA was extracted from 200 μL of the lower layer after centrifugation (DNeasy blood & tissue kit; Qiagen), according to the manufacturer’s instructions.
Blood origin, nested PCR, and qPCR analyses of stable fly blood meals.
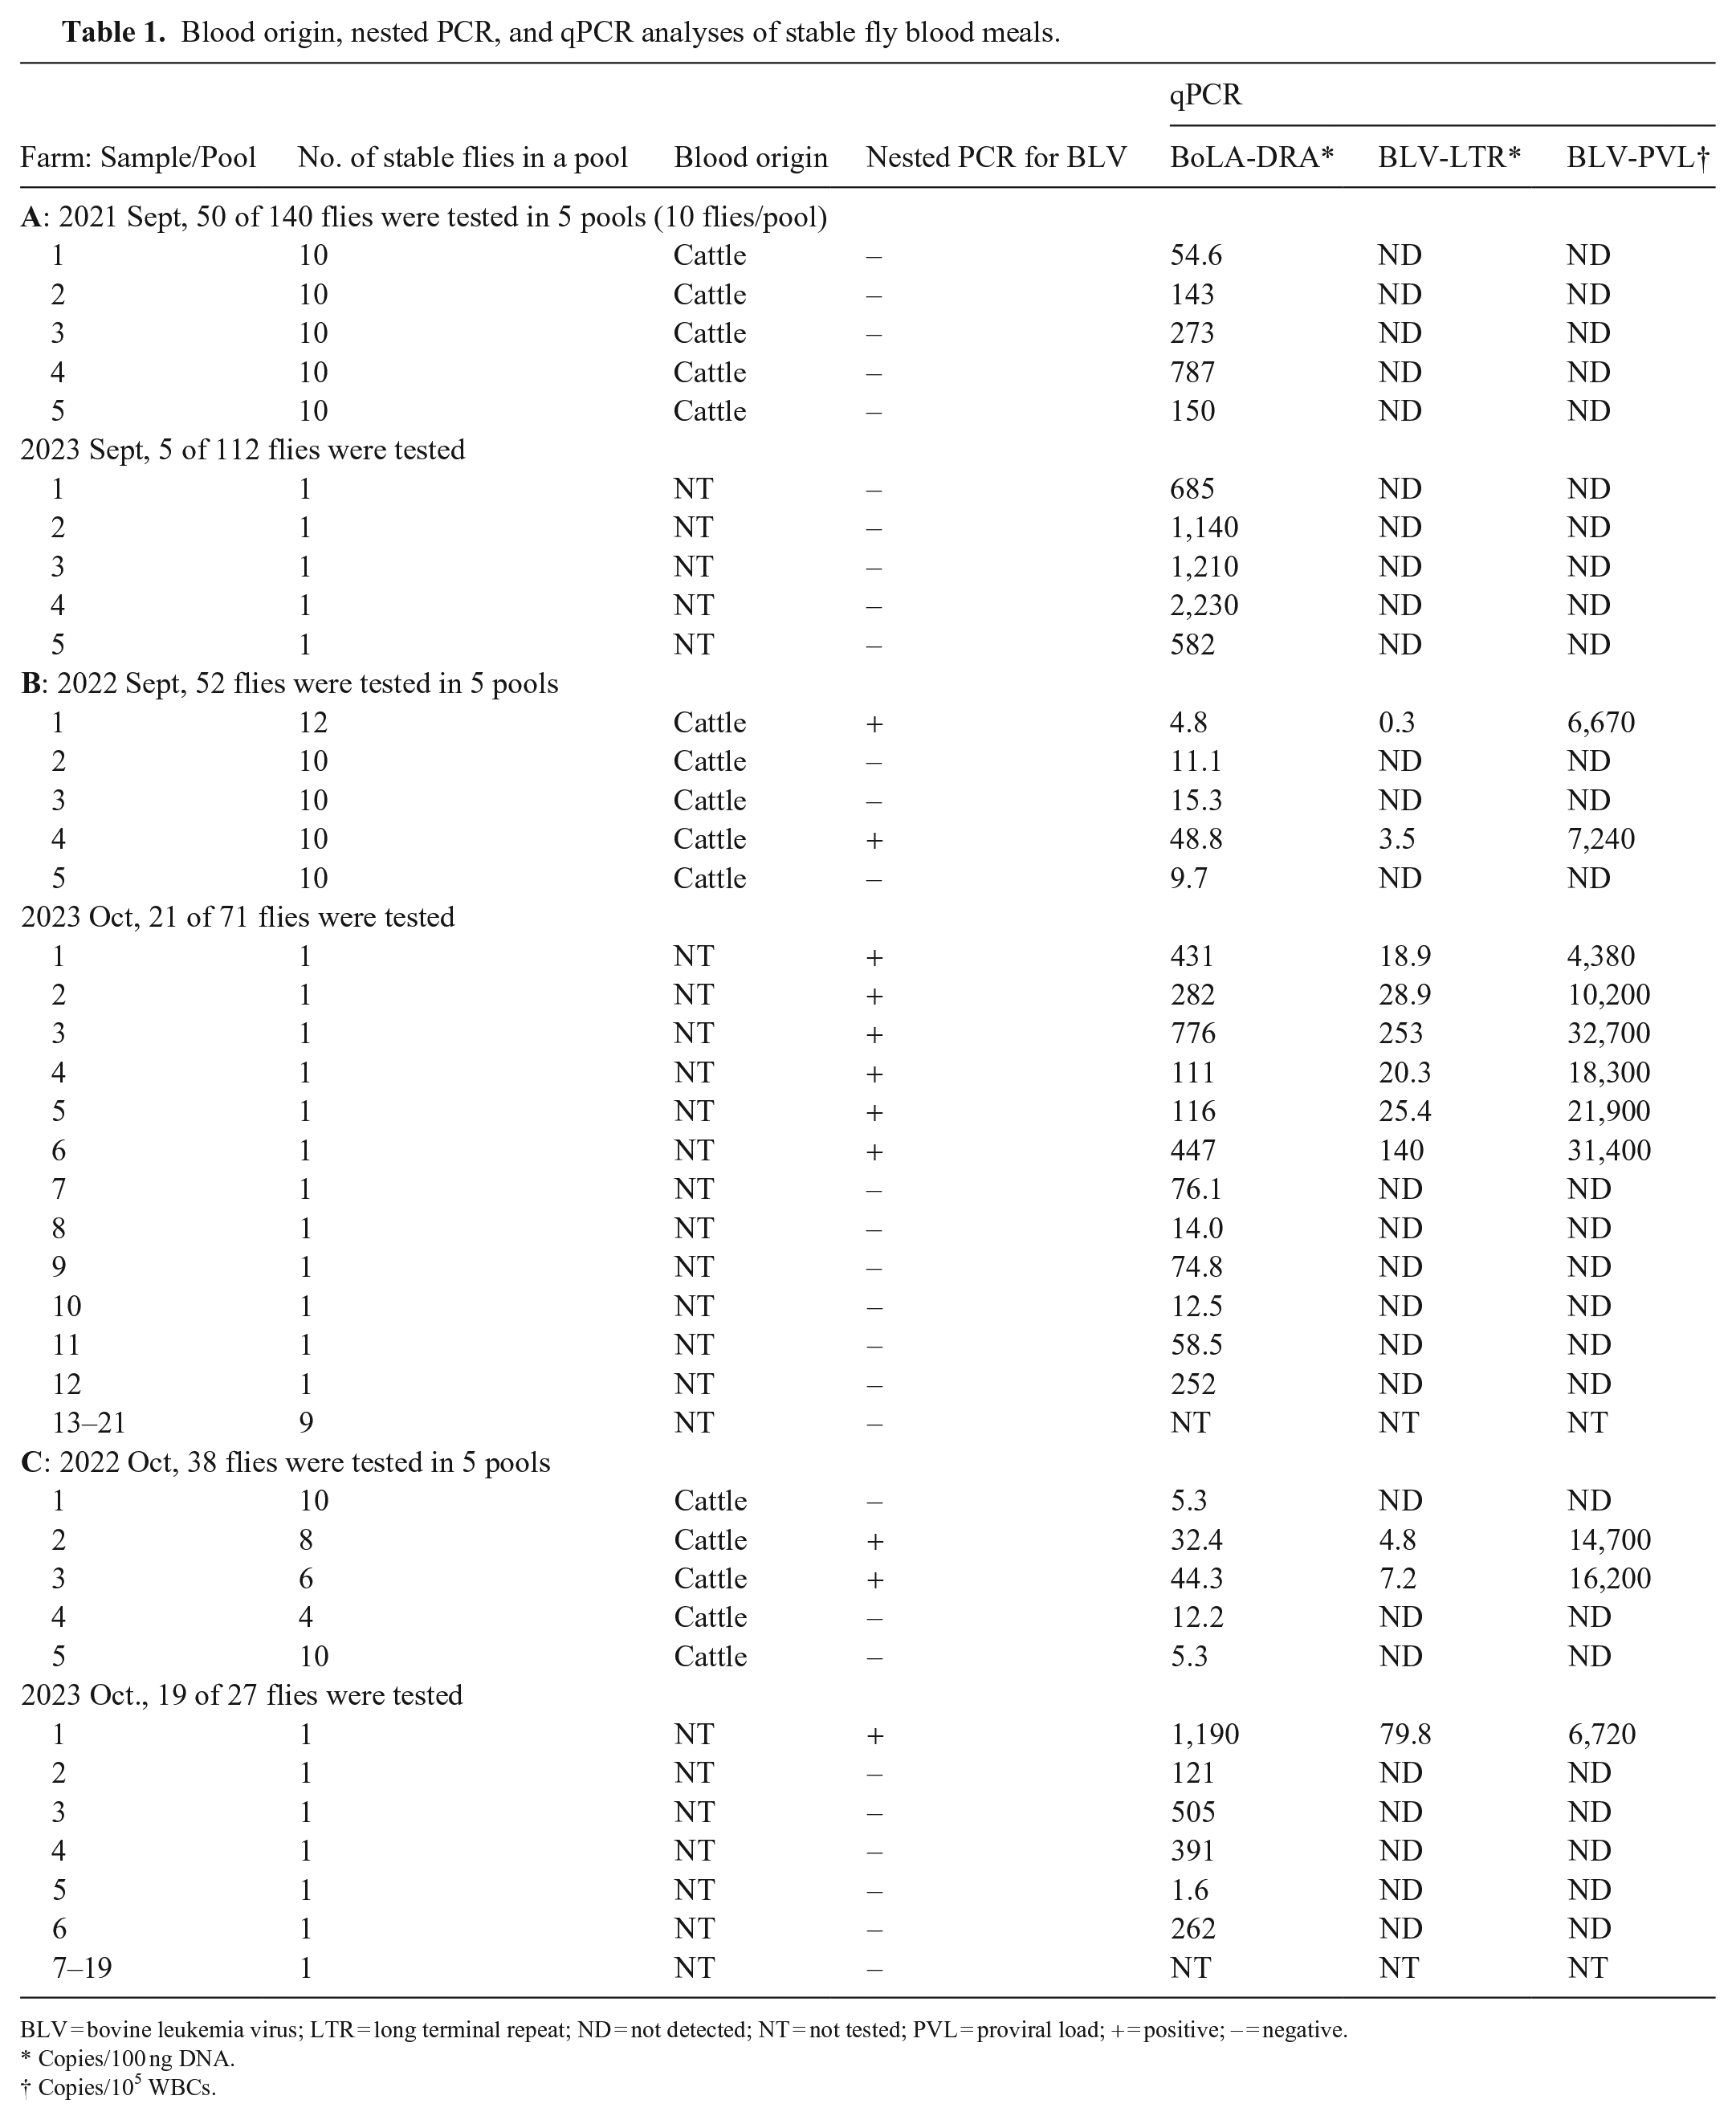
BLV = bovine leukemia virus; LTR = long terminal repeat; ND = not detected; NT = not tested; PVL = proviral load; + = positive; – = negative.
Copies/100 ng DNA.
Copies/105 WBCs.
To determine the origin of the stable fly blood meals, a multiplex PCR assay was performed, as described previously. 17 Briefly, the mitochondrial DNA (mtDNA) copy number of each extracted DNA sample was quantified using a universal primer set that amplified a conserved region of the 16S rRNA gene in vertebrates (SmartCycler II system; Cepheid). Multiplex PCR was performed (Multiplex PCR assay kit v.2; Takara Bio) in a 25 µL reaction mixture containing 5,000 copies of sample DNA in an iCycler (Bio-Rad; Suppl. Table 5). Multiplex PCR products were analyzed (3500xL Genetic Analyzer with a 36 cm array and POP-4 polymer; Thermo Fisher), and the results were analyzed with GeneMapper ID-X software v.1.4 (Thermo Fisher) with a peak amplitude threshold of 175 RFU and customized panel and bin sets. The origin of the blood meal in all DNA samples was successfully determined (Table 1; Suppl. Table 6); for all farms, we tested for 21 other mammalian species, and only cattle DNA was detected in the stable fly blood meals. The distance between the capture location and the target animal intended for evaluation is crucial when using stable fly blood meals. Studies have shown that when stable flies are captured near locations with different types of livestock 20 or in zoos, 14 genes from various animal species are detected in their blood meal. We had captured stable flies inside barns extremely close to the cattle, leading to the detection of only cattle genes in their blood meals.
We captured 140 stable flies in 2021 and 112 in 2023 on farm A, 52 in 2022 and 71 in 2023 on farm B, and 38 in 2022 and 27 in 2023 on farm C (Table 1). To verify the feasibility of using stable flies for the detection of cattle and BLV DNA, blood meal DNA was extracted from pooled flies, as described above, or from a single fly. For single-fly samples, 1 mL of PBS was added to the fly before crushing with sterile toothpicks. After removing the fly body, the blood color of the crushed liquid was confirmed (Suppl. Table 7). Preliminary tests examined for BoLA-DRA, the bovine internal control DNA, in blood meal DNA extracted from pooled flies (1, 5, or 10 flies) captured on farm A. Using qPCR analysis, pooled and single samples had detectable levels of BoLA-DRA in the blood meals, indicating that they could be used for BLV DNA detection. BoLA-DRA was detected in DNA extracted from crushed liquid samples with visible blood color, but not from colorless samples (Suppl. Table 7), indicating successful extraction of cattle DNA only from visibly colored blood meal samples. In preliminary experiments, pooled samples containing both visible and colorless blood tended to contain low amounts of BoLA-DRA (Suppl. Table 7). BoLA-DRA was detected ~8.8-fold more often in single samples with visible blood color than in pooled samples (Suppl. Fig. 2). Therefore, only blood meal liquid samples with visible blood color were selected, and their extracted DNA was used to detect the origin of the blood meal source and to measure BLV-PVL. As a result, of 140 flies captured in 2021 and 112 flies in 2023 on farm A, 50 flies in 5 pools (10 flies per pool) and 5 flies were tested, respectively (Table 1). For farm B, of 52 flies captured in 2022 and 71 flies in 2023, all 52 flies in 5 pools (10–12 flies per pool) and 21 flies were tested (Table 1). For farm C, of 38 flies captured in 2022 and 27 flies in 2023, all 38 flies in 5 pools (4–10 flies per pool) and 19 of 27 flies were tested (Table 1).
Blood color was confirmed in all 15 pooled samples (5 pooled samples for each farm). For single samples, 5 flies with deep blood color among the 112 flies captured on farm A were used for PCR and qPCR. Blood color was confirmed in 21 of the 71 flies from farm B and 19 of the 27 flies from farm C, and these samples were selected for PCR. BLV-PVL was measured using a 5 µL template DNA sample from the fly blood meal via qPCR (StepOne Plus analytical thermal cycler; Applied Biosystems), according to the manufacturer’s instructions. The reaction mixture contained 10 µL of Thunderbird probe qPCR mix (Toyobo), 0.3 µL of CoCoMo-BLV primer/probe (Nippon Gene), 5 µL of a template DNA sample, and PCR-grade water to make the volume up to 20 µL. PVL was calculated using the following formula: (no. of BLV long terminal repeat [LTR] copies/number of BoLA-DRA copies) × 105 WBCs. The data were analyzed for significance using the Mann–Whitney U test and Kruskal–Wallis H test (p ≤ 0.05). All statistical analyses were performed using EZR software (v.1.64). 8
The prevalence of BLV DNA in blood meals, as determined using PCR, varied for each farm (Table 1). The BLV-positive blood meals on farms A, B, and C were 0 of 5, 2 of 5, and 2 of 5 for pooled samples, respectively, and 0 of 5, 6 of 21, and 1 of 19 for single samples, respectively (Fig. 2A). For farm C, the BLV-positive cattle were 51 of 74 cattle (69%) in 2022 and 39 of 78 cattle (50%) in 2023, as determined by PCR using cattle blood (Fig. 1A), whereas that of BLV-positive blood meals was low at 2 of 5 pooled samples and 1 of 19 single samples. Moreover, based on the results of the BLV-PVL blood meal tests, each herd was characterized as follows: farm A was a BLV-free herd, and farms B and C were herds with a prevalence of less than half of BLV-infected cattle, 6 of 21 and 1 of 19 single samples in farms B and C (Fig. 2A), respectively, and low PVL (Fig. 2B), which was inconsistent with the BLV infection statuses determined using the cattle blood tests. This discrepancy in the BLV infection status in cattle herds between cattle blood tests and blood meal tests could be caused by DNA degradation in flies.
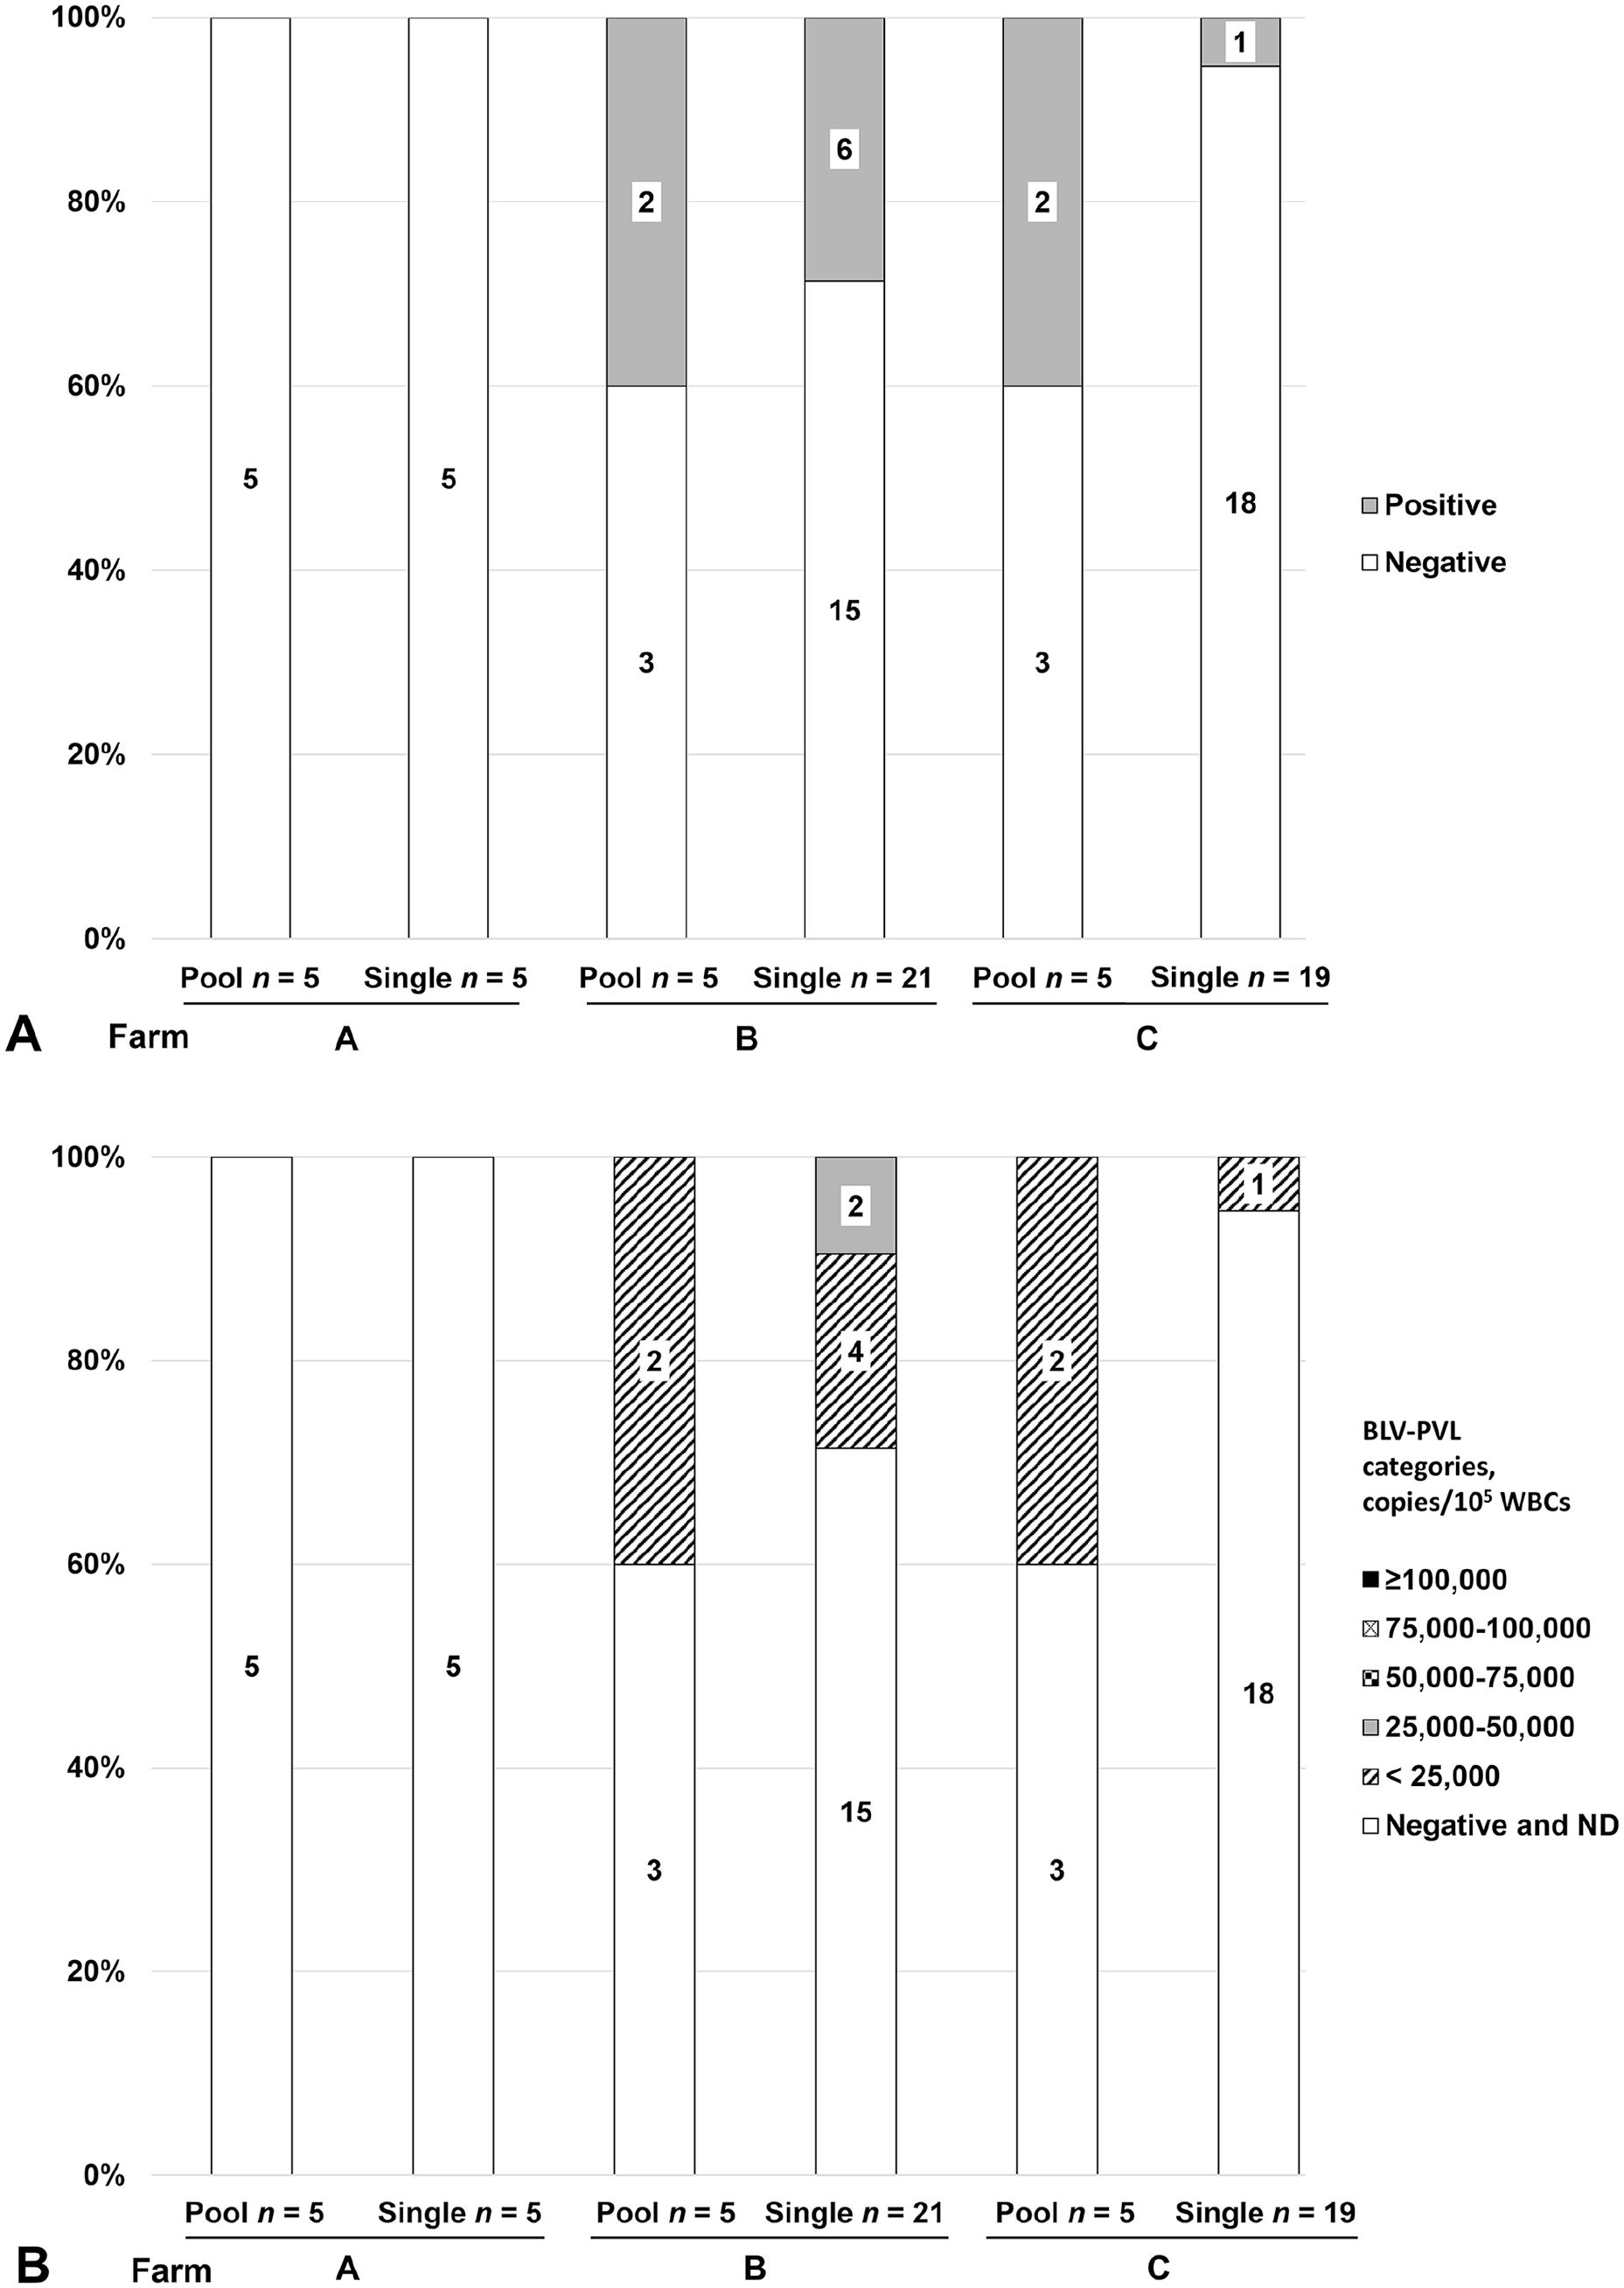
Detection of bovine leukemia virus (BLV) DNA and the measurement of BLV–proviral load (PVL) in the blood meals of flies. Percentages and absolute numbers of
Comparing the detected amounts of BoLA-DRA among farms, farm A had significantly higher amounts, ~8.5- and 14.3-fold, than farms B and C, respectively (Suppl. Fig. 3). It has been difficult to discern the stage of the digestive cycle when using blood meals from field-captured flies. 20 Farm A was on the university campus; farms B and C were 15 and 35 km distant, respectively. These results indicate that the delayed processing for farms B and C may have led to DNA degradation in the blood meals via fly digestion. In addition, stable flies have been reported to fly 29 km in 24 h. 1 Others 23 indicated that 50% of adult stable flies dispersed beyond 1.6 km from their natal sites on farms, suggesting that stable flies could fly to neighboring farms. However, it is considered that, once stable flies find hosts, most tend to remain close to the hosts for several days.1,23 Moreover, phylogenetic analysis of BLV using 1,823 cattle from 117 farms in 2 adjacent districts demonstrated that genetically distinct BLV strains were spread on each farm. 15 Therefore, horizontal transmission of BLV between neighboring farms by stable flies that fly between farms should occur only rarely. Further study is needed to determine whether blood meals from captured flies are derived only from cattle on the sampled farm.
Supplemental Material
sj-pdf-1-vdi-10.1177_10406387241293081 – Supplemental material for Use of blood meals from stable flies to evaluate the bovine leukemia virus infection status in cattle herds: a pilot study
Supplemental material, sj-pdf-1-vdi-10.1177_10406387241293081 for Use of blood meals from stable flies to evaluate the bovine leukemia virus infection status in cattle herds: a pilot study by Kaori Shimizu, Chikahiro Mori, Ayaka Okada and Yasuo Inoshima in Journal of Veterinary Diagnostic Investigation
Footnotes
Acknowledgements
Declaration of conflicting interests
The authors declare no potential conflicts of interest with respect to the research, authorship, and/or publication of this article.
Funding
This study was partly supported in part by JSPS KAKENHI (21H02357, 22F22097, 22KF0161, 23K21269), Morinaga Foundation for Health and Nutrition, and Kobayashi Foundation.
Supplemental material
Supplemental materials for this article are available online.
References
Supplementary Material
Please find the following supplemental material available below.
For Open Access articles published under a Creative Commons License, all supplemental material carries the same license as the article it is associated with.
For non-Open Access articles published, all supplemental material carries a non-exclusive license, and permission requests for re-use of supplemental material or any part of supplemental material shall be sent directly to the copyright owner as specified in the copyright notice associated with the article.