
Abstract
Viscoelastic testing methods, including thromboelastography (TEG) and rotational thromboelastometry, have an advantage over traditional tests of coagulation due to their ability to reflect in vivo hemostasis and predict need for transfusion of blood products more accurately. TEG in clinical settings is most often performed on citrated whole blood samples that are recalcified at the time of analysis, with or without the addition of an activator of coagulation. To date, superiority of the use of an activator in canine patients with abnormal hemostasis has not been demonstrated. We compared the use of tissue factor–activated (TF) TEG with citrated native (CN) TEG in dogs with suspected hemostatic abnormalities. Forty-five of 79 enrolled dogs with suspected abnormal hemostasis had an abnormal MA value. There was very high correlation between CN samples and TF-activated samples for alpha, K, MA, and R; there was a high correlation for LY30 and LY60. Categorical agreement for CN- and TF-activated TEG classification of hypercoagulable and hypocoagulable cases based on MA was good to very good, with 91% and 97% categorical agreement, respectively. No difference was found in the variance for any TEG variable between the 2 methods of analysis. For canine patients with suspected abnormal hemostasis, use of CN or TF-activated TEG appears acceptable. Monitoring of coagulation should be done with the same method; methods may not be used interchangeably.
Rapid assessment of hemostasis is an essential tool for veterinary clinicians treating patients with a wide variety of conditions leading to hemorrhage or thrombosis. Viscoelastic testing (VET) methods, including thromboelastography (TEG) and rotational thromboelastometry (ROTEM), provide a more global assessment of the coagulation system and better represent the cell-based model of hemostasis compared with traditional tests, such as prothrombin time and activated partial thromboplastin time. Additionally, VET methods provide a more detailed assessment of various components of the coagulation system, identifying specific abnormalities, such as in thrombin formation, fibrin generation, platelet function, and fibrinolysis. 5 Conventionally, therapy in a bleeding patient relies on a ratio of blood component transfusions, including red blood cells, plasma, and platelets; however, there is concern that component therapy based solely on clinician discretion may result in excessive use of blood products. 17 In an effort to reduce morbidity and mortality associated with excessive transfusions as well as reduce unnecessary consumption of a limited resource, goal-directed therapy has become an alternative approach to a bleeding patient, and VET has been incorporated in transfusion protocols in a number of patient populations, such as severely traumatized patients, patients undergoing surgery or invasive procedures, and patients with liver disease. 16 In these patients, there is considerable evidence that using VET-guided protocols decreased both morbidity and blood product use.8,14,20,22
VET methods are becoming more widely available to veterinary practitioners, yet these tests are complex in their methodology, and various techniques can produce different results. The ideal methodology for performing these tests is still unknown and likely depends on the hemostasis factor of interest. Comparison of TEG results derived from various methods of sample handling, including anticoagulation and activation, is questionable, as different methods produce values that may not be directly comparable. The gold standard sample for performing TEG is considered to be fresh whole blood as all other methods will alter the coagulation process to preserve the sample; however, fresh whole blood for TEG must be analyzed immediately after sample collection to yield accurate results 3 ; consequently, fresh whole blood is an impractical sample choice for most clinical scenarios in both human and veterinary medicine. To make the assay more clinically applicable, TEG can be performed on a sample of citrated whole blood with the addition of calcium to the sample to initiate coagulation. 2 Further, addition of specific activators can be used to enhance in vitro clot formation enabling analysis of various coagulation factors given that such activators will initiate different pathways in the coagulation process.
The most commonly used activators include tissue factor to assess the extrinsic pathway or kaolin to assess the contact activation pathway.19,21 Choice of activator or even the combination of the tissue factor and kaolin can alter results, with some authors suggesting that the combination of activators may mask subtler endogenous coagulation processes in trauma or hypocoagulable patients. 20 Of further clinical significance, use of activators may also decrease the time to completion of the assay, making results available to the clinician faster to facilitate guidance of emergency treatment, particularly in the setting of massive transfusions.14,20
In 2014, the Partnership on Rotational ViscoElastic Test Standardization (PROVETS) published guidelines on VET for veterinary patients and identified gaps in available evidence. 13 One of the questions set forth by the panel was whether use of various activators altered results compared with citrated samples that are not activated, particularly in patients with hemostatic abnormalities. Based on the evidence available at the time of publication of the guidelines, it was recommended to use an activator because multiple studies had found a lower variability in results in assays using an activator compared to assays using recalcification of citrated samples alone. However, no cited studies specifically examined the effects of activators on TEG results in dogs with hemostatic abnormalities. In our search of Google, PubMed, and Web of Science with the terms “tissue factor”, “thromboelastography”, “citrated native”, and “canine”, we retrieved no published study comparing the results of tissue factor–activated TEG (TF-TEG) with the results of non-activated citrated native blood TEG (CN-TEG) in canine patients with clinically suspected abnormal hemostasis. We hypothesized that 1) TF-TEG and CN-TEG would yield similar categorical results and that correlations in the TEG values would be similar in hypercoagulable and coagulopathic cases, 2) the classification of patients as hypercoagulable, normal, or coagulopathic would be similar between the 2 analytic methods, and 3) there would be greater variability in the citrated native results compared to the tissue factor–activated results.
Materials and methods
Animals
Our study was approved by the University of Pennsylvania (Philadelphia, PA, USA) Institutional Animal Care and Use Committee and the Matthew J. Ryan Veterinary Hospital of the University of Pennsylvania (MJR-VHUP) Privately Owned Animal Protocol Committee. Dogs >4 kg were enrolled in the study if the primary clinician suspected an altered hemostatic status, whether hypocoagulability or hypercoagulability. All dogs were enrolled after informed owner consent was obtained. No attempt was made to discriminate based on signalment, underlying disease process contributing to the hemostatic derangement, or therapeutics administered, including blood products. Patients were excluded if it was not possible to obtain the required blood sample due to temperament, difficulty with venipuncture, or if the owner or primary clinician did not consent to the study due to perceived risks to the patient. Demographic data were collected including patient sex and neuter status, age, breed, and weight.
Blood collection and sample handling
Sample collection and processing for TEG analysis followed the published PROVETS guidelines. 13 Blood was obtained via direct venipuncture or sampling catheter. Direct venipuncture was performed from a jugular or peripheral vein with a 22-gauge needle attached to a 3-mL syringe. For patients with indwelling blood sampling catheters, the following technique was used: the port was disconnected, and a 5-mL pre-sample was collected using two 3-mL syringes containing 0.5 mL of 0.9% NaCl with 1 IU/mL of heparin. The study sample was then collected from the port using a 3-mL syringe. The pre-sample volume was returned to the patient, and the catheter was flushed with 2 mL of 0.9% NaCl. With either method, 1.8 mL of blood was collected and immediately transferred into a 1.8-mL tube containing 3.2% sodium citrate. The tube was inverted 4 times and allowed to rest for 30 min at room temperature (21 ± 2°C).
Thromboelastography
Analysis with TEG was performed (2-channel 5000 series TEG analyzer; Haemonetics) to acquire the parameters: alpha angle, kinetic time (K time), maximum amplitude (MA), percent lysis at 30 min and 60 min after MA (LY30 and LY60, respectively), and reaction time (R time). For each sample, 2 concurrent TEG analyses were performed on the 2 channels of the same machine, 1 with tissue factor added as activator (TF-TEG), and 1 sample with no activator added (i.e., the citrated native sample [CN-TEG]). TEG was performed 30 min after sample collection. For the TF assay, tissue factor was used as an activator at a dilution of 1:3,600 with N-2-hydroxyethylpiperazone-N-2-ethanesulfonic acid (HEPES) buffer solution (Thermo Fisher). Ten microliters of tissue factor solution and 20 µL of 0.2 M calcium chloride were added to the plain TEG cup; after rest time of 30 min, the tube of blood was inverted 5 times, 330 µL of blood were pipetted into the cup, and the TEG test was initiated. For the CN assay, 20 µL of 0.2 M calcium chloride were added to the cup, 340 µL of blood were pipetted into the cup, and the TEG test initiated. The test was allowed to run until completion of the LY60 variable.
Statistical analysis
A commercial software program (STATA/IC, v.16.1; StataCorp) was used for statistical analyses. The Shapiro–Wilk test was used to assess continuous variables for normality. Descriptive statistics consisted of the median and range for all continuous variables as all variables were not normally distributed. The count and percentage (%) were used to report frequency data. For all comparisons, p ≤ 0.05 was considered statistically significant.
Method comparison of individual TEG variables
Method comparison to evaluate CN-TEG– and TF-TEG–generated variables for categorical agreement was performed using Lin concordance correlation coefficients (CCCs), Pearson correlation coefficients, and Bland–Altman (BA) plots. BA analysis calculated both the bias and 95% CIs between CN-TEG and TF-TEG variables with TF activation as sample referent. Normality of the differences were not normally distributed. As a result, the 2.5% and 97.5% percentiles of the differences were obtained by a quantile estimation and reported as nonparametric limits of agreement. Pearson correlation coefficients were interpreted as follows: 0.9–1 = very high correlation, 0.70–0.89 = high correlation, 0.50–0.69 = moderate correlation, 0.30–0.49 = low correlation, and <0.30 = little, if any, correlation. 23 Lin CCCs were interpreted as follows: >0.99 = almost perfect, 0.95–0.99 = substantial, 0.90–0.95 = moderate, <0.90 = poor. 6 A 2-sample t-test was subsequently performed to compare Lin CCCs between CN-TEG and TF-TEG for each abnormal coagulation state, hypercoagulable and hypocoagulable, against all dogs to evaluate the performance of different TEGs in these subpopulations of patients.
Method comparison of classification as hypercoagulable, normal, or hypocoagulable
CN-TEG and TF-TEG samples were classified as hypercoagulable if the MA was above the high end of the established RIs for that method and hypocoagulable if the MA value was lower than the low end of the established RIs. 4 Hypercoagulable and hypocoagulable samples were compared between CN-TEG and TF-TEG samples using a McNemar test. Correlation analysis was repeated among hypercoagulable and hypocoagulable subgroups, and pairwise correlations were assessed for significant differences between groups using a 2-sample t-test. Given limited variability in lysis data among groups, lysis parameters were further classified as a lysis index result >3% for LY30 and >7% for LY60. Lysis was then compared between CN-TEG and TF-TEG samples for both hypercoagulable and coagulopathic subgroups using a McNemar test. Sensitivity and specificity were calculated for the CN-TEG classification of cases as hypercoagulable or coagulopathic, with TF-TEG samples serving as reference standard. Receiver operating characteristic (ROC) curves and the area under the curve were assessed graphically.
Method comparison of the degree of variability in results
A Brown–Forsythe test was used to assess the equality of variances between CN-TEG and TF-TEG variables.
Results
We enrolled 79 dogs in our study, including patients representing a wide range of signalments and with various hemostatic abnormalities (Tables 1–3). Breeds included 21 mixed-breed dogs, 5 Golden Retrievers, 4 Labrador Retrievers, 4 Pembroke Welsh Corgis, 4 German Shepherds, 3 Beagles, 3 Chihuahuas, 2 Boxers, 2 Great Danes, 2 Australian Shepherds, 2 Miniature Schnauzers, and 1 each of the following breeds: American Bulldog, Staffordshire Bull Terrier, Basset Hound, Belgian Malinois, Bernese Mountain Dog, Bichon Frise, American Bull Terrier, Chesapeake Bay Retriever, Chinese Crested Dog, Chow Chow, Collie, Dachshund, Doberman Pinscher, German Shorthair Pointer, Irish Setter, Malamute, Maremma Sheepdog, Miniature Poodle, Newfoundland Dog, Pug, Redbone Coonhound, Rhodesian Ridgeback, Saint Bernard, Shih Tzu, Soft-Coated Wheaten Terrier, Toy Poodle, and West Highland White Terrier.
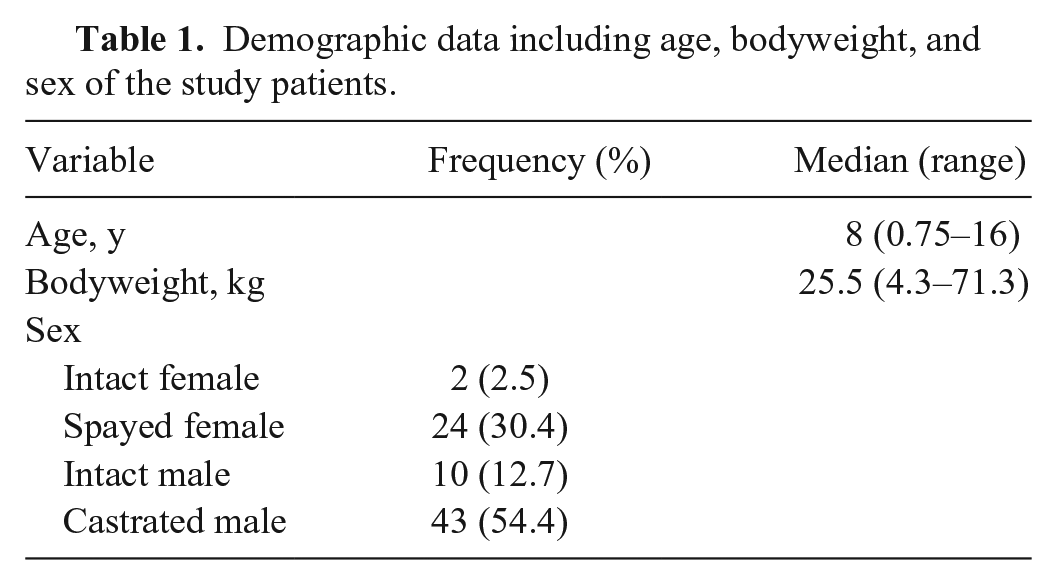
Demographic data including age, bodyweight, and sex of the study patients.
Summary of thromboelastography (TEG) results including median (range in parentheses) derived using both non-activated citrated native (CN) and tissue factor (TF) methodology for all patients, for hypocoagulable patients, and for hypercoagulable patients.
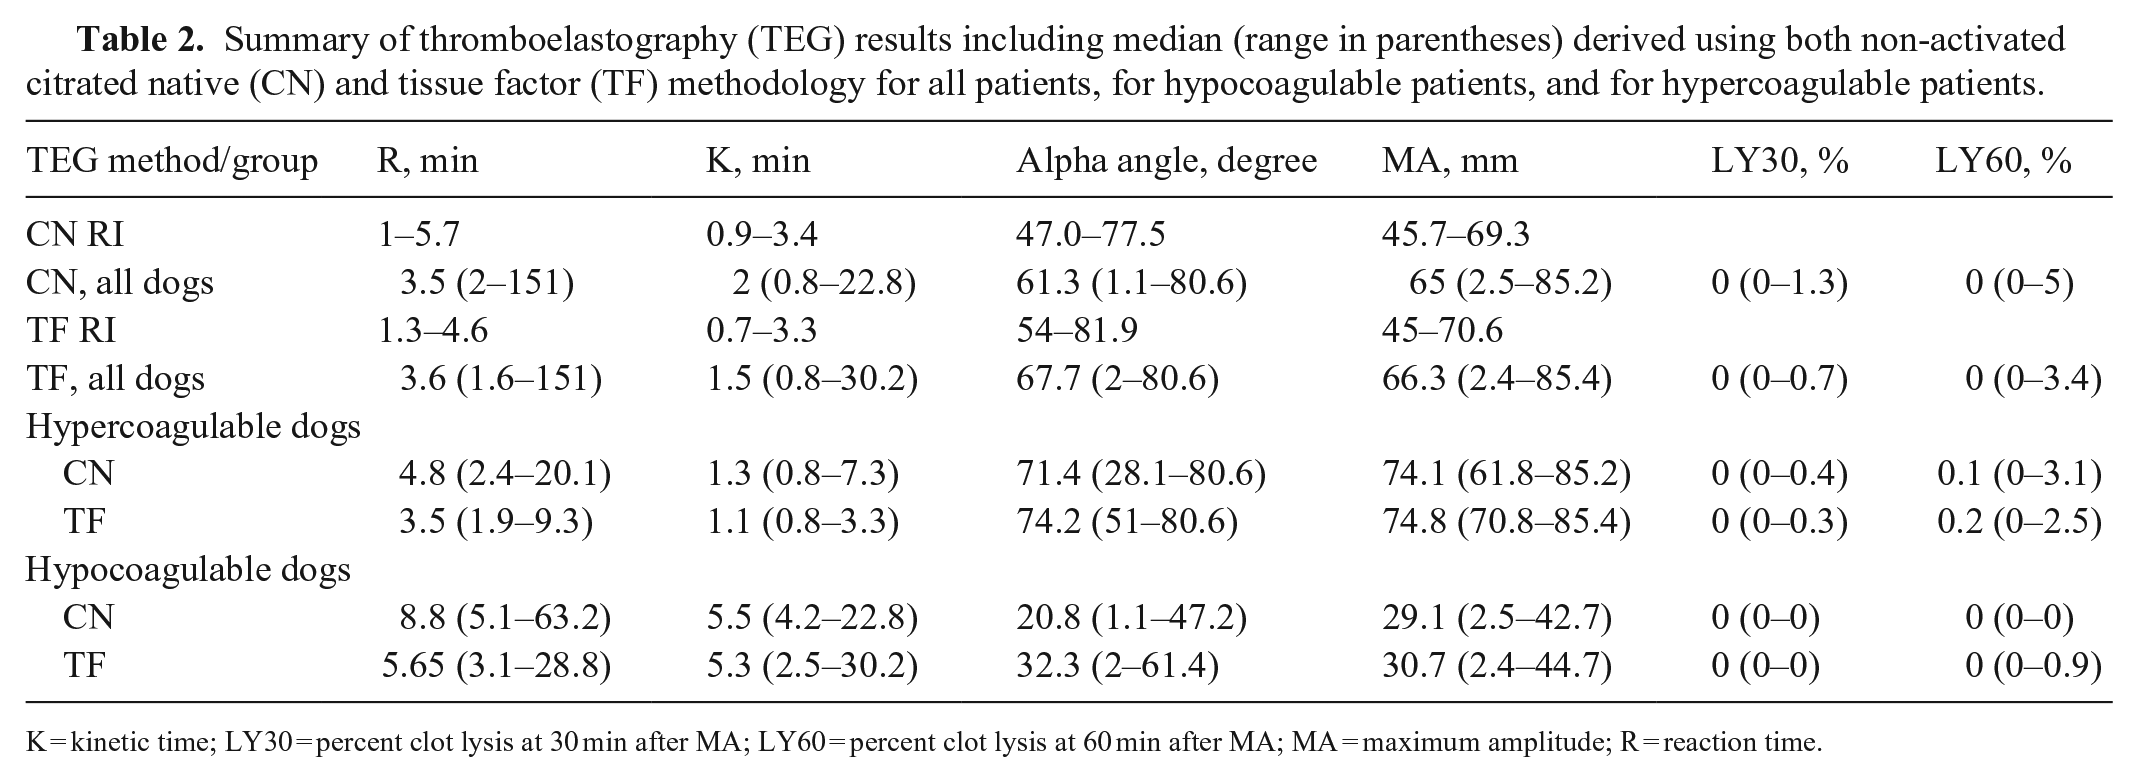
K = kinetic time; LY30 = percent clot lysis at 30 min after MA; LY60 = percent clot lysis at 60 min after MA; MA = maximum amplitude; R = reaction time.
Comparison of thromboelastography (TEG) variables analyzed on non-activated citrated native samples and tissue factor–activated samples using Lin concordance correlation coefficients (CCCs) and nonparametric limits of agreement (LOA).
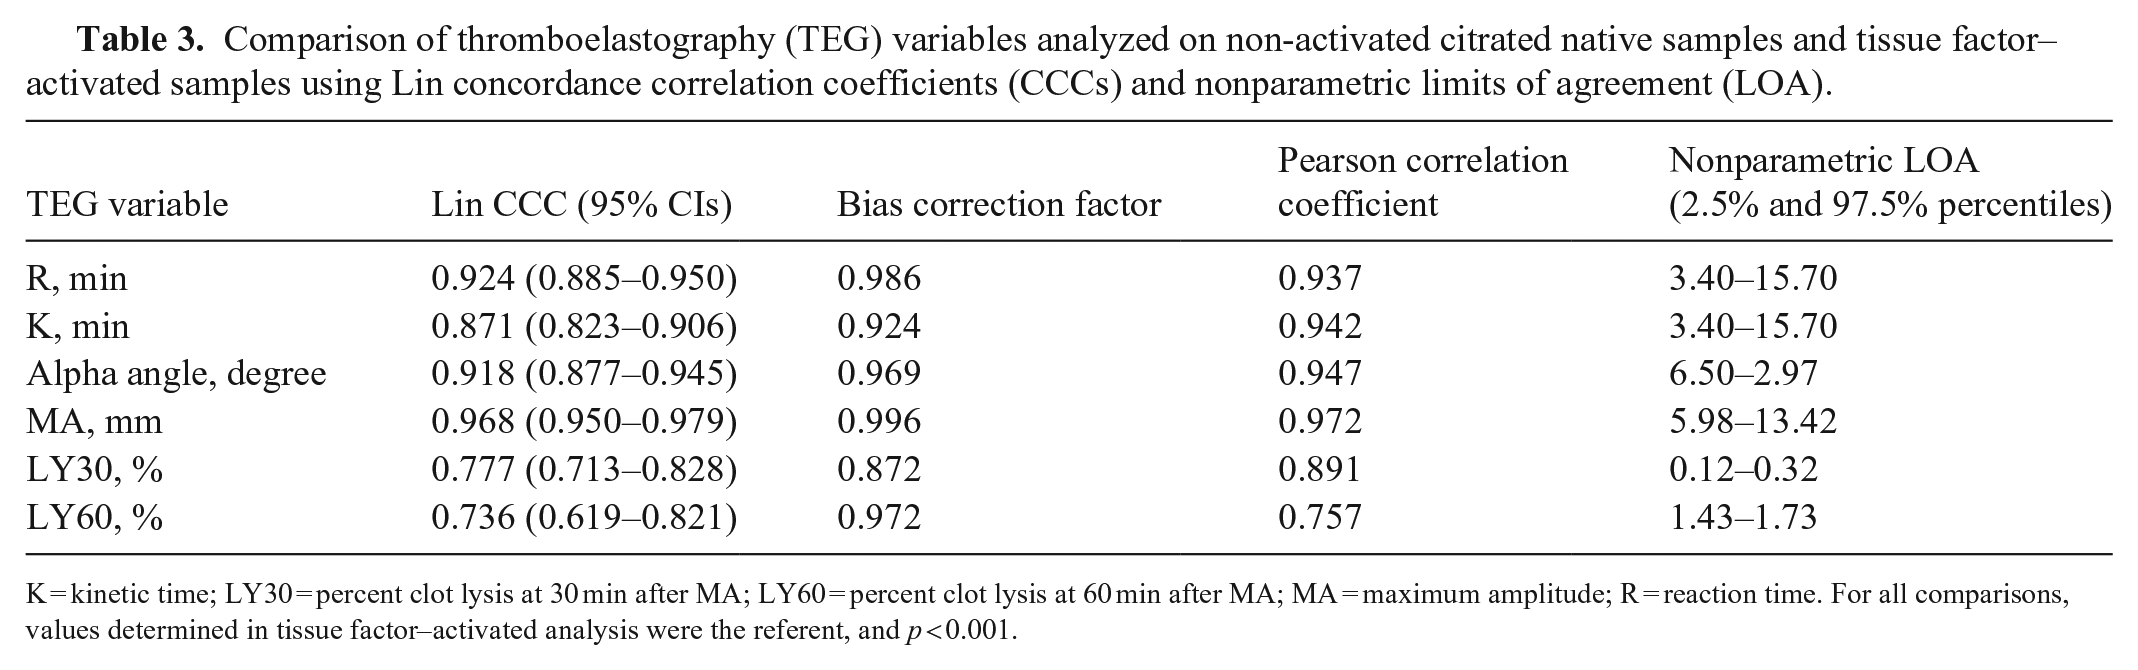
K = kinetic time; LY30 = percent clot lysis at 30 min after MA; LY60 = percent clot lysis at 60 min after MA; MA = maximum amplitude; R = reaction time. For all comparisons, values determined in tissue factor–activated analysis were the referent, and p < 0.001.
Method comparison of individual TEG variables
When CN-TEG variables were compared to TF-TEG variables for all samples, MA had substantial correlation, R and alpha had moderate correlation, and K, LY30, and LY60 had poor correlation with Lin CCCs; all variables had high to very high correlations with the Pearson correlation coefficient (Table 3; Figs. 1–6).
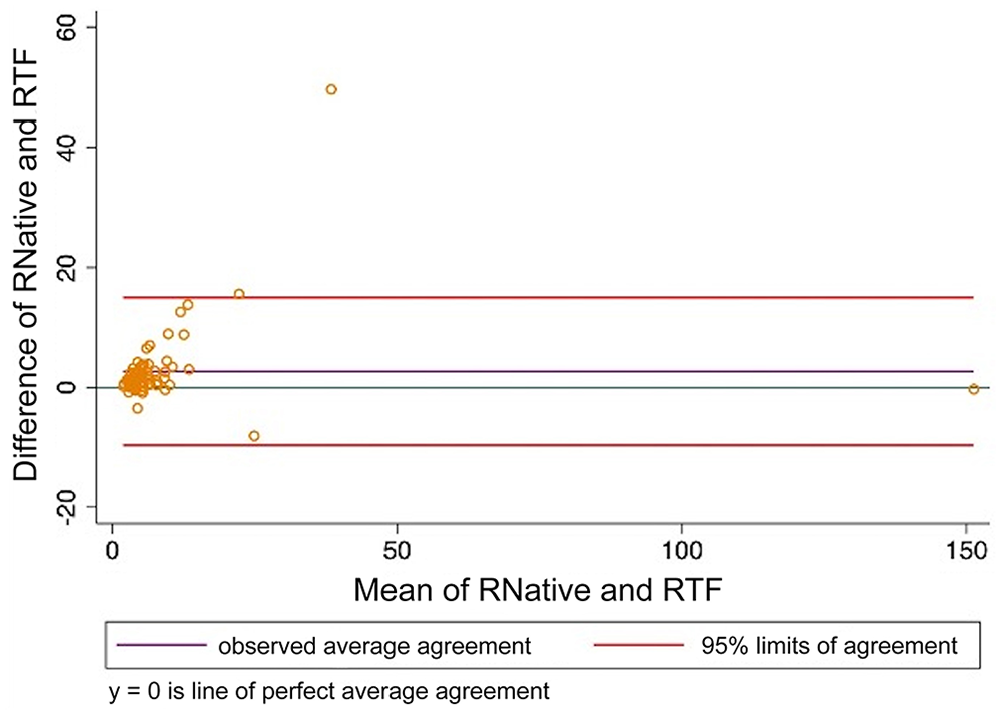
Bland–Altman plot comparing thromboelastography reaction time (R) analyzed using citrated native blood and tissue factor as activator. RNative = citrated native; RTF = tissue factor.
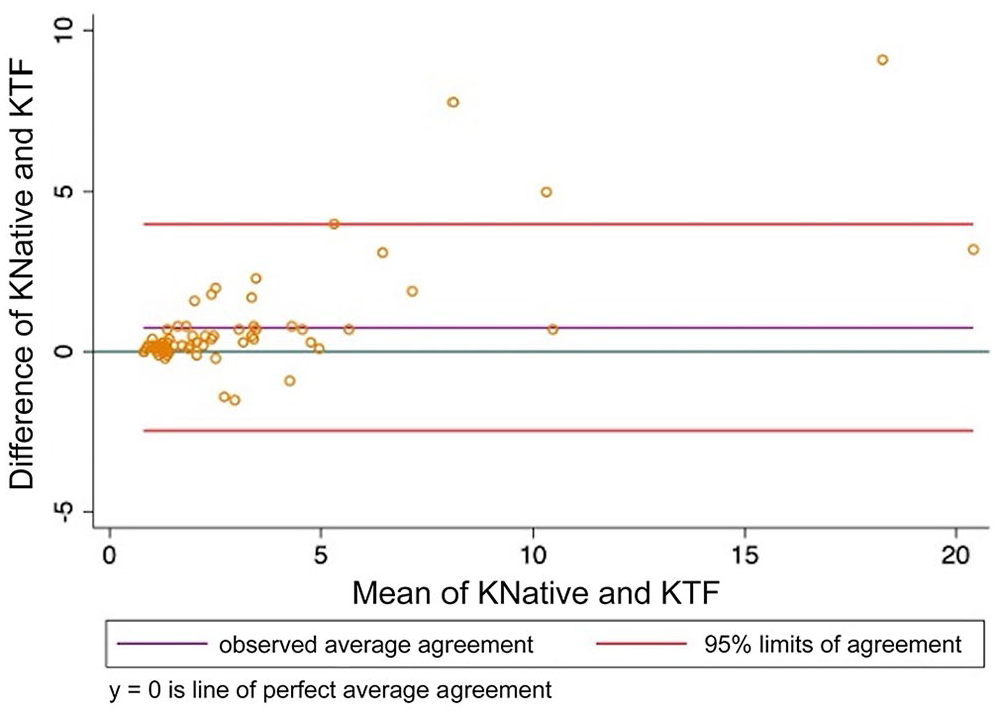
Bland–Altman plot comparing thromboelastography kinetic time (K) analyzed using citrated native blood and tissue factor as activator. KNative = citrated native; KTF = tissue factor.
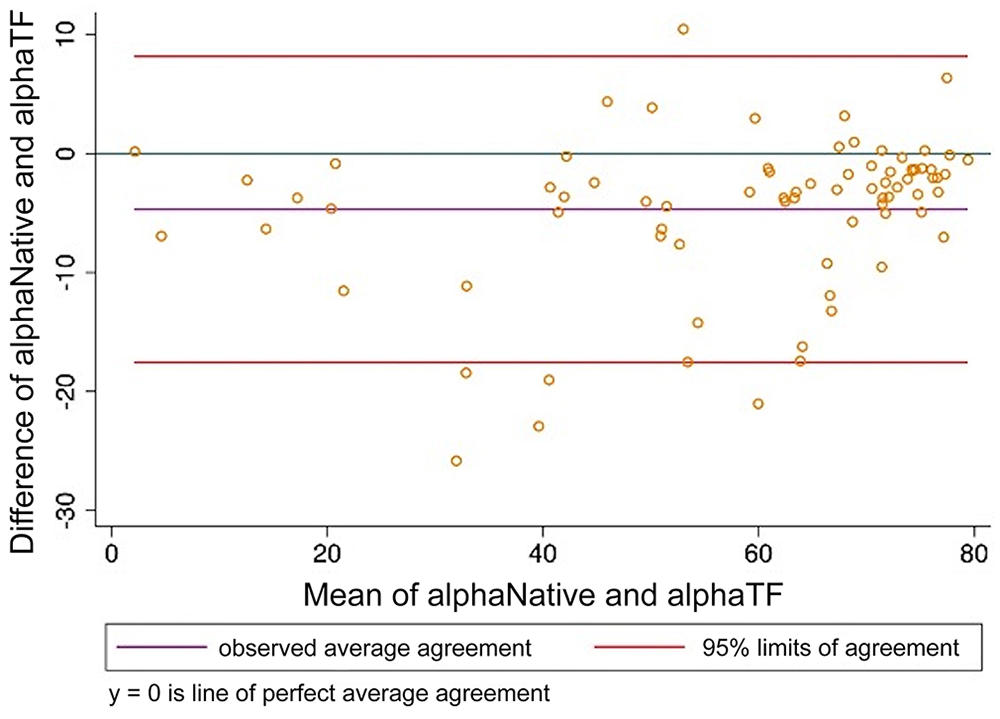
Bland–Altman plot comparing thromboelastography alpha angle (alpha) analyzed using citrated native blood and tissue factor as activator. alphaNative = citrated native; alphaTF = tissue factor.
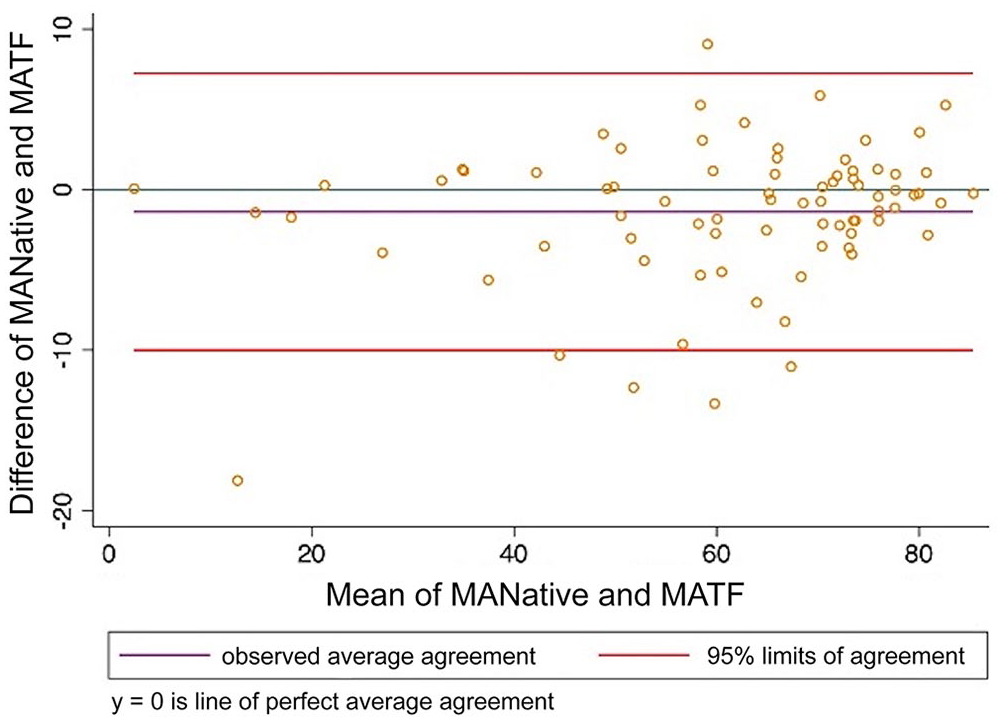
Bland–Altman plot comparing thromboelastography maximum amplitude (MA) analyzed using citrated native blood and tissue factor as activator. MANative = citrated native; MATF = tissue factor.
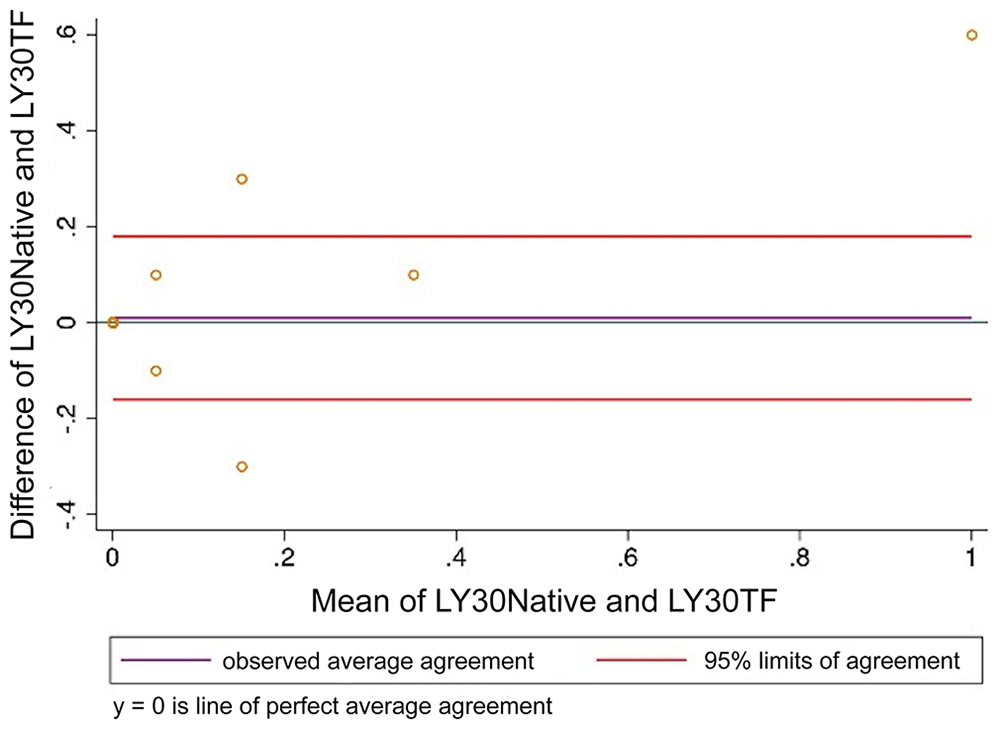
Bland–Altman plot comparing thromboelastography percentage lysis at 30 min after maximum amplitude (LY30) analyzed using citrated native blood and tissue factor as activator. LY30Native = citrated native; LY30TF = tissue factor.
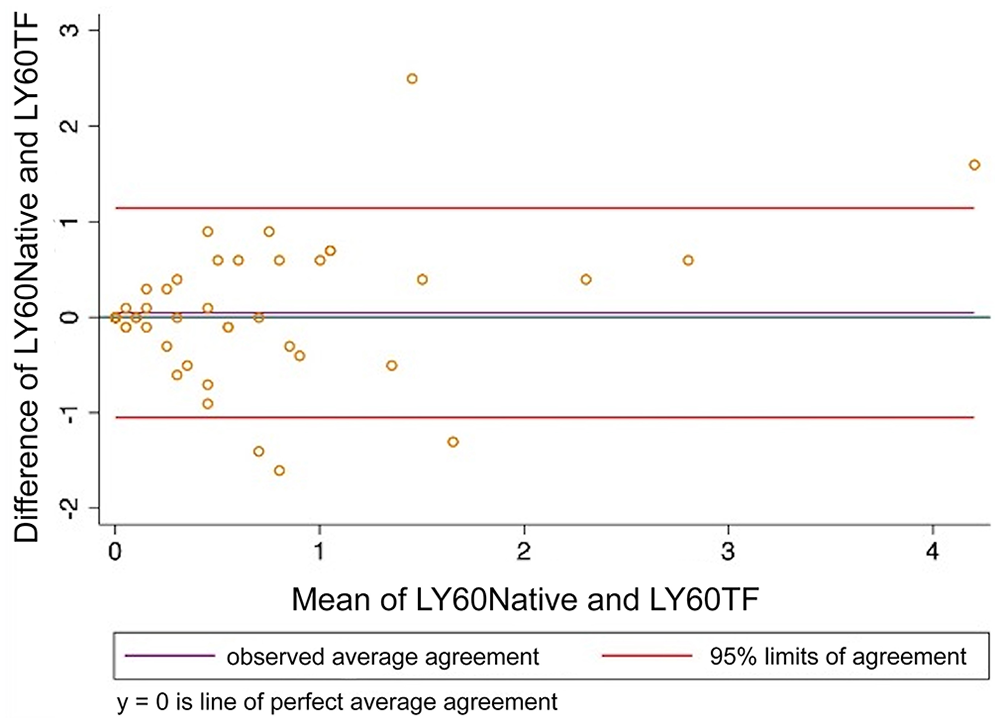
Bland–Altman plot comparing thromboelastography percentage lysis at 60 min after maximum amplitude (LY60) analyzed using citrated native blood and tissue factor as activator. LY60Native = citrated native; LY60TF = tissue factor.
Method comparison of classification as hypercoagulable, normal, or hypocoagulable
Patients were classified as hypercoagulable, normal, or hypocoagulable based on institutionally derived RIs using MA as the determining variable (Table 4). When subgroup analysis was performed on hypercoagulable and hypocoagulable groups, correlation between CN-TEG and TF-TEG alpha angle was significantly greater for hypocoagulable samples compared to hypercoagulable samples (Table 5). Correlation was not significantly different between hypocoagulable and hypercoagulable groups for any other TEG variables. For hypocoagulable samples, correlation via Lin CCC was poor for K, MA, and R, and was moderate for alpha; among hypercoagulable samples, correlation was poor for all parameters except LY60, for which it was moderate (Table 5). Agreement for CN-TEG and TF-TEG classification of hypercoagulable and hypocoagulable cases was good to very good with 91% and 97% agreement, respectively. No significant difference was found in the classification of samples using a McNemar test (hypercoagulable p = 0.706; hypocoagulable p = 0.157). Lysis values had 100% agreement between CN-TEG and TF-TEG samples using the McNemar test in both the hypercoagulable and coagulopathic subgroups.
Classification of patients as normocoagulable, hypocoagulable, or hypercoagulable in each thromboelastography method analysis using institutionally derived reference intervals for maximum amplitude.
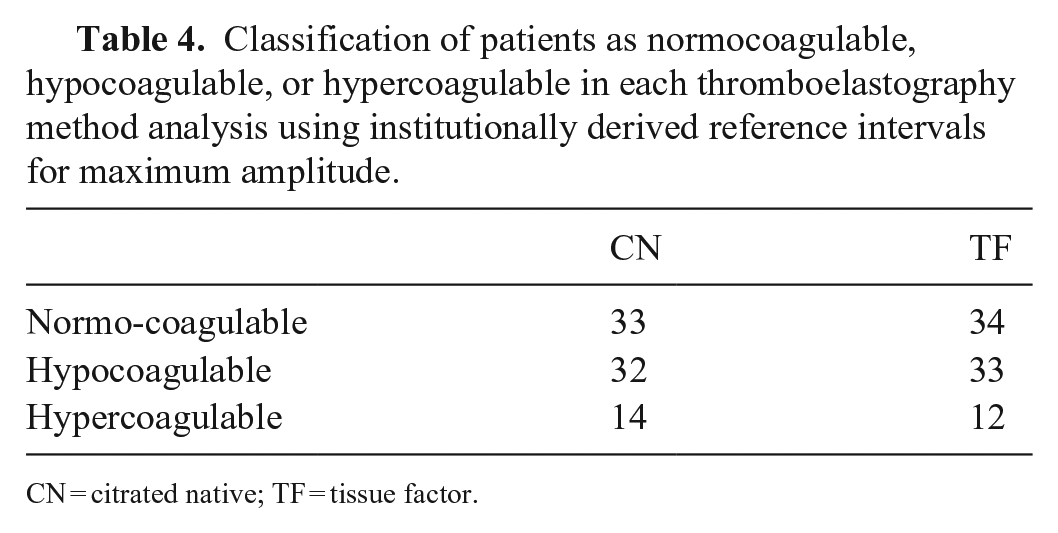
CN = citrated native; TF = tissue factor.
Comparison of Lin concordance correlation coefficients (CCCs) between citrated native and tissue factor–activated thromboelastography (TEG) parameters for hypercoagulable and hypocoagulable states in dogs with disorders of hemostasis using 2-sample t-test.
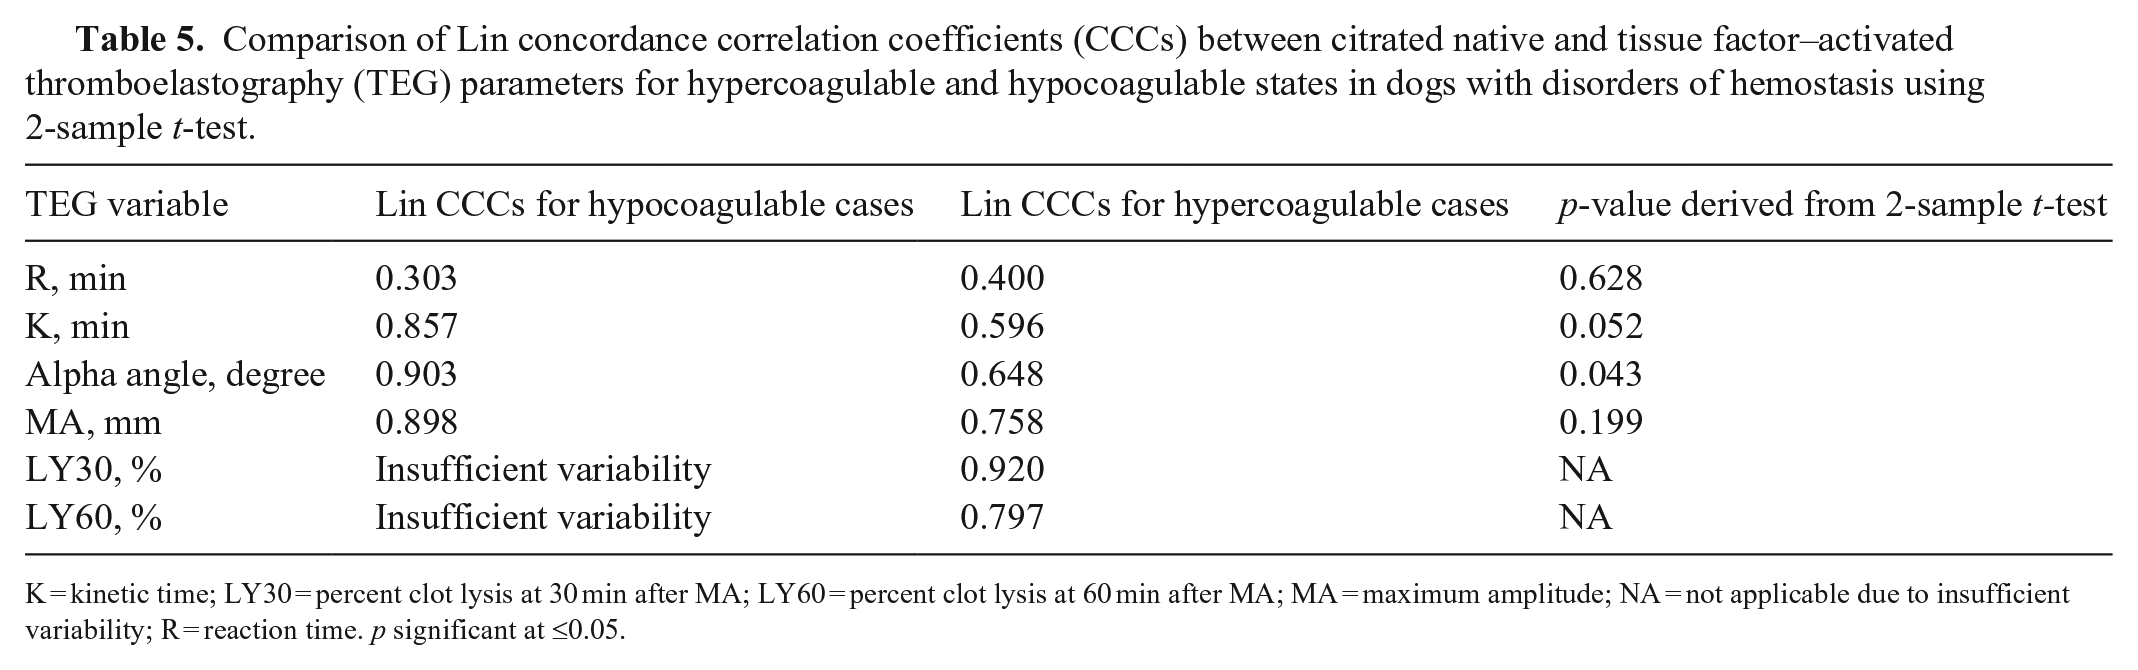
K = kinetic time; LY30 = percent clot lysis at 30 min after MA; LY60 = percent clot lysis at 60 min after MA; MA = maximum amplitude; NA = not applicable due to insufficient variability; R = reaction time. p significant at ≤0.05.
Sensitivity and specificity of CN-TEG analysis for identifying hypercoagulable cases with TF-TEG as referent were 87.9% and 93.3%, respectively (area under the ROC curve 0.906; 95% CI: 0.839–0.973). Sensitivity and specificity for CN-TEG analysis for identifying hypocoagulable cases with TF-TEG as referent were 100% and 97.0%, respectively (area under the ROC curve 0.985; 95% CI: 0.964–1.000).
When Lin CCCs were compared between CN-TEG and TF-TEG for hypercoagulable dogs versus all dogs using a 2-sample t-test, alpha, K, LY30, MA, and R were found to be significantly different; whereas not significant for LY60 (Table 6). When Lin CCCs were compared between CN-TEG and TF-TEG for hypocoagulable dogs versus all dogs using a 2-sample t-test, comparisons for MA and R reached statistical significance (Table 7).
Comparison of Lin concordance correlation coefficients (CCCs) between citrated native and tissue factor–activated thromboelastography (TEG) parameters for hypercoagulable dogs versus all dogs using 2-sample t-test.
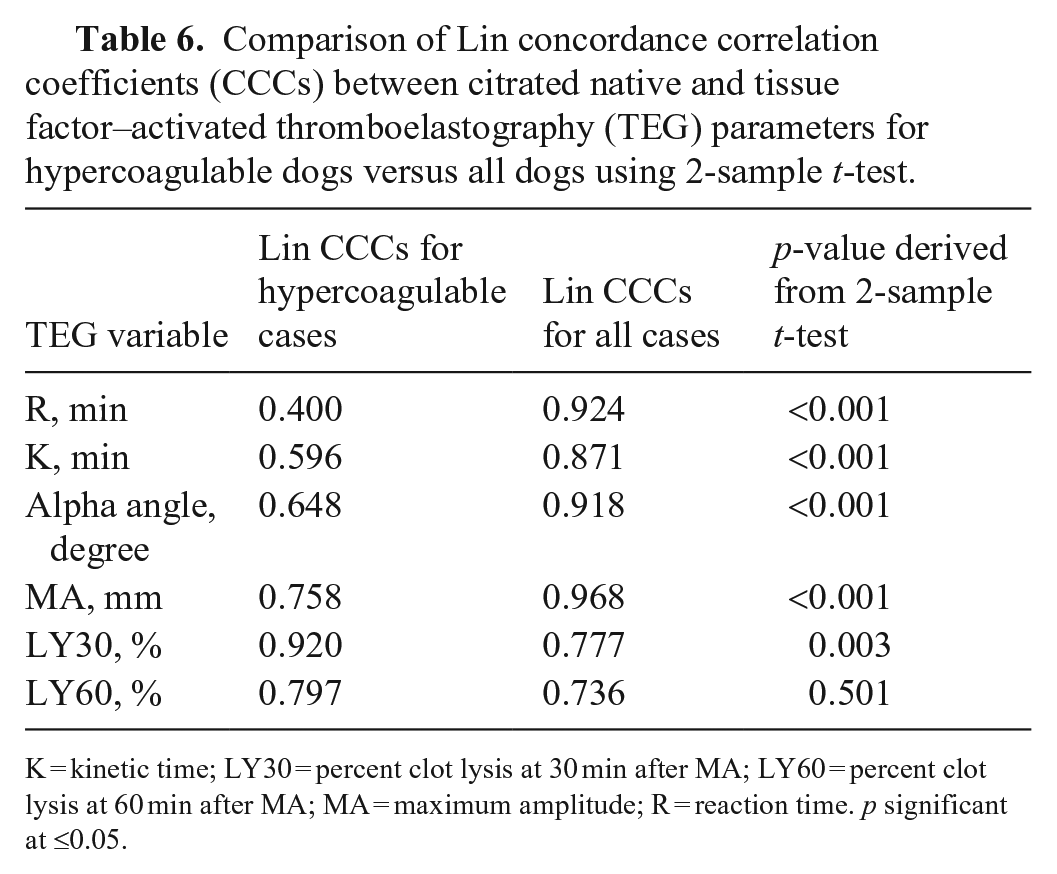
K = kinetic time; LY30 = percent clot lysis at 30 min after MA; LY60 = percent clot lysis at 60 min after MA; MA = maximum amplitude; R = reaction time. p significant at ≤0.05.
Comparison of Lin concordance correlation coefficients (CCCs) between citrated native and tissue factor–activated thromboelastography (TEG) parameters for hypocoagulable dogs versus all dogs using 2-sample t-test.
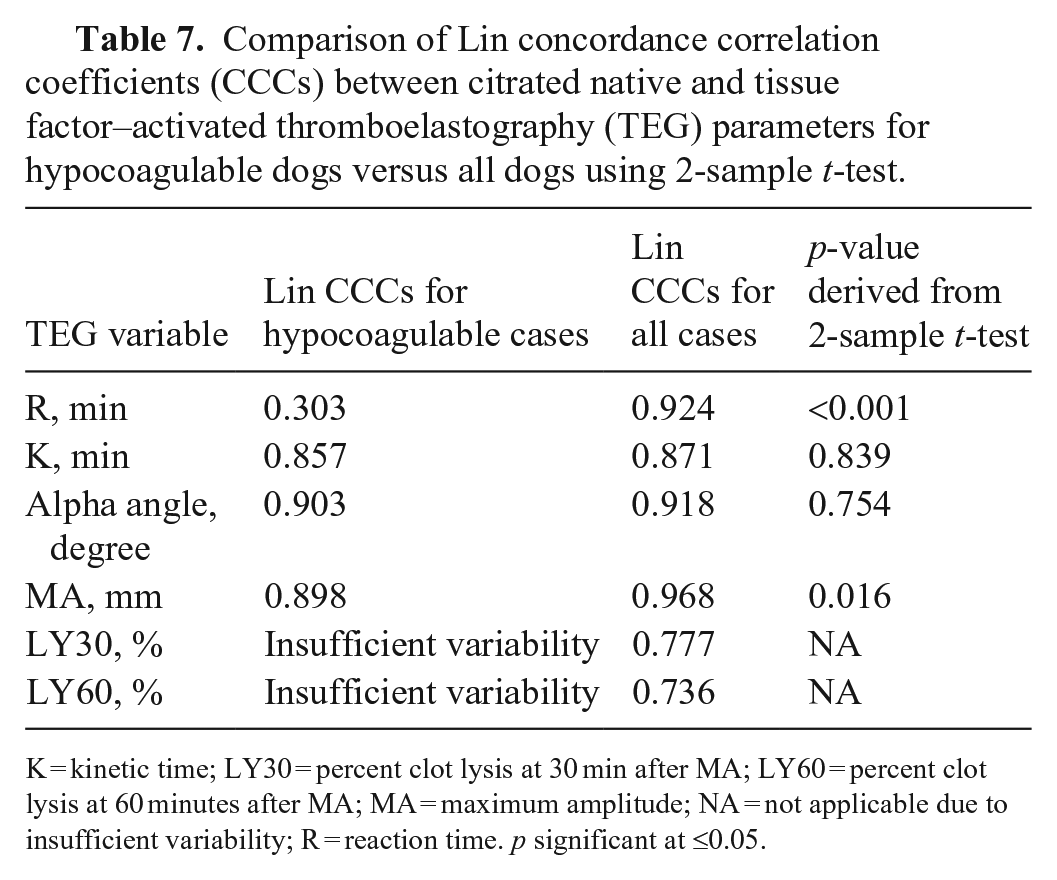
K = kinetic time; LY30 = percent clot lysis at 30 min after MA; LY60 = percent clot lysis at 60 minutes after MA; MA = maximum amplitude; NA = not applicable due to insufficient variability; R = reaction time. p significant at ≤0.05.
Method comparison of the degree of variability in results
No difference was found between the variance of any TEG variables between CN-TEG and TF-TEG samples based on a Brown–Forsythe test.
Discussion
We found categorical agreement between the CN-TEG methodology compared to TF-TEG to suggest clinically acceptable utility of either method in hypercoagulable and hypocoagulable patients, but did not identify the reported clinically relevant wider variance in results performed without an activator.9 –11,15,18 The moderate-to-substantial correlations in most variables using CN-TEG and TF-TEG analyses in the overall patient population suggest that either method is acceptable for performing TEG in canine patients with suspected abnormal hemostasis; both methods give the same clinical impression and would, therefore, result in a similar plan. In addition, we found clinically relevant agreement between the 2 TEG methods for both hypercoagulable and hypocoagulable patients using a McNemar test. However, poor Lin CCCs were noted for most TEG variable comparisons, both in hypercoagulable and hypocoagulable groups, when each subgroup analysis was performed. This indicates that whereas the results generally display the same trends and allow for similar clinical impressions, method of activation affects the individual results enough that, if values are being longitudinally trended, the same method of activation should be utilized. This has been corroborated by other veterinary studies in healthy animals,11,15 but such a comparison has not been reported in sick veterinary patients, as we found in our search of Google, PubMed, and Web of Science described above.
When comparing correlations for individual TEG variables between hypercoagulable and hypocoagulable subgroups, we found a stronger correlation for alpha angle between the 2 methods in hypocoagulable patients but not for any other variables; this subgroup analysis may have been affected by the limited number of hypercoagulable patients as well as the small number of patients in the overall study population. However, it is unlikely that taken alone, an alpha angle result would determine a clinician’s interpretation of a TEG tracing. The generally poorer correlations among the hypercoagulable subgroup were also reflected when correlations for individual TEG variables were compared between hypercoagulable patients and all dogs, which was likely similarly affected by the limited number of hypercoagulable patients. Our observation from the data is that correlations were on average lower in hypercoagulable cases based on the Lin CCCs, as well as more significant parameter differences in hypercoagulable population using the t-test to compare against the entire study population. Although limited by the low number of hypercoagulable dogs, it is also plausible that the method of activation could have influenced our results. As such, it has been suggested that various methods of activation may be beneficial in suspect hypercoagulable and hypocoagulable states. 20 It is possible that if different methods of activation were used, such as kaolin or rapid TEG, in which TF and kaolin are used simultaneously, this could have affected our results. Future studies comparing methods of activation in veterinary patients with hemostatic dysfunction are necessary to investigate this further.
Our patients were determined to have abnormal hemostasis based on the value of MA lying below, within, or above the RI in the TF analysis, as MA has been demonstrated the most robust parameter of the TEG. 7 The definition of hypercoagulability and hypocoagulability in veterinary patients based on TEG is still debated. 17 Following the PROVETS guidelines, we reported the 4 standard variables, but used MA as the definition of hemostatic abnormality. In many critically ill veterinary patients, TEG may provide additional useful information to clinicians deciding which individual components of hemostasis may be altered and may necessitate interventions. Interpretation of clot formation and kinetic variables individually as well as the tracing as a whole can guide these decisions. We investigated specifically whether CN-TEG and TF-TEG results would demonstrate agreement not just in overall coagulability classification, but also in the individual TEG variables in patients with abnormal hemostasis. Our results suggest that using either CN-TEG or TF-TEG in dogs with disorders of hemostasis may provide this useful information to the clinician.
Many veterinary studies of TEG do not report on clot lysis variables LY30 and LY60 unless specific tissue plasminogen activator assays (tPAs) are performed to investigate hyperfibrinolysis. In TEG assays that do not include an activator of fibrinolysis such as tPA, sensitivity for detecting hyperfibrinolysis is low. 12 Hyperfibrinolysis may occur in disease states as a result of a deficiency of inhibitors or an excess of activators, making this system challenging to assess with an in vitro model. Although clot lysis parameters are reported here and demonstrate high correlation, they were limited by low variability. As the TEG assays evaluated in our study were not conducted with the goal of assessing fibrinolysis, a robust conclusion cannot be made from these results.
Based on our findings, clinically significant variance of TEG variables between CN-TEG and TF-TEG samples is unlikely to be present given the qualitative agreement demonstrated. The PROVETS guidelines recommend using activators for routine analysis because prior studies found a decreased level of variability in results derived from activated sample analysis compared to CN sample analysis. 5 Although there is limited comparison of activator choice in canine TEG, a study conducted on ROTEM in apparently healthy canine patients found a CV of 36% for recalcification alone, 31% for 1:50,000 dilute TF activation, 25% for commercially supplied TF at 1:3,500 dilution, and 11% for commercially supplied ellagic acid. 18 Comparisons of recalcification alone versus TF-activated TEG in horses with gastrointestinal disease and in healthy horses similarly showed decreased variability of most TEG parameters in the TF-TEG analyses.9,10 However, 2 published studies comparing various TEG activators, including TF and kaolin, with recalcification alone in apparently healthy feline patients, differed in their results; one did not find consistently decreased variability for TF-TEG compared to the CN-TEG samples. 1 The other study found a higher CV in the CN assays compared with both kaolin- and TF-activated samples. 15 Most of these studies were performed on smaller sample sizes of healthy patients, with the exception of the study on horses with gastrointestinal disease. Although larger powered studies are required to further investigate this question, our results suggest that the use of an activator may not be necessary to decrease the level of variability.
Our study was limited by a small number of patients, in particular patients who were determined by TF-TEG to be hypocoagulable. Given that TEG is largely dependent on sample collection and handling, and is highly susceptible to pre-analytic variability, it is challenging to compare results from institution to institution. We did not evaluate the impact of multiple activators or sample collection technique on results, and subsequent studies could further highlight the differences in utility and limitations of different TEG methods. Larger sample sizes of critically ill patients generally require multicenter institution participation, which may not provide the most reliable data for studies on TEG. However, similar studies with a larger patient population could corroborate our results, enabling generalization of interpretation to canine patients. Additionally, we only investigated one activator at one concentration; subsequent studies could investigate the use of various activators in patients with suspected abnormal hemostasis to compare agreement, sensitivity, and specificity for identifying hypercoagulability and hypocoagulability, as well as TEG variable–specific abnormalities.
Our results suggest that within a population of sick patients, many of whom had abnormal hemostasis as defined by TEG, CN-TEG and TF-TEG are both reliable and clinically useful methods of performing the assay, and either assay is valuable in assessment of hemostasis. The individual values for CN-TEG and TF-TEG, however, are not directly comparable, and the tests should not be used interchangeably.
Footnotes
Declaration of conflicting interests
The authors declared no potential conflicts of interest with respect to the research, authorship, and/or publication of this article.
Funding
The authors received no financial support for the research, authorship, and/or publication of this article.