
Abstract
There is growing interest in using hemp materials as animal feed ingredients, which may raise safety concerns because of the potential transfer of active cannabinoids to the resultant products of animal origin. Hence, the detection and identification of cannabinoids in feeds would be useful. We developed a simple, fast, and sensitive method for simultaneous quantification of 4 major cannabinoids in animal feeds by liquid chromatography–tandem mass spectrometry (LC-MS/MS). We used a simple solvent extraction and dilution approach to extract cannabinoids from the feed matrix. We validated the method in 2 types of cattle feeds with acceptable intra-day and inter-day accuracy (87.5–116%) and precision (< 15%). The limit of detection was 0.05 µg/g, and the limit of quantification was 0.1 µg/g. Furthermore, the method was able to identify and quantify cannabinoids in cattle feeds mixed with hempseed cake as well as in several different hempseed materials, demonstrating its potential in veterinary laboratory applications.
Hemp is a variety of the Cannabis sativa plant species, which contains a wide range of cannabinoids.1,5 Among those cannabinoids, psychoactive delta-9-tetrahydrocannabinol (THC) is regulated to be < 0.3% in hemp, according to the 2018 Farm Bill. 15 Hemp has wide industrial uses, and its derived products include fabrics, paper, building materials, and human food.3,4 Hemp has received increasing interest for its use in animal feeds.4,6 Hempseed, for instance, supplies high levels of unsaturated fatty acids, proteins, fiber, vitamins, and useful minerals. 2 Furthermore, after high-value oils are removed from seeds, hempseed cakes or meals are obtained as byproducts, which could be economical hemp materials for animal feed use given the retained high protein and nutritional profiles.2,4
Despite the benefits of hemp materials for animal feed use, a potential transfer of cannabinoids from hemp-based feeds to final animal products can pose safety concerns because of the unintended effects of cannabinoids, such as psychoactive THC, in humans and animals.7,16 One study quantified the transfer of THC into the milk of cows when industrial hemp silage was used as a feed supplement for dairy cows. 17 Another study identified cannabinoids in cattle plasma when the cattle were fed industrial hemp, indicating the availability of cannabinoids for distribution throughout the body.12,13 These studies used more time-consuming and sophisticated extraction procedures involving a Soxhlet apparatus and solid-phase extraction, as well as longer run times for cannabinoid analysis.12,17 Our objective was to establish a simple, fast, and sensitive method for quantification of 4 major cannabinoids in hemp-based animal feeds using liquid chromatography–tandem mass spectrometry (LC-MS/MS). The major cannabinoids of interest were cannabidiol (CBD), cannabidiolic acid (CBDA), THC, and delta-9-tetrahydrocannabinolic acid (THCA).
We obtained standards from Sigma-Aldrich, including CBD, CBDA, CBD-d3, CBDA-d3, THC, THCA, THC-d3, and THCA-d3. The deuterated compounds, THC-d3, THCA-d3, CBD-d3, and CBDA-d3, were used as internal standards (ISs) for their respective cannabinoids. High-performance LC- or LC/MS-grade reagents were obtained from Fisher Scientific and used for sample extraction and LC-MS/MS analysis. Ultrapure water (18.2 MΩ·cm) was obtained from a Milli-Q Integral system (Millipore). Control blank cattle feeds, including ground beef and dairy feeds, were obtained from the American Association of Feed Control Officials. Hempseed cake was received as a gift with reported nutritional and safety properties.10,11 Various hempseed powder materials were obtained online (Amazon.com).
Quadratic calibration curves were obtained in standard solutions of 0.4–40 ng/mL for each cannabinoid with coefficient of determination (R²) > 0.99. Deuterated ISs were added at 4 ng/mL in each calibrator. The 2 control cattle feeds were spiked at 3 concentrations of cannabinoids and used as QC samples to assess the accuracy and precision of our method. Given that the dilution factor of the feed samples was 250 as described below, the calibration range of the cannabinoids in the cattle feeds was 0.1–10 µg/g.
A ground feed sample (100 mg) was added to a 15-mL centrifuge tube containing a ceramic cylinder and deuterated IS solution (1 µg/g). For QC samples, cannabinoid standard solutions were spiked into the feeds at 3 concentrations: 0.1, 5, and 10 µg/g. Ultrapure water (1 mL) and 4 mL of 1% formic acid in acetonitrile were then added to the centrifuge tube. The samples were vortexed for 15 min and centrifuged at 1,400 × g for 5 min. Supernatant (0.2 mL) was diluted with 0.8 mL 50/50 (v/v) acetonitrile/water containing 0.1% formic acid and centrifuged at 13,000 × g for 5 min to pellet any particulates. Supernatant (0.2 mL) was then transferred to an autosampler vial for LC-MS/MS analysis.
LC-MS/MS analysis was performed using a 1290 Infinity HPLC system coupled to a 6470A triple quadrupole mass spectrometer (Agilent). A Poroshell 120 EC-C18 column (2.1 × 50 mm, 1.9 µm) coupled with a guard column (2.1 × 5 mm, 1.9 µm) were used for chromatographic separation. The flow rate was 0.4 mL/min with the temperature maintained at 40°C. The mobile phases consisted of A) 0.1% formic acid in water and B) 0.1% formic acid in acetonitrile. A gradient separation was used as follows: initial mobile phase B maintained at 65% for 0.5 min before it was increased to 80% over 3 min. The mobile phase B was then increased to 95% in 1 min, and was maintained at 95% for another minute before returning to 65%. The mass spectrometry was performed in multiple reaction monitoring mode using a Jet Stream electrospray ionization source (Agilent). THC and CBD were monitored in positive ionization (ESI+) mode, and THCA and CBDA were monitored in negative ionization (ESI–) mode. Two sets of precursor/product ion transitions were used for each cannabinoid with one for quantification and another for qualification (Table 1). In the LC-MS/MS chromatogram of a spiked feed sample (Fig. 1), the cannabinoids were baseline resolved from each other and eluted in the sequence of CBDA, CBD, THC, and THCA. The total run time was < 6.5 min for 1 sample, demonstrating the capability of the method for rapid analysis of cannabinoids in feeds.
Precursor/product ions for the target cannabinoids.
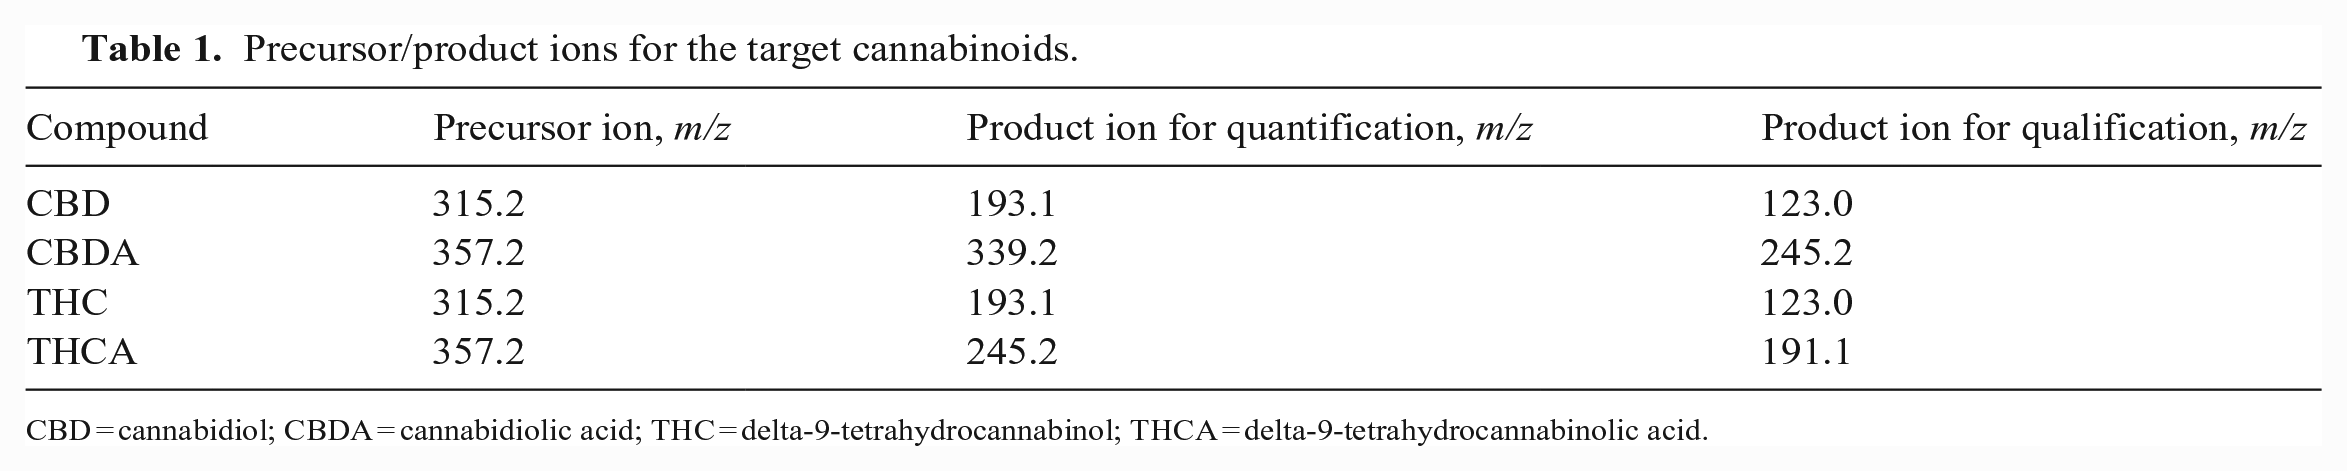
CBD = cannabidiol; CBDA = cannabidiolic acid; THC = delta-9-tetrahydrocannabinol; THCA = delta-9-tetrahydrocannabinolic acid.
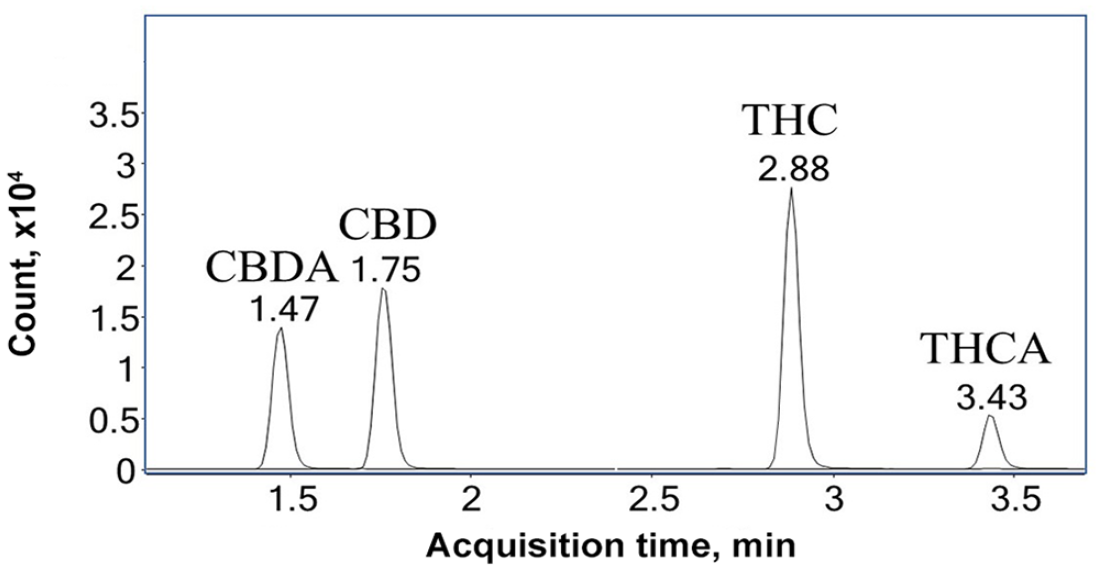
Liquid chromatography–tandem mass spectrometry chromatogram of eluting CBDA, CBD, THC, and THCA in a beef feed sample spiked with cannabinoid standards at 5 µg/g.
We validated our method for various parameters including accuracy, precision, selectivity, matrix effects, and processed sample stability. Accuracy and precision were assessed by analyzing 3 replicate QC samples at 3 concentrations on 3 separate days (Tables 2, 3). For both beef and dairy feed QC samples, the intra-day and inter-day accuracy of all 4 cannabinoids at the 3 concentrations was 87.5–116%. The intra-day and inter-day precision was 1.6–13.6%. The accuracy was within the acceptable range of 80–120%, and the precision was < 15%.
Accuracy and precision of cannabinoids quantified in beef feeds.
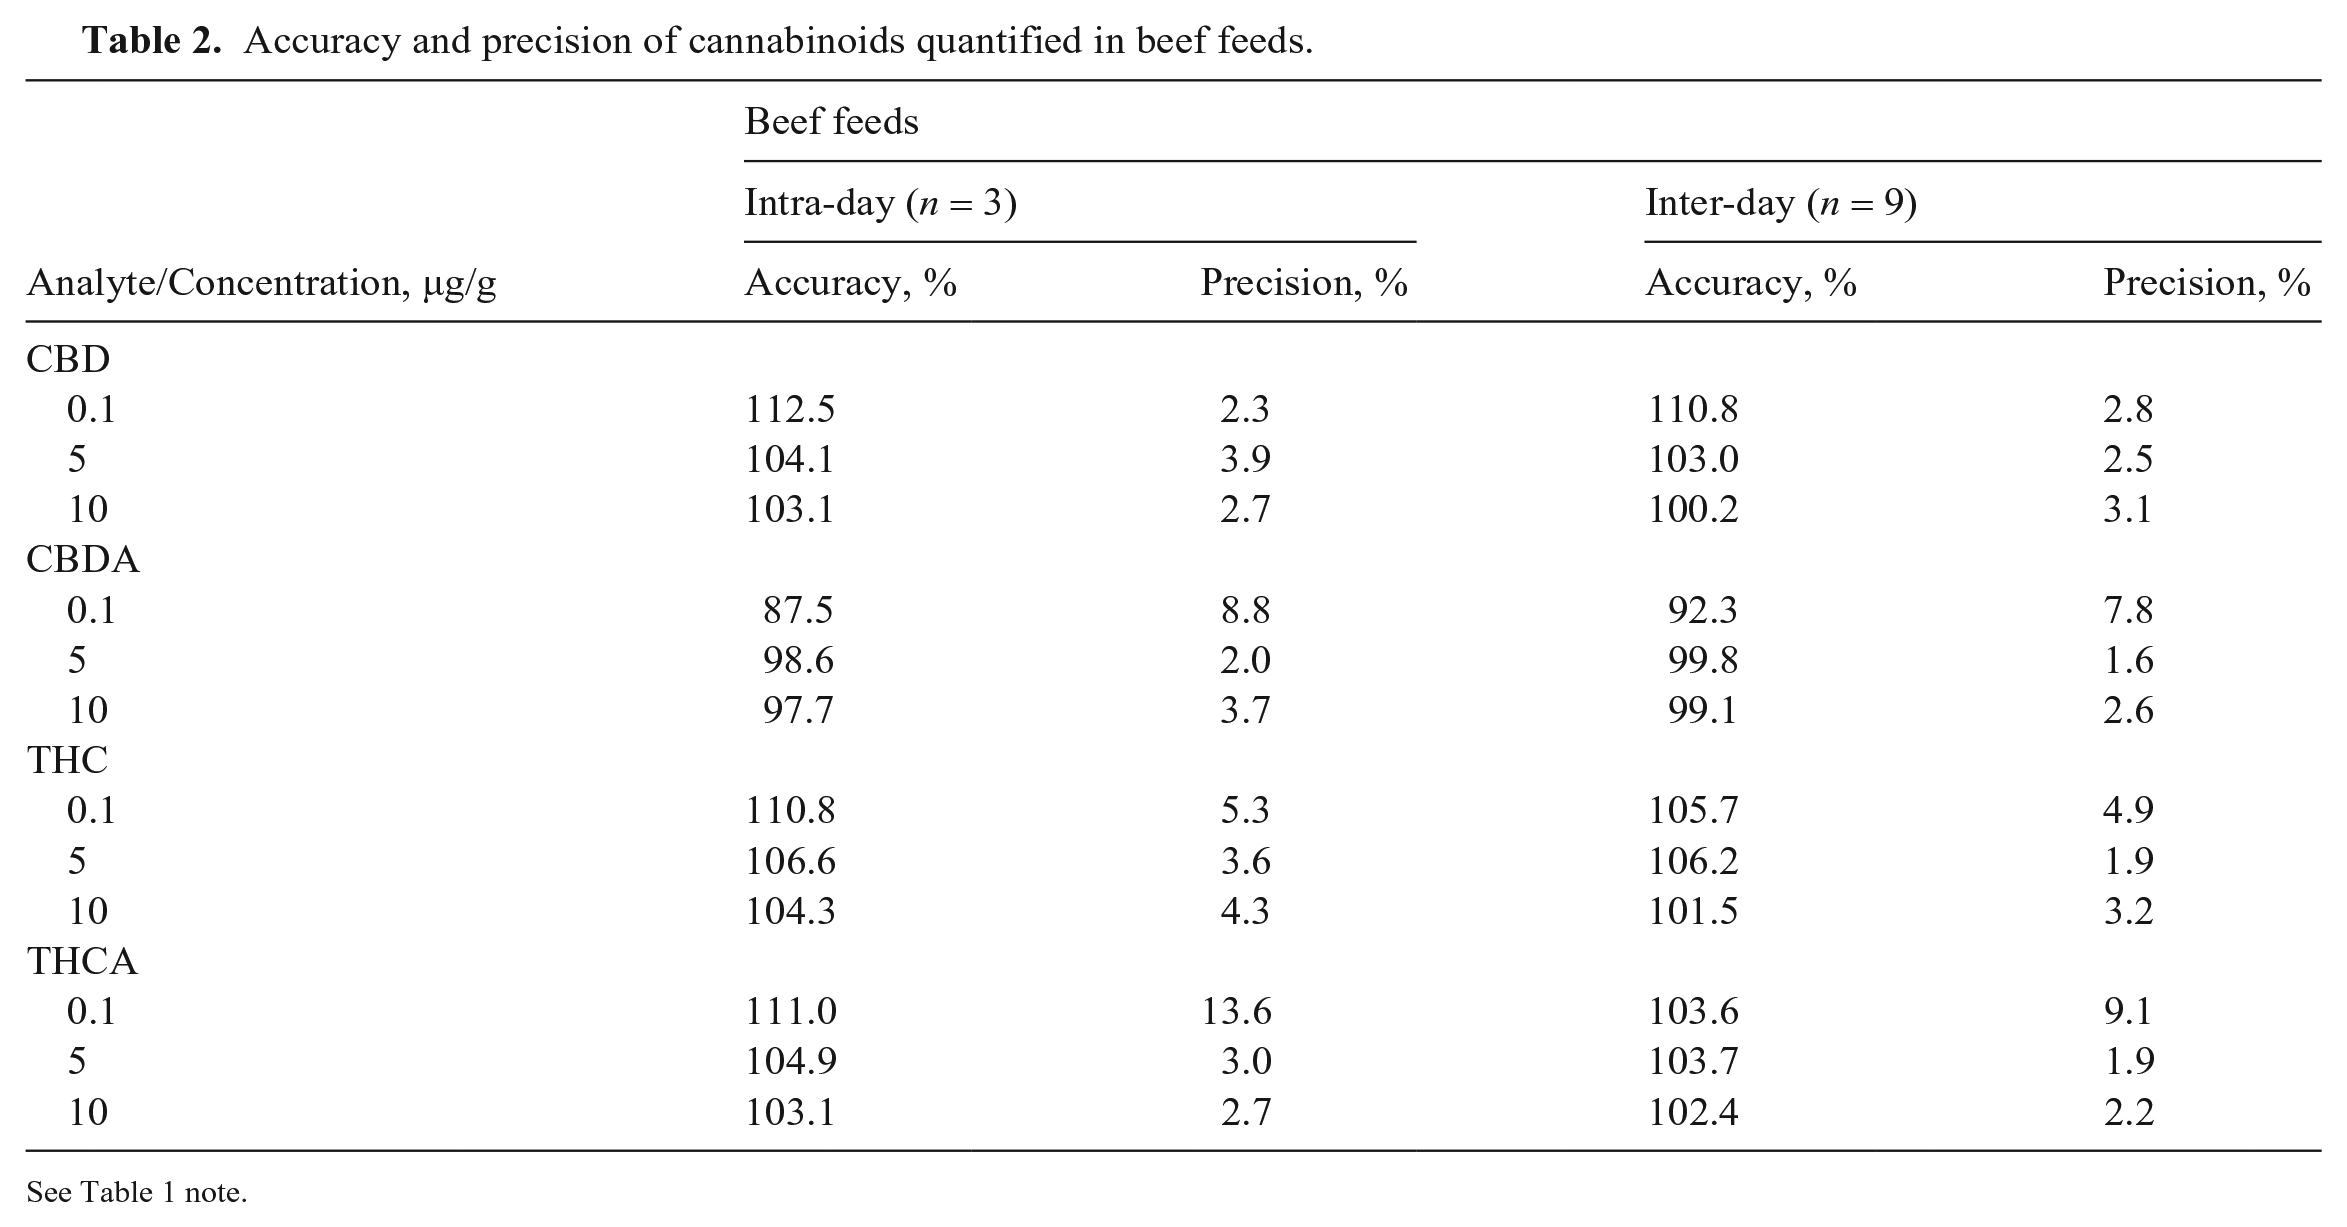
See Table 1 note.
Accuracy and precision of cannabinoids quantified in dairy feeds.
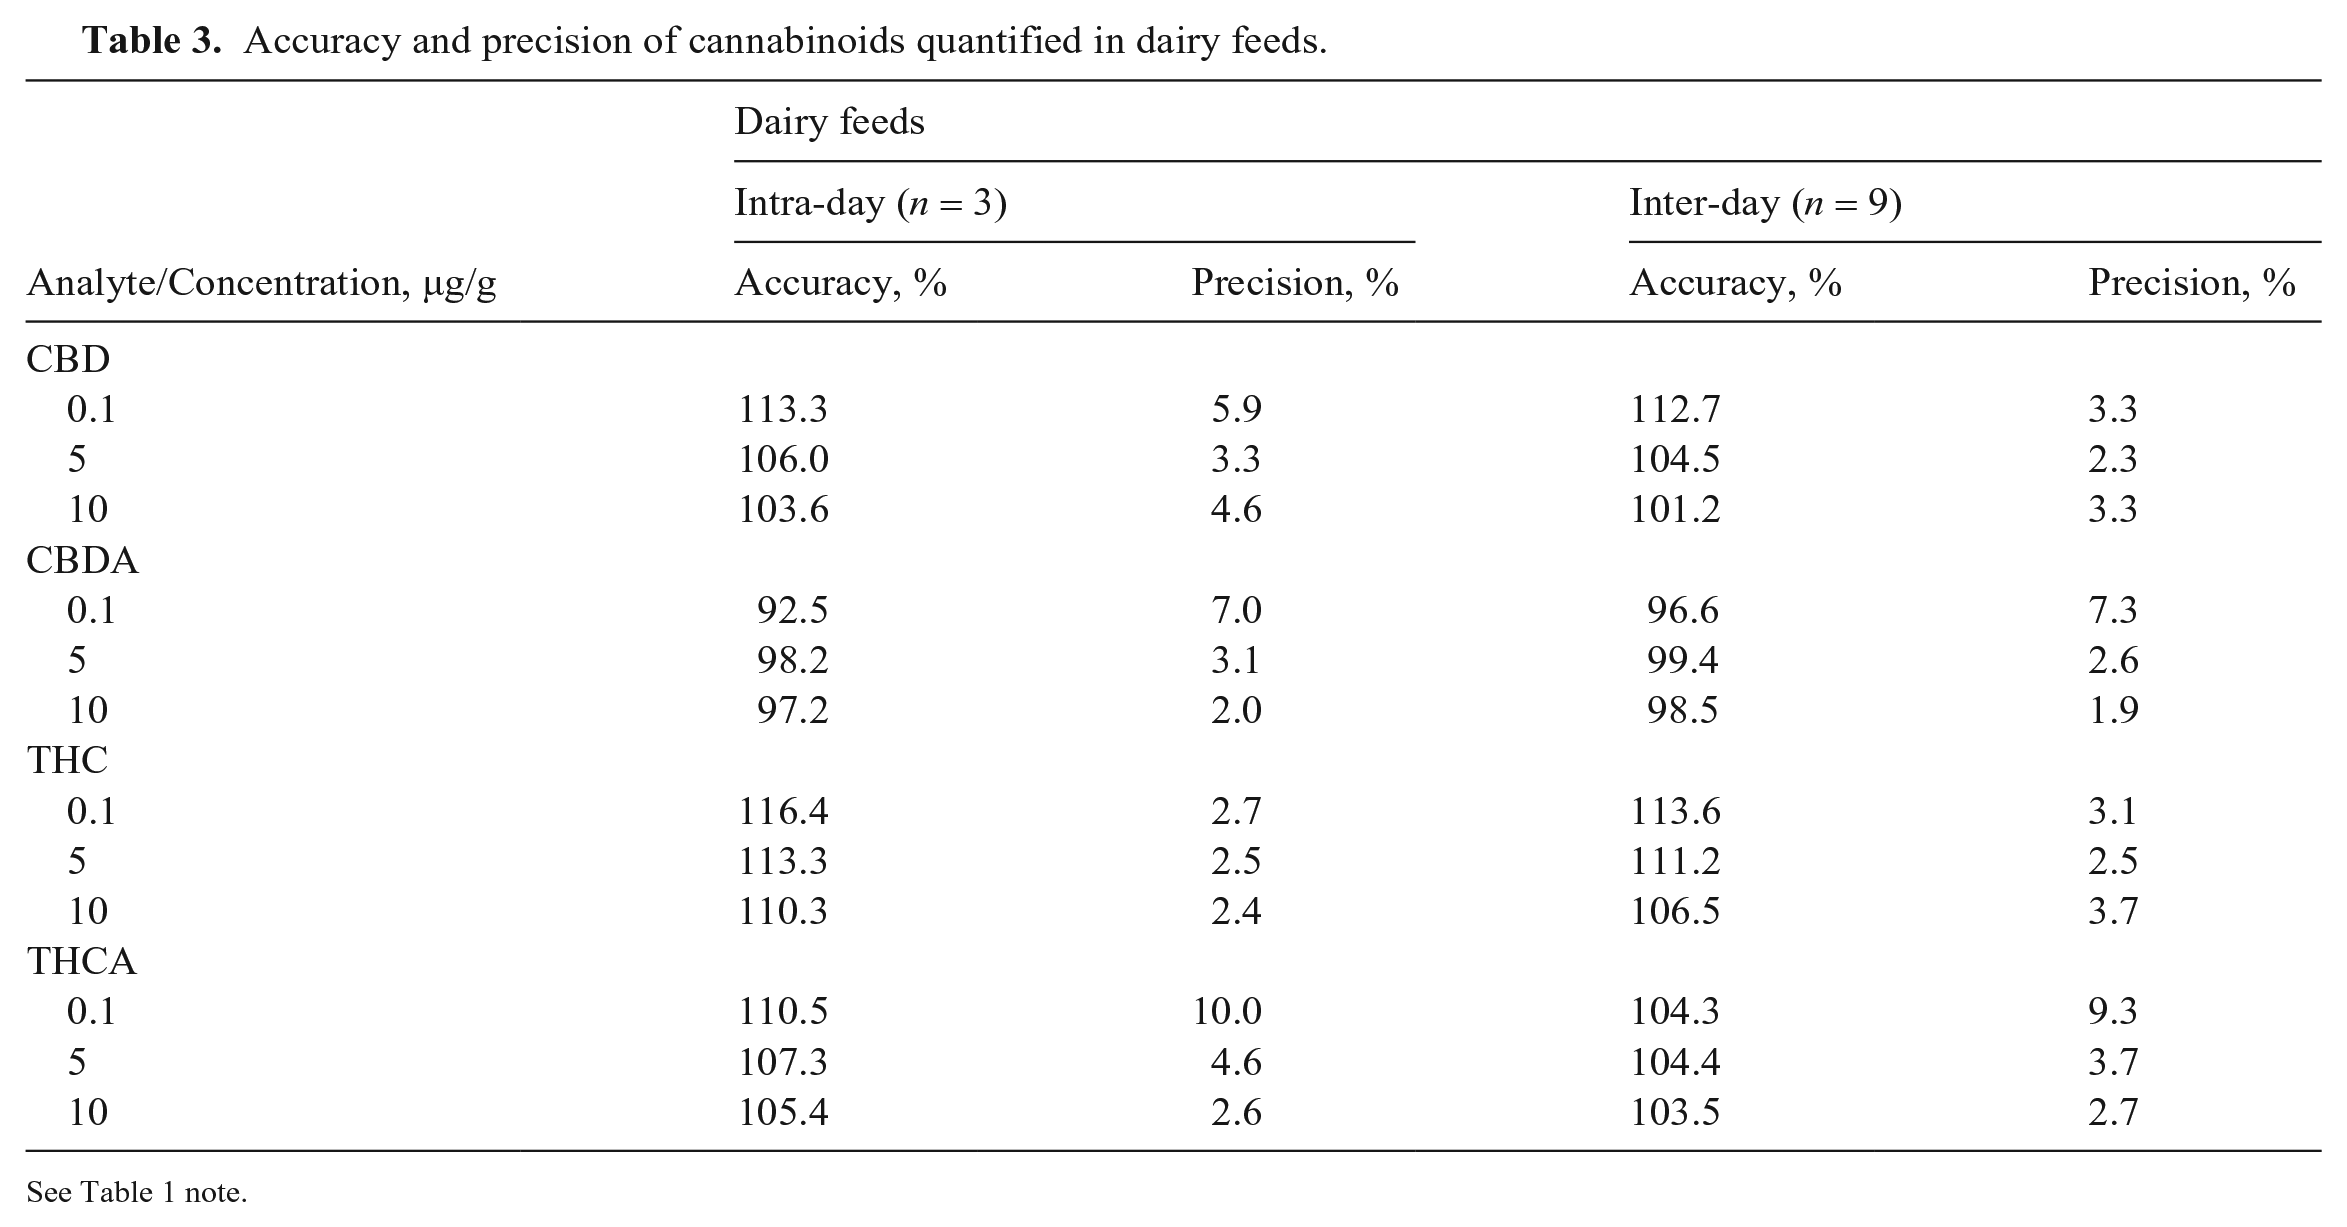
See Table 1 note.
When assessing the method selectivity, no interfering peaks from endogenous compounds were observed at the retention times of the analytes in blank feed samples (Fig. 2A), suggesting that the method can selectively detect the target cannabinoids. The limit of detection (LOD) and limit of quantification (LOQ) for the 4 cannabinoids were 0.05 μg/g (S:N ≥ 3) and 0.1 μg/g (S:N ≥ 10), respectively. The matrix effects on ionization of the cannabinoids were assessed by comparing post-spiked QC samples to the neat standards. Average ion suppression or enhancement was < 10% for the cannabinoids, suggesting that matrix effects were minimal. The use of deuterated ISs for each cannabinoid further minimized variations caused by matrix effects. These results confirmed the validity of using calibration curves based on standard solutions for the analysis of cannabinoids in feeds. 14 Processed sample stability was evaluated by storing QC samples at concentrations of 0.1 µg/g and 10 µg/g in the autosampler at 10°C. The stored QC samples were analyzed on days 0, 1, 2, 5, and 7. During the 7-d period, the accuracy of the QC samples was within the acceptable range of 80–120% and the precision was < 15%, suggesting that the processed samples can be stable for analysis for up to 7 d when stored at 10°C.
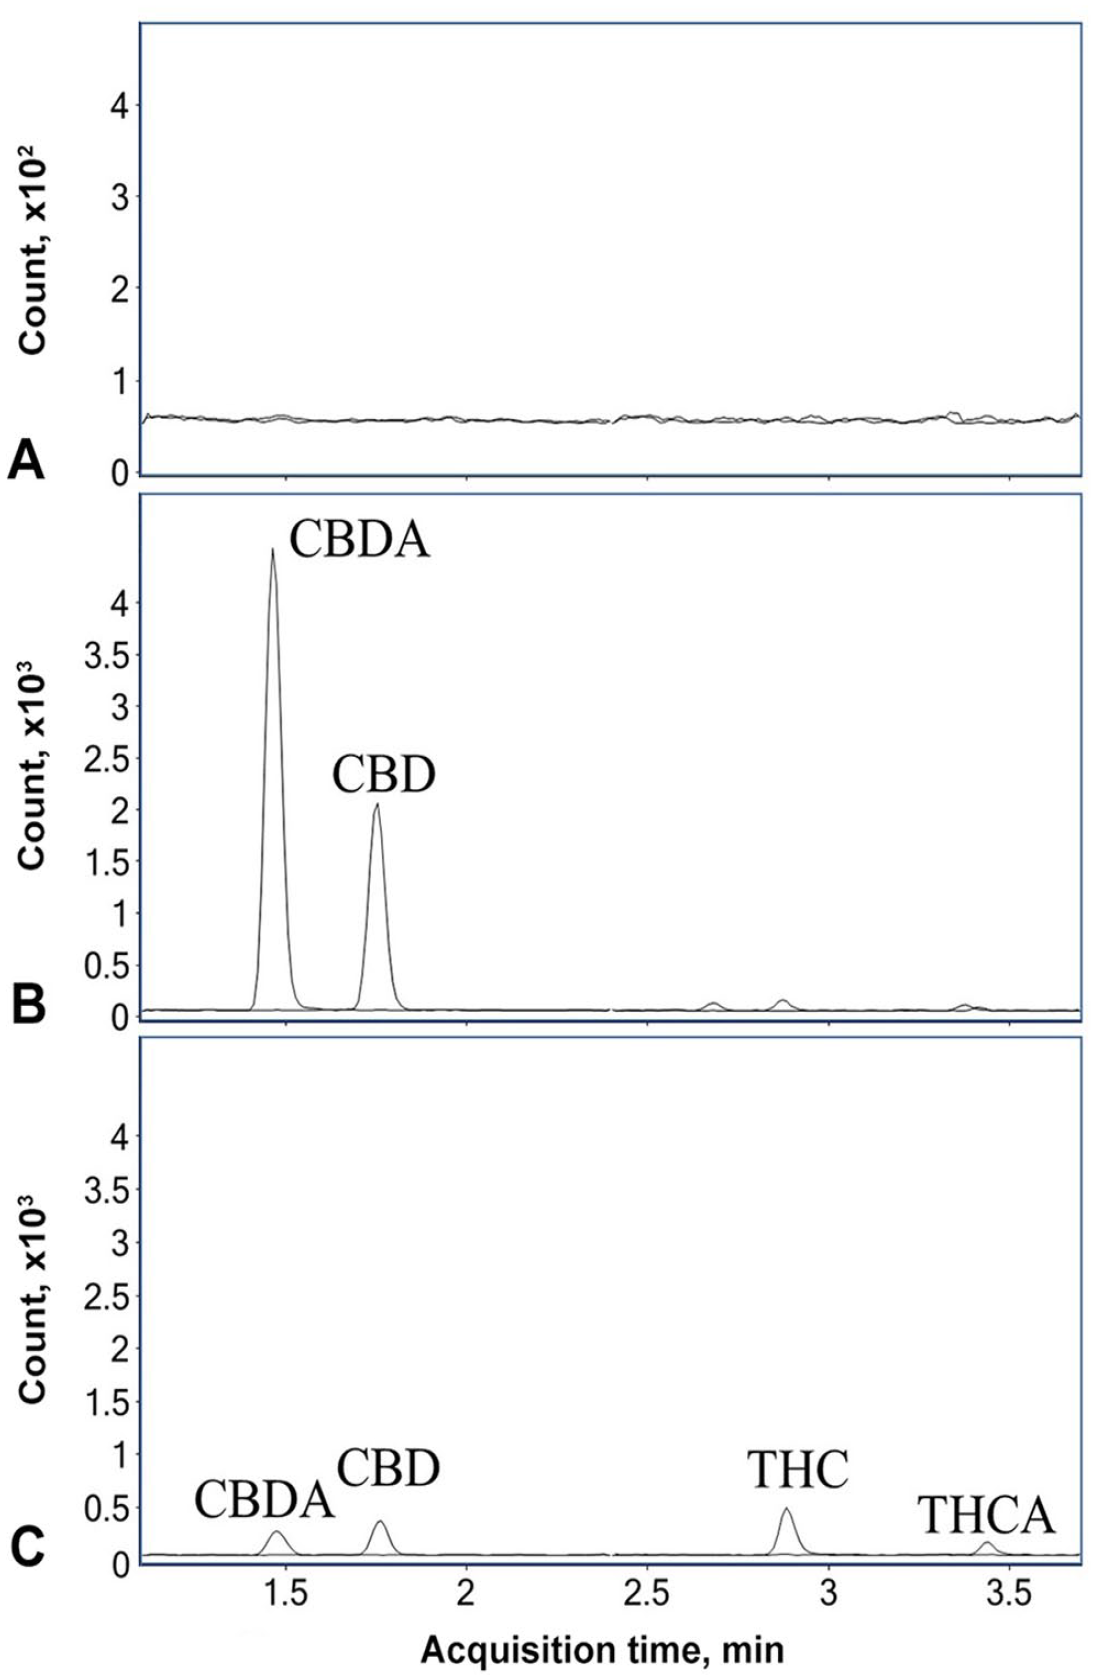
Liquid chromatography–tandem mass spectrometry chromatograms of various feed samples.
Because our objective was to develop an LC-MS/MS method for the determination of cannabinoids in animal feeds when hemp materials are used as ingredients, we mixed hempseed cake material with the cattle feeds at the ratio of 10% (w/w) and analyzed the mixed samples by LC-MS/MS. To prepare the mixture, 1 g of hempseed cake material was added to 9 g of the cattle feeds in a polypropylene tube containing small ceramic cylinders. The mixture was shaken and vortexed thoroughly to produce a homogeneous sample. The same hempseed cake had been evaluated as animal feed ingredients for laying hens at levels of inclusion of 10–30%. 11 In a few cattle studies, hempseed cake was used as a protein feed for dairy cows at concentrations of 14–32%. 9 Hempseed has also been used at concentrations of 9% or 14% in steer finishing diets. 8
We analyzed beef feed samples mixed with 10% (w/w) hempseed cake or cannabinoid standard solutions at the LOQ by our LC-MS/MS method (Fig. 2B, 2C). In the beef feed sample mixed with 10% hempseed cake, CBDA and CBD were detected at concentrations of 1.49 µg/g and 0.58 µg/g, respectively (Table 4). CBDA and CBD were also detected at similar concentrations in the dairy feed sample with added hempseed cake. On the other hand, the concentrations of THC and THCA were less than LODs in both cattle feeds mixed with hempseed cake. A study found no cannabinoids in animal feed containing as much as 30% of the same hempseed cake, 11 which could be the result of the high LOD of the method used (0.005% [50 µg/g]). The higher sensitivity achieved by our method enabled the detection of all 4 cannabinoids in the hempseed cake (Table 4). Compared to studies that had used hemp materials as cattle feeds and analyzed their cannabinoid concentrations using LC-MS/MS,12,13,17 our method had similar or better sensitivity for the target cannabinoids with a smaller sample size requirement, simpler sample-extraction procedure, and shorter analysis run time.
Cannabinoid concentrations in cattle feeds containing hempseed cake and a variety of hempseed powder samples, based on 3 replicates.
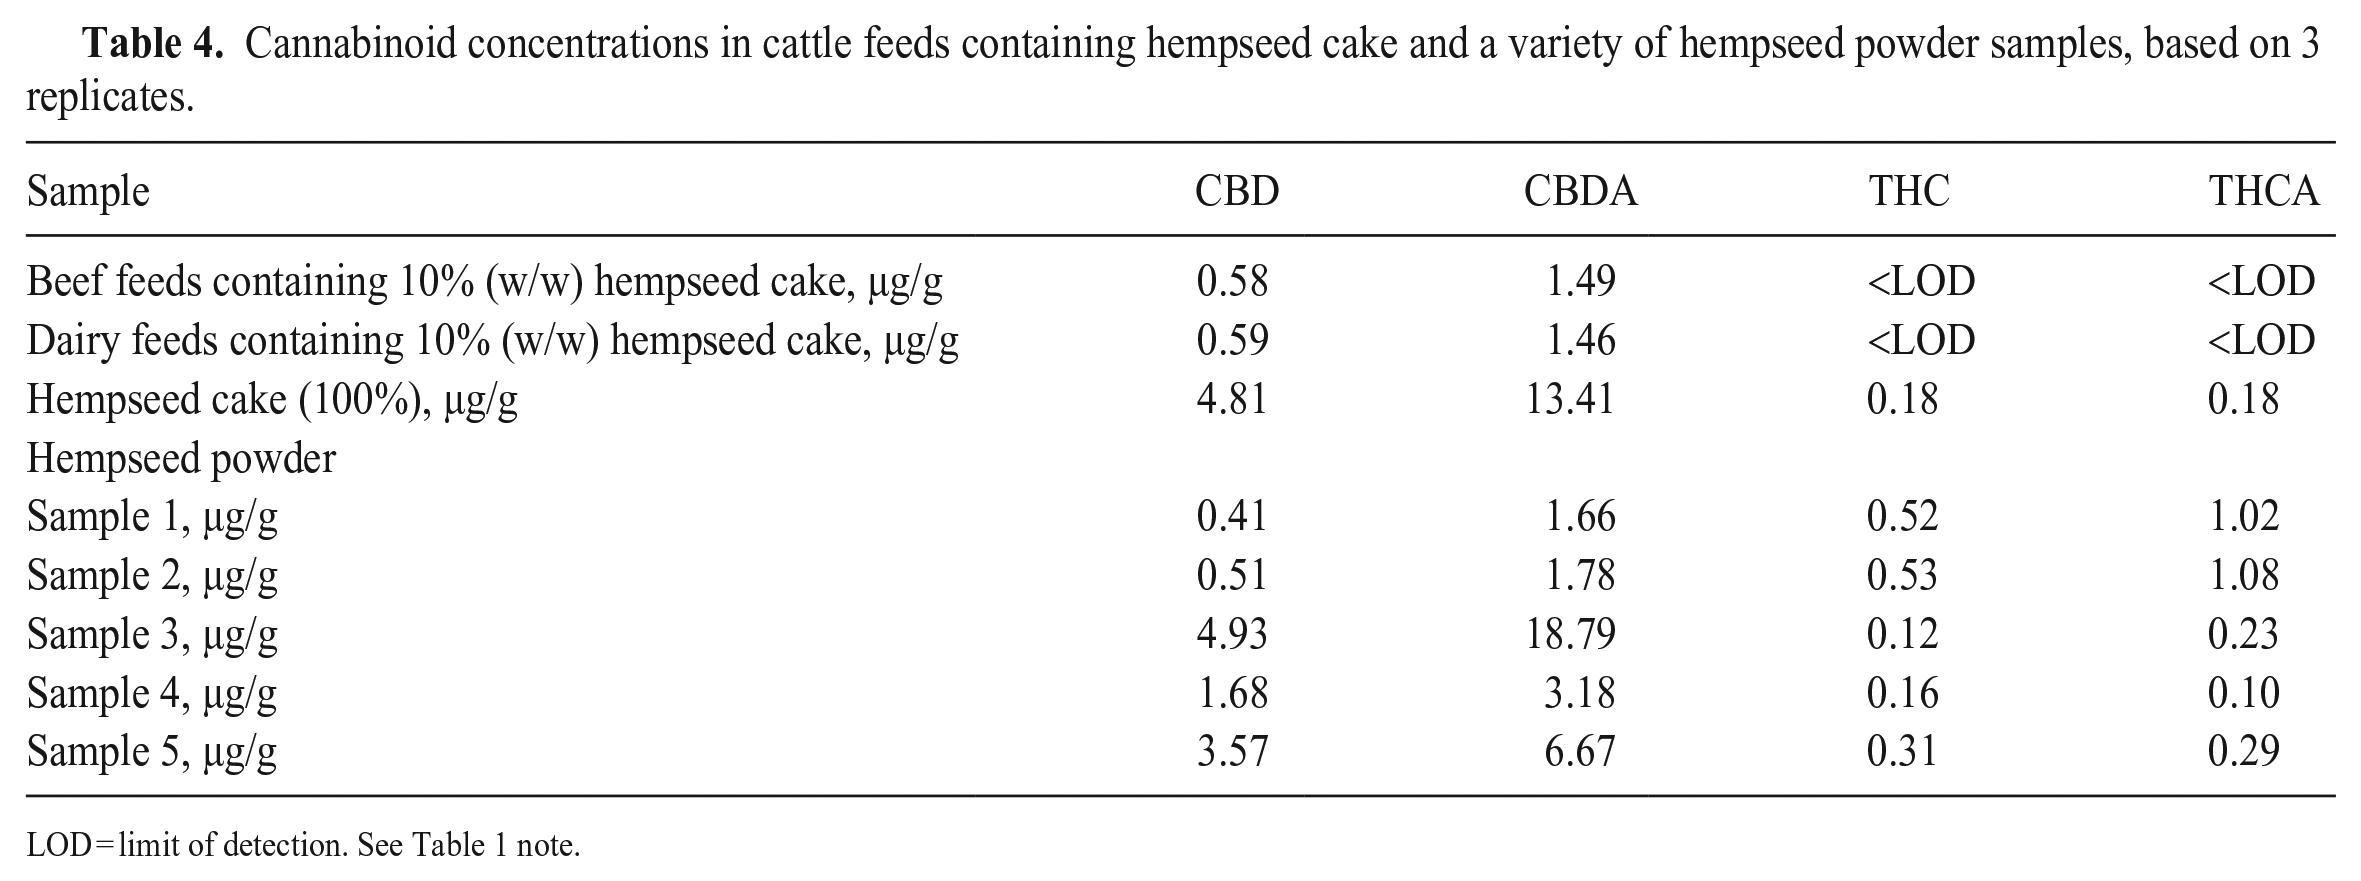
LOD = limit of detection. See Table 1 note.
In addition to the hempseed cake, we analyzed 5 commercial hempseed powder samples by our method. The powders were produced after the hempseeds were cold-pressed to remove oils and then were milled and sifted. It was expected that their properties would be similar to the hempseed cake. For each tested hempseed powder sample, all 4 major cannabinoids were detected and quantified (Table 4). Large differences in cannabinoid concentrations and profiles were found among the hempseed powders. For example, hempseed powder sample 3 had the highest concentrations of CBDA and CBD at 18.8 and 4.93 µg/g, respectively; however, its THC concentration was the lowest at 0.12 µg/g. The large variations in cannabinoid profiles of these hempseed samples could be the result of the use of different hemp varieties as source materials. 5 It is noteworthy that, although the THC concentrations were low overall in the tested hempseed samples (0.12–0.53 µg/g), our method could detect this psychoactive cannabinoid if hempseed sample 1 or 2 is added at a level of ≥ 10% in the feeds. Therefore, samples 1 and 2 may raise higher safety concerns when they are used in animal feeds.
We suggest that our method can be a very useful tool to identify cannabinoids in animal feeds suspected of being adulterated or supplemented with hemp materials. Our method could also be used to quantify cannabinoid profiles for research studies involving hemp application in animal feeds.
Footnotes
Acknowledgements
We thank Dr. Rajasekhar Kasula for providing the hempseed cake.
Declaration of conflicting interests
The authors declared no potential conflicts of interest with respect to the research, authorship, and/or publication of this article.
Funding
Our study was supported by the Pennsylvania Department of Agriculture.