
Abstract
Serotonin is regularly measured in equine platelet-poor plasma in research settings. However, reported reference values vary between studies, partially because plasma serotonin concentrations are very low and a reliable and affordable detection method is lacking. A simple, rapid, and sensitive method for serotonin determination in equine platelet-poor plasma using liquid chromatography–tandem mass spectrometry (LC-MS/MS) was developed and validated. Results of a commercially available enzyme-linked immunosorbent assay (ELISA) were compared to the LC-MS/MS results, in order to validate a test more suitable for use in a clinical situation. For LC-MS/MS, 500 µl of plasma was required, and deuterated serotonin was used as an internal standard. The sample preparation was based upon a simple liquid extraction into ethyl acetate. Chromatographic separation was performed with an acetic acid–acetonitrile mobile phase gradient elution. Linearity was demonstrated between 3 ng/ml and 100 ng/ml. A limit of quantification of 3 ng/ml was achieved, corresponding to a limit of detection of 0.10 ng/ml. Comparison of LC-MS/MS and ELISA with Passing–Bablok regression and Bland–Altman plotting showed a poor agreement between the 2 methods, with an increasing difference within the higher range of measurements. Caution is needed when extrapolating results from sources using different analytical techniques.
Keywords
Introduction
Serotonin (5-hydroxytryptamine [5-HT]) is an important signaling molecule in the body (Fig. 1 for chemical structure), exerting several neurotransmitter functions inside and outside the brain and playing a key role in regulating gastrointestinal motility. In the circulatory system, serotonin has a hormonal function modulating the vascular tone and also plays a role in platelet activation.8,16 Most of the body’s serotonin is produced by the enterochromaffin cells located in the intestinal mucosa. Overproduction of serotonin by enterochromaffin cells causes a 5-HT overflow towards the intestinal lumen and the portal circulation. 16 Plasma serotonin is quickly transported into the platelets via specialized transporters on the platelet membrane. Upon activation, platelets release significant amounts of serotonin, causing a rise in plasma 5-HT.10,16 Therefore the concentration of free serotonin is typically measured in platelet-poor plasma (PPP), produced by prolonged or high-speed centrifugation of plasma and containing <10,000 platelets/µl. 27
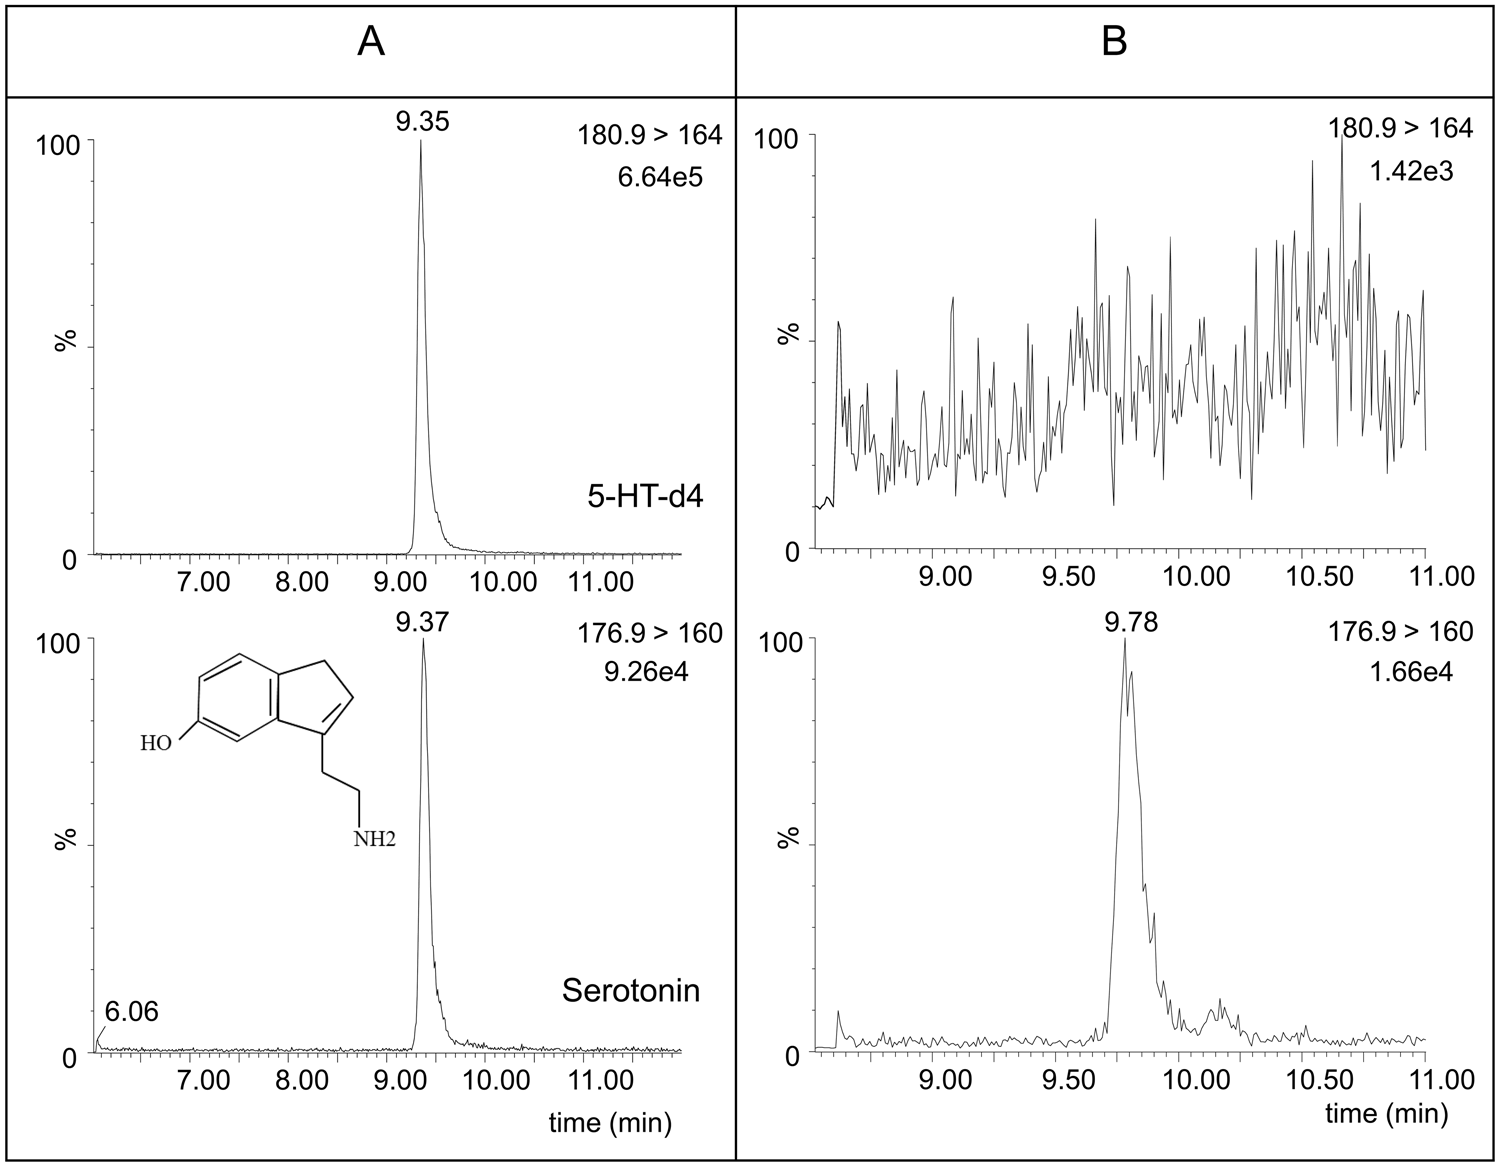
Structure of serotonin and an extracted-ion chromatogram of serotonin and deuterated serotonin (5-HT-d4) for an equine platelet-poor plasma sample spiked at 3 ng/ml (
Increased plasma concentrations of 5-HT have been linked to multiple conditions in human medicine. 8 In horses, elevated 5-HT levels have been reported following endotoxemia.5,10,21 An association has been found between increased plasma 5-HT concentrations and digital hypoperfusion causing laminitis.4-6,21,22 Other research groups have demonstrated serotonin changes in surgical colic cases,3,13 recurrent airway obstruction, 17 Cushingoid horses, 18 and other acute or chronic disease states. 3
Serotonin plasma levels are also subject to physiological variations.1,2,7,18,31 Even in healthy horses, reported reference values for serotonin are not consistent, which hampers further research into the role of serotonin in equine diseases. Reported PPP serotonin values in healthy horses range from 2.5 ng/ml to 90 ng/ml with a majority varying between 3 ng/ml and 30 ng/ml.1,2,4,6,7,13,17-19,21 One possible explanation for this inconsistency is the use of different analytical techniques. Therefore, it is essential to develop fast and reliable detection methods, which are well validated for use on equine plasma samples.
Different methods have been described for serotonin measurement; however, most were developed for human plasma analysis. High-performance liquid chromatography (HPLC) with amperometric detection,25,32 electrochemical detection,1,6,30,33,35 coulometric detection,20,34 and fluorescence detection 13 have been reported. It must be mentioned that none of these methods make use of a more conventional ultraviolet detector, due to the insufficient ultraviolet-absorbing capacities of serotonin. Therefore, all of these methods require specific detectors or inclusion of extra derivatization steps of the analyte.
Some liquid chromatography–tandem mass spectrometry (LC-MS/MS) methods have been developed for serotonin determination in human whole blood, 11 platelet-rich plasma, 29 and PPP.12,24 Most of these methods are indeed very specific and fast, the latter12,24 based on the use of on-line sample preparation technologies that require extra hardware investments. Others used off-line solid-phase extraction as sample clean-up, which is a time-consuming and expensive method in a routine analytical environment. Both the complexity of the matrix to be assayed and the expected serotonin concentrations have to be considered when selecting a sample preparation technique. 25 It was, therefore, the aim of the current study to develop a simple, rapid, and sensitive method to quantitate serotonin in equine PPP with LC-MS/MS detection.
Besides chromatographic methods, commercially available enzyme-linked immunosorbent assays (ELISAs)3,23 or radioimmunoassays (RIAs) 18 have occasionally been used for rapid determination of serotonin in horse plasma or serum. A second aim of the present study was to compare the results obtained with the developed LC-MS/MS method with those obtained using a commercially available human serotonin ELISA kit. The use of such kits would greatly facilitate serotonin analysis in equine medicine, especially in a clinical situation.
Materials and methods
Samples
Samples were obtained from healthy horses (n = 24) and horses undergoing laparotomy for small intestinal colic (n = 34). A total of 152 platelet-poor ethylenediamine tetra-acetic acid (EDTA) plasma samples were prepared according to protocols earlier described.7,13 Further, 6 activated platelet samples, prepared by adding collagen a (15 µg/ml) to platelet-rich EDTA plasma, and 6 serum samples were collected to obtain a wide range of serotonin concentrations.
Liquid chromatography–tandem mass spectrometry
Standard solutions
For LC-MS/MS analysis, deuterated serotonin b (5-HT-d4) was used as an internal standard. Separate stock solutions of serotonin c and 5-HT-d4 of 1,000 µg/ml were prepared in 10% acetic acid d in HPLC water d and stored at +4°C. Stock solutions were determined to be stable for at least 182 days under these conditions. The stock solution was further diluted with HPLC water to obtain working solutions ranging from 30 ng/ml to 1,000 ng/ml for spiking PPP samples. The stock solution of the internal standard was also diluted with HPLC water to a final concentration of 1,000 ng/ml. Tuning solutions of 1,000 ng/ml serotonin and internal standard were made by diluting the stock solution with HPLC water.
Sample preparation
The LC-MS/MS method for determination of serotonin in equine PPP is based on a simple liquid extraction. To 500 µl of plasma, 50 µl of the internal standard solution (1,000 ng/ml) were added. The samples were vortex mixed for 10 sec; thereafter, 100 µl of 1 M sodium hydroxide d were added, and the samples were vortex mixed again. Next, 4 ml of ethyl acetate d were added, and the samples were put on a rolling device for 20 min. After centrifugation for 10 min at 3,200 × g, the supernatant was transferred to another tube and evaporated to dryness under a gentle stream of nitrogen at 40°C. The residue was reconstituted in 250 µl of 0.1% acetic acid in HPLC water, and an aliquot of 20 µl was injected into the LC-MS/MS system.
LC-MS/MS method
The LC-MS/MS analyses were performed using a commercial system e consisting of a vacuum degasser, a quaternary MS pump, an autosampler with cooling device, and a triple quadrupole mass spectrometer e equipped with an electrospray ionization source operating in positive ion mode, run by Masslynx software. e
For chromatographic separation, a 3.5 µm column f (100 × 3.0 mm) with a guard column of the same type was used. A gradient elution, at a flow rate of 0.2 ml/min, was performed with mobile phase A consisting of 0.1% acetic acid in HPLC water, and mobile phase B of acetonitrile. d The following linear gradient was used: 0–3 min 99% A to 1% B, 5–6 min 60% A to 40% B, and 6.5–16 min 99% A to 1% B.
Operating conditions for the electrospray ionization source were optimized by infusing a mixture of serotonin and 5-HT-d4 each at a concentration of 10 µg/ml via a syringe pump. The following tune parameters were obtained for optimal serotonin detection: capillary voltage, 3.0 kV; cone, 20 V; cone gas flow-rate, 50 l/hr; desolvation gas flow rate, 750 l/hr; source temperature, 120°C; desolvation temperature, 200°C. These tune parameters were also suitable for the detection of 5-HT-d4, given the structural similarity between these components. The optimal collision energy in the MS/MS mode, corresponding to nearly 100% fragmentation of the protonated molecular ions of serotonin (m/z 176.9 for a relative molecular mass [Mr] of 176.21), was found to be 10 V. For 5-HT-d4 (m/z 180.9 for Mr of 180.23), the optimal collision energy was also determined at 10 V. Under these conditions, the most abundant product ion was at m/z 160 and 164 for serotonin and 5-HT-d4, respectively. Quantification was performed with the Masslynx software, e using the above-mentioned product ions.
LC-MS/MS method validation
The proposed method was validated by a set of parameters that are in compliance with the recommendations as defined by the European Commission.14,15 The method was validated in pooled PPP obtained from 3 healthy horses. The following parameters were determined:
Linearity: determined on calibration curves using spiked samples at concentrations of 3, 5, 10, 20, 50, and 100 ng/ml. Peak area ratios between serotonin and 5-HT-d4 were plotted against the concentration of serotonin, and a linear regression was performed. The acceptance criterion was a correlation coefficient r ≥ 0.99 and a goodness-of-fit coefficient g ≤ 10%.
Accuracy: determined by analyzing 6 independently spiked samples at the same spike level (2 levels evaluated: 5 ng/ml and 20 ng/ml). The accuracy (%), expressed as the difference between the mean found concentration and the spiked concentration, should be in the range of −30% to +10% for levels <10 ng/ml and −20% to + 10% for levels ≥10 ng/ml.
Precision: expressed as the relative standard deviation (RSD, %). For the within-day precision, the RSD should be lower than RSDmax, which is determined as two-thirds of the values calculated according to the Horwitz equation (i.e., RSDmax = 2/3 × 2(1-0.5 log C)), with C being the concentration (g/ml) at which the sample is fortified. Precision was determined using the same samples as for the accuracy. The between-day precision was evaluated on quality control samples spiked at 10 ng/ml and 20 ng/ml. The samples were prepared and analyzed on different days. The RSD should be lower than the RSDmax = 2(1-0.5 log C).
Limit of quantification (LOQ): determined as the lowest concentration for which the method is validated with an accuracy and precision that fall within the ranges recommended by the European Union.
Limit of detection (LOD): determined as the lowest measured content from which it is possible to deduce the presence of the analyte with reasonable statistical certainty, using the criterion of a signal-to-noise (S/N) ratio equal to 3.
Enzyme-linked immunosorbent assay
Results obtained from a commercial human serotonin ELISA kit g were compared with the LC-MS/MS results. The ELISA was performed following the manufacturer’s instructions. The assay principle is a competitive ELISA, with colorimetric detection performed by an ELISA microplate reader h at 405 nm. The sample preparation step includes derivatization of serotonin to N-acylserotonin, which leads to a 23.5-fold dilution of plasma samples. The calibration curve was prepared with acylated serotonin standard delivered with the kit.
The recovery of serotonin from equine plasma was assessed by spiking PPP with equal amounts of acylated serotonin standard g at different concentrations (0.00, 0.08, 0.24, 0.73, 2.2, 6.6, and 19.8 ng/ml). Also, a dilution series was prepared by diluting acylated serotonin standard (19.8 ng/ml) with equine PPP (1:1; 1:2; 1:4; 1:8). Platelet-poor plasma was used to obtain the lowest possible background serotonin levels. All analyses were performed in duplicate. Recovery was calculated as a percentage using the following formula: (measured 5-HT level/calculated 5-HT level) × 100. The recovery was assessed for sample serotonin concentrations ranging from 3.9 ng/ml to 236 ng/ml.
Data analysis
Agreement between LC-MS/MS and ELISA results was assessed by Passing–Bablok regression analysis and Bland–Altman plotting. Passing–Bablok regression 28 is a nonparametric linear regression procedure. After plotting the concentrations determined by the 2 methods, the regression curve should not significantly deviate from the equation line (y = x). A slope significantly different from 1 indicates the presence of a proportional error while an intercept different from 0 can be related to a systematic error. Bland–Altman plotting 9 assesses the presence of a proportional error by evaluating the relationship between the differences between 2 observations (ELISA and LC-MS/MS serotonin concentration) and their average. The method is also suitable to reveal systematic bias and to identify outliers. All analyses were performed using MedCalc statistical software, i and P values of <0.05 were considered significant.
Results
Method development and validation: LC-MS/MS
The chemical structure of serotonin is shown in Figure 1. In the MS mode, the most prominent ion is the protonated molecular ion [M+H]+ at m/z 176.9 for serotonin and at m/z 180.9 for 5-HT-d4. In the MS/MS mode, the most abundant ion is at m/z 160 for serotonin and at m/z 164 for 5-HT-d4. Figure 1 also shows an extracted-ion chromatogram of serotonin and 5-HT-d4 for a PPP sample spiked at the LOQ level of 3 ng/ml (Fig. 1A) and of an unspiked PPP sample (Fig. 1B). At the trace of 5-HT-d4, no peak could be detected in the PPP sample used as blank sample. For serotonin, there was a peak detected due to the endogenous serotonin level, but the intensity was almost 10 times lower than the spiked plasma at the LOQ level.
In Figure 2, the calibration curve, ranging from 3 ng/ml to 100 ng/ml, obtained with the LC-MS/MS method is presented as the mean of 8 calibration curves. The 8 curves were made over a period of 259 days, and each curve originated from a new set of extractions. The goodness-of-fit coefficients (g) of the individual calibration curves were all <10%, and the correlation coefficients (r) were all >0.99.
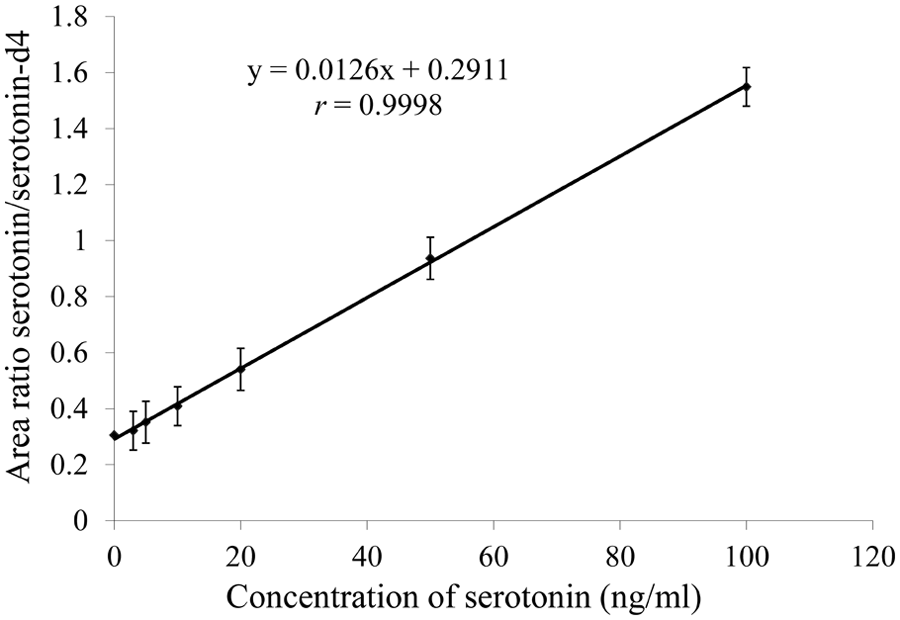
Calibration curve of serotonin in horse plasma (platelet-poor plasma) represented as the mean of 8 calibration curves obtained over a period of 259 days.
The results of the accuracy, within-day, and between-day precision evaluation are summarized in Table 1. The accuracy and precision fell within the specified ranges, proving a good repeatability and reproducibility of the method.
Within- and between-day accuracy and precision of the liquid chromatography–tandem mass spectrometry method for quantification of serotonin in horse plasma (platelet-poor plasma).*
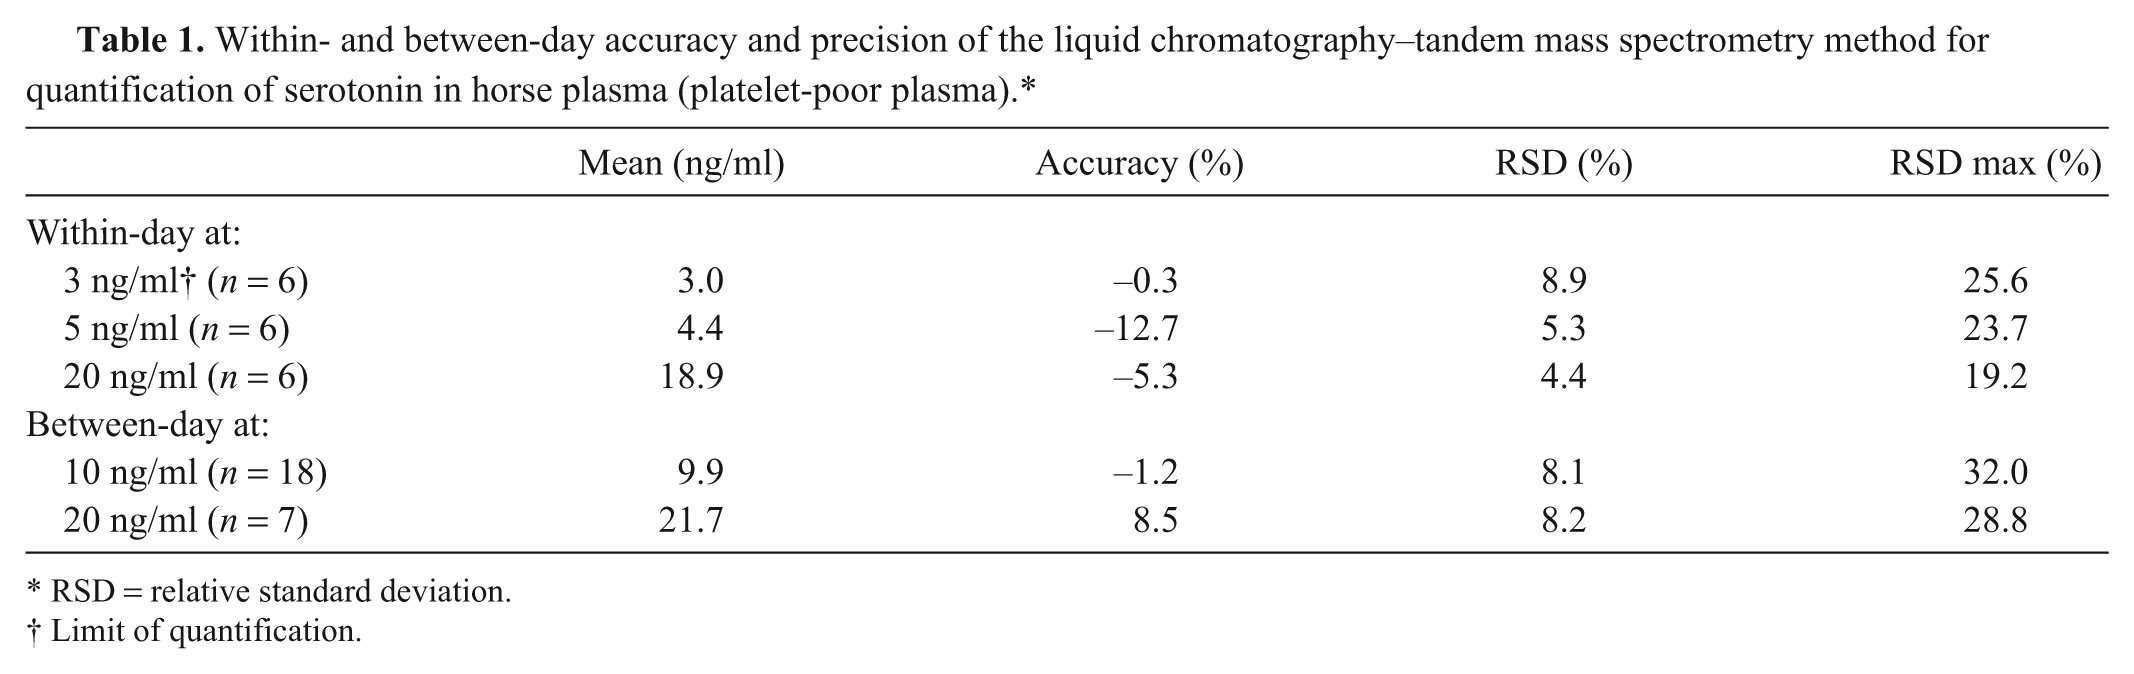
RSD = relative standard deviation.
Limit of quantification.
Because a spike level of 3 ng/ml could be quantified fulfilling the criteria for accuracy and precision, it was set as the LOQ. The results are also summarized in Table 1. With an LOQ below the normal endogenous concentrations of serotonin, the sensitivity was considered suitable for the determination of serotonin levels in horse PPP.
For the determination of the LOD, the S/N ratio of the serotonin peak in the LOQ samples was used. The mean S/N ratio for the 6 LOQ samples at 3 ng/ml was 92.4, corresponding to an LOD of 0.10 ng/ml.
Method validation: ELISA serotonin recovery from equine plasma
Recovery was calculated from equine PPP spiked with 7 different concentrations of 5-HT and from a dilution series of serotonin standard with 4 different amounts of equine PPP. Mean recovery was 105% (range: 83–127%; Table 2).
Recovery of spiked serotonin from equine platelet-poor plasma with a commercial enzyme-linked immunosorbent assay kit.*
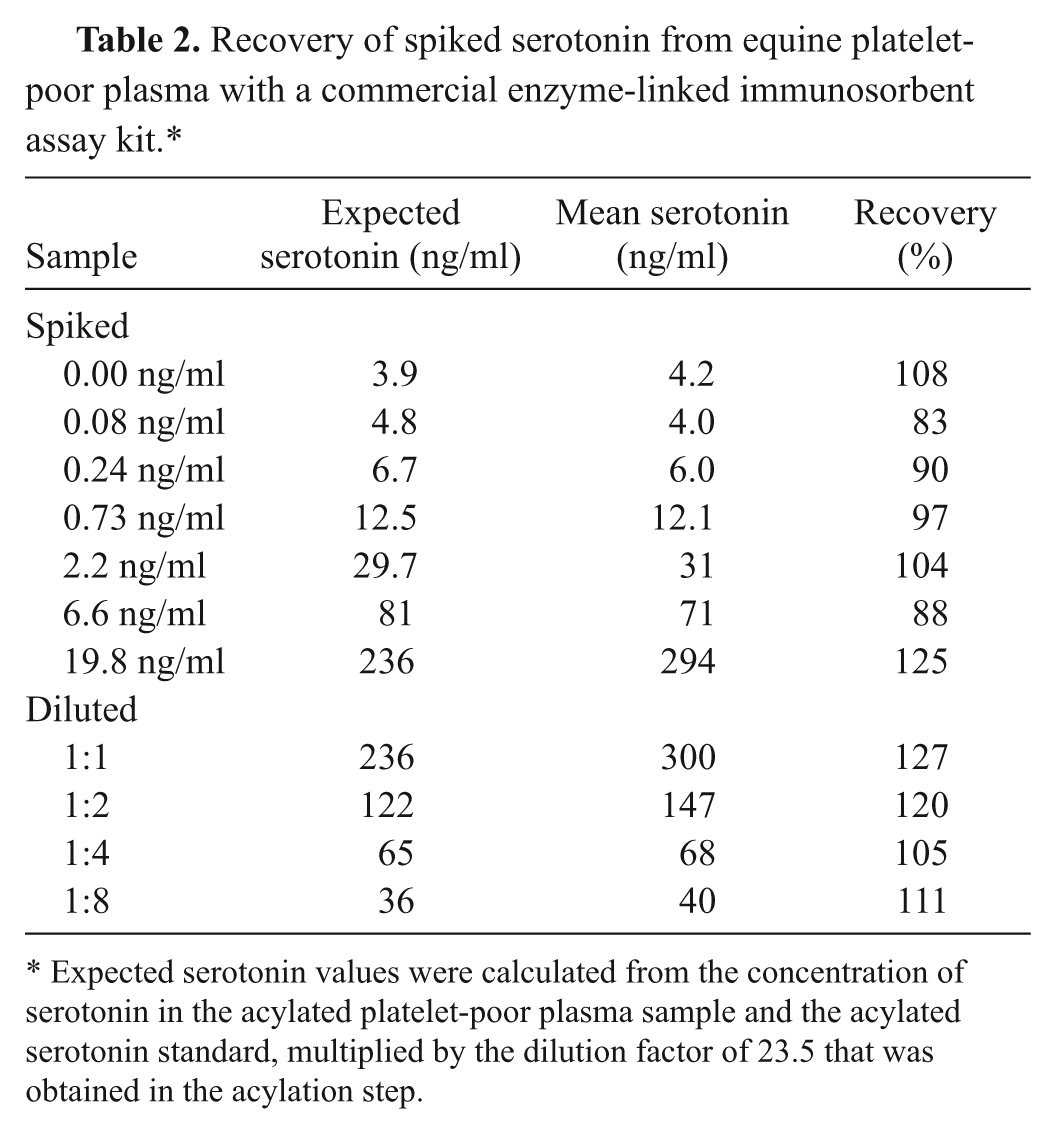
Expected serotonin values were calculated from the concentration of serotonin in the acylated platelet-poor plasma sample and the acylated serotonin standard, multiplied by the dilution factor of 23.5 that was obtained in the acylation step.
Method comparison
Results obtained from equine PPP, activated PRP, and serum with ELISA and LC-MS/MS were statistically compared. Regression analysis showed that the 2 methods were highly correlated (Pearson r2 = 0.94, P < 0.001, n = 164). However, Passing–Bablok analysis gave a regression equation of ELISA = 1.62(LC-MS/MS) + 0.53. The 95% confidence interval (CI) for the slope did not include 1 (95% CI: 1.50–1.81; P < 0.001), indicating the presence of a proportional error (Fig. 3). Bland–Altman plotting also demonstrated poor agreement between the methods, with an increasing difference within the higher range of measurements (Fig. 4). However, a second analysis only focusing on 5-HT values in the lower range of <100 ng/ml did not demonstrate a good agreement, either.
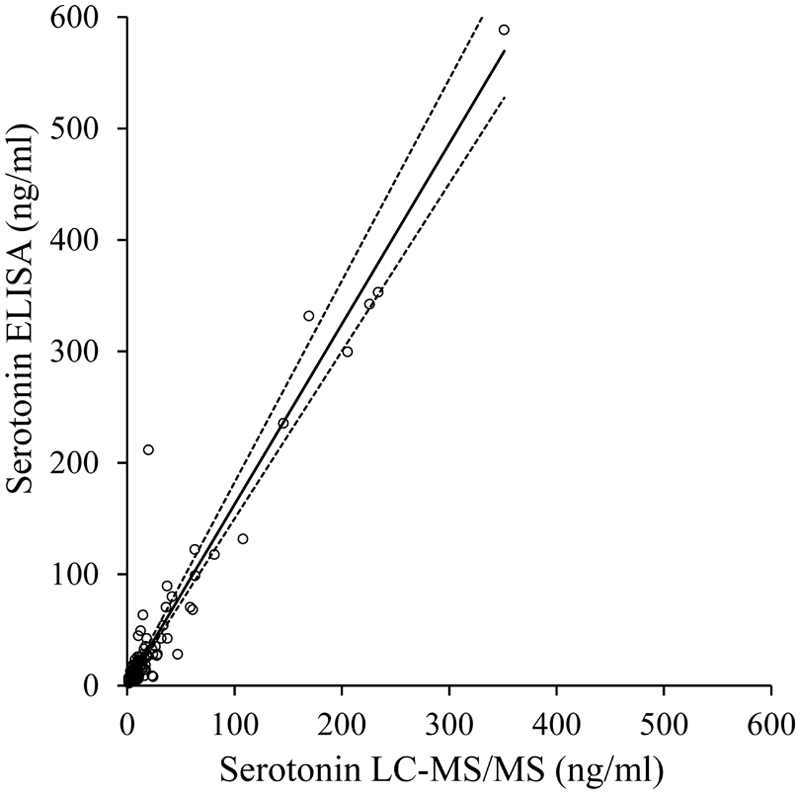
Passing–Bablok analysis between plasma and serum analyzed by enzyme-linked immunosorbent assay (ELISA) or liquid chromatography–tandem mass spectrometry (LC-MS/MS) gave the correlation ELISA = 1.62(LC-MS/MS) + 0.53. The 95% confidence interval (CI) of the slope was 1.50–1.81; r2 = 0.94; P < 0.001; n = 164. The Passing–Bablok regression line is represented by the solid line, with its 95% CI represented by the dashed line.
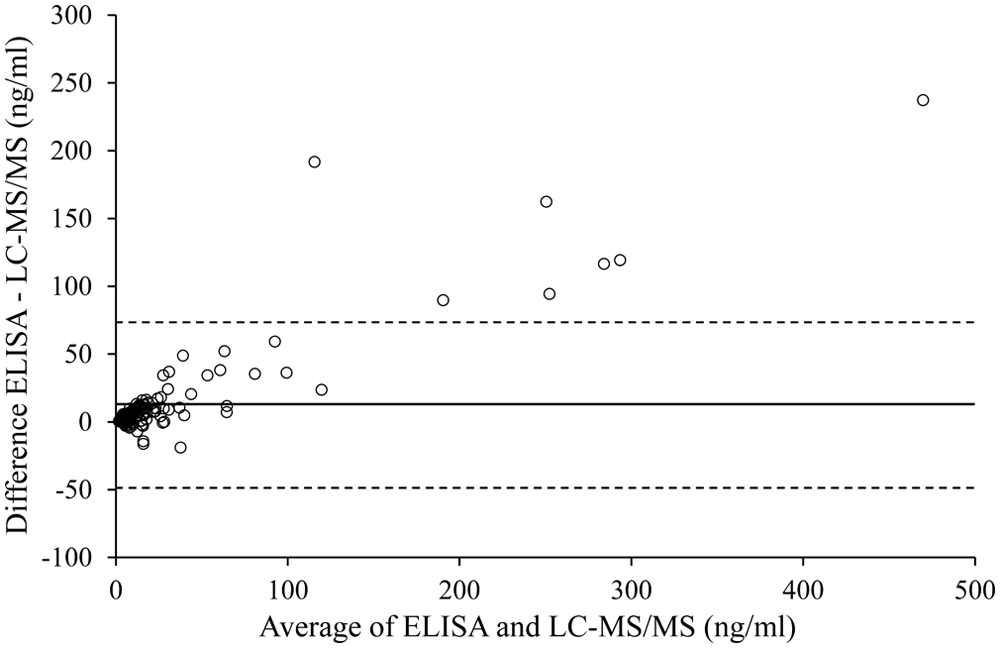
Bland–Altman plot showing poor agreement between the enzyme-linked immunosorbent assay (ELISA) and liquid chromatography–tandem mass spectrometry (LC-MS/MS) method for determination of serotonin (5-HT) in equine plasma and serum, with a mean bias (solid line) of 12.5 ng/ml (ELISA–LC-MS/MS) and 95% limits of agreement (dashed lines) of −49.2 ng/ml to 74.3 ng/ml.
Discussion
Multiple research groups have studied serotonin physiology and pathology in horses. However, a gold standard method for serotonin analysis is not available or published. Most commonly applied are HPLC and, to a lesser extent, ELISA methods. In the current study, a LC-MS/MS method was developed and fully validated for use in equine PPP. The method is rapid and sensitive, and especially for target analysis, LC-MS/MS has a higher specificity than the more frequently used HPLC methods. 26 The LC-MS/MS method was successfully applied for the measurement of serotonin in healthy horses and horses suffering from acute small intestinal colic. With a validated linearity in the range of 3–100 ng/ml, the developed LC-MS/MS method could be extended to research into other conditions like endotoxemia and laminitis, in which 3- to 4-fold increases in plasma serotonin values have been claimed.4,21 Because of its high sensitivity (LOD 0.10 ng/ml), the method can also be applied in studying normal serotonin physiology in horses. Because serum serotonin values are in a much higher range, varying from over 200 ng/ml with the current study to 616 ng/ml3 and 976 ng/ml 23 in previous studies, extended validation of this LC-MS/MS method is needed before its implementation in quantitating serum serotonin concentrations.
A 3.5-µm HPLC column f was used for chromatographic separation because it can be applied for a wide range of compounds and covers a wide pH range that accommodates most mobile phases. In this case, acetonitrile and acetic acid in HPLC water were used as mobile phases. Small peaks of 0.5 min were achieved with a good symmetrical peak shape. This simple chromatographic method can be implemented in any laboratory.
During the LC-MS/MS method development, a simple precipitation of plasma proteins was tested first as sample clean-up. Protein precipitation with a strong acid, however, resulted in a significant loss in detector sensitivity. Protein precipitation using acidified acetonitrile on the other hand gave rise to a turbid supernatant after centrifugation, which could not be injected on the LC-MS instrument. A more intensive sample clean-up was tested further, using solid-phase extraction with a weak cation exchanger. A poor extraction recovery was obtained despite the wide range of wash and elution solvents tested. The final extraction methodology, as described in the Materials and Methods section, makes use of a liquid extraction of the plasma samples after adjusting the pH with sodium hydroxide. This methodology resulted in acceptable serotonin recovery rates.
Serotonin is regularly determined in horse plasma in research settings. Although several ELISA kits are commercially available for serotonin determination in human plasma, such kits should not be used in horse plasma without extensive validation. In PPP, serotonin quantities are relatively low, making accurate and precise measurement quite difficult. 25 The ELISA kit evaluated in the current study had acceptable serotonin recovery rates in PPP, enabling use of the kit in a clinical situation. However, comparison of LC-MS/MS and ELISA showed a limited agreement between the 2 methods. Therefore, caution is warranted when extrapolating results from different analytical techniques.
A limitation of the current study is the nonexistence of totally serotonin-free horse plasma. Therefore, the samples used as “blanks” for serotonin recovery studies still contained a low serotonin concentration. The use of PPP samples of healthy horses kept this endogenous serotonin as low as possible. A chromatogram of unspiked PPP (Fig. 1B) demonstrates the very low endogenous serotonin concentrations, in comparison to the spiked serotonin (Fig. 1A).
Interlaboratory variation and the demonstrated lack of agreement between different measurement methods may partially explain the wide range of reported normal values for plasma serotonin. Other possible influences are different protocols used for blood sample stabilization, preparation, and centrifugation. Inadequate sample handling may lead to in vitro platelet activation and aggregation with consecutive serotonin release, causing a false increase in plasma serotonin. The use of different centrifugal speeds in the preparation of PPP causes variation in the plasma platelet content and, consequently, in the serotonin concentration. 6
It can be concluded that reliable measurement of equine plasma serotonin is possible, but there are a number of restrictions. For an accurate determination of plasma levels, it is essential to use PPP. In horses, this requires relatively high centrifugal speeds, 6 which limits the feasibility in a clinical situation. Furthermore, it is not advisable to make comparisons between absolute serotonin values determined in different circumstances or analyzed with different methods. Therefore, the establishment of method-specific serotonin plasma values is required. For chromatographic methods, the extraction step is a pitfall, and inadequate extraction may lead to underestimation of serotonin values. The newly developed LC-MS/MS method described herein is suitable for determining serotonin plasma reference values and for analyzing serotonin changes associated with pathological conditions.
Footnotes
Acknowledgements
The authors Sara C. Torfs and An A. Maes contributed equally to this work.
a.
Equine collagen type 1, American Biochemical and Pharmaceutical Ltd., Epsom, UK.
b.
CDN Isotopes, Nieuwegein, The Netherlands.
c.
Sigma-Aldrich NV/SA, Bornem, Belgium.
d.
VWR International, Leuven, Belgium
e.
Acquity 2695 LC system, Quattro Ultima; Waters, Zellik, Belgium.
f.
Eclipse Plus C18 3.5 µm column, Agilent Technologies Belgium NV/SA, Diegem, Belgium.
g.
Genway Biotech, San Diego, CA.
h.
Multiskan FC, Thermo Scientific, Erembodegem, Belgium.
i.
MedCalc Software BVBA, Mariakerke, Belgium.
Declaration of conflicting interests
The author(s) declared no potential conflicts of interest with respect to the research, authorship, and/or publication of this article.
Funding
The author(s) received no financial support for the research, authorship, and/or publication of this article.