
Abstract
Ionophores are widely used in veterinary medicine as coccidiostats and for improving nutrient utilization in livestock production. Because of widespread use, ionophores sometimes cause poisoning in livestock. Quantifying concentration of these compounds in feeds for diagnostic purposes is needed. A method with a single step of solvent extraction was developed for rapid simultaneous quantification of monensin, lasalocid, salinomycin, and narasin in feeds by liquid chromatography–tandem mass spectrometry (LC-MS/MS). The ionophores were extracted using methanol:water (90:10). With the high specificity and high sensitivity of tandem mass spectrometry, the extract was introduced for measurement without further processing. The effect of particle size of feeds on extraction efficiency was also investigated. It was found that feeds passing through a 1-mm filter or sieve show better quantitative extraction. Nigericin was used as internal standard for the measurement. The method was validated by fortification of the selected ionophore compounds in horse feed at different concentrations. The typical recovery rate was 69–122%. Meanwhile, various interlaboratory proficiency test samples of different matrices were also quantified as part of the procedure for method validation. A good agreement was found between results and the suggested values. The method is very sensitive, with detection limits between 0.018 µg/g and 0.056 µg/g for the compounds tested. Results showed that the lower limit of quantification was 0.2 µg/g for the ionophore compounds, which is much lower than the contents of the ionophores in medicated feeds, which is generally approximately 10–100 µg/g feed.
Ionophore antibiotics are relatively small organic molecules that serve as mobile carriers of cations across cell membranes. Monensin, lasalocid, salinomycin, and narasin are the most commonly used ionophore drugs in animal agriculture. They are used for prevention and treatment of coccidiosis in poultry and as growth promoters in livestock. For these purposes, usually these 4 drugs are added at concentrations ranging from 10 µg/g to 100 µg/g of feed. Because of their widespread use, ionophore antibiotics have been associated with poisoning in livestock. There are also some concerns about drug residues in chicken muscle, liver, and eggs.1-4,7,8,11
Quantitative feed sample analysis is often required to confirm diagnosis of ionophore poisoning. Currently, high-performance liquid chromatography (HPLC) is the most widely used technique for the analysis of ionophore compounds. Since these compounds do not have a strong chromophore for ultraviolet (UV)-visible detection, post-column derivatization is always necessary for their measurement by HPLC. 6 Furthermore, due to the low specificity of UV-visible detection, a lengthy sample preparation procedure to separate the analytes from interfering substances is usually required. Extensive sample preparation steps are partly responsible for the long turnaround time associated with HPLC analysis.
There are only a few published methods for screening or quantification of ionophore compounds in animal feeds2,9,10; however, these published methods are cumbersome and time consuming. Recently, the current authors reported a rapid liquid chromatography–tandem mass spectrometry (LC-MS/MS) qualitative method for detection of monensin, lasalocid, salinomycin, and narasin in feeds that can be completed within 4 hr. 5 Also, a 2008 study described a quantitative LC-MS/MS method for quantitation of ionophore compounds in feeds. 10 According to the 2008 report, regular chemical extraction is followed up by solid phase extraction prior to chromatographic analysis. In addition, quantitation in the method involves the laborious use of matrix-matched standards or the standard addition technique. 10 Aware that the technique is laborious, the investigators of the 2008 report published a simpler method using the standard additions technique. 11 In clinical diagnostic laboratories a short turnaround time is essential for rapid diagnosis to save animal lives.
In the current study, LC-MS/MS was used for simultaneous quantitation of monensin, lasalocid, salinomycin, and narasin in animal feeds using a simple extraction procedure followed by chromatographic quantitation using nigericin as an internal standard. The purpose of this research was to establish a rapid and accurate method for simultaneous quantitative analysis of multiple ionophores. Furthermore, the effect of particle size on extraction efficiency of ionophore antibiotics from animal feeds was determined. Horses are the most sensitive farm animal to poisoning by ionophore antibiotics. Therefore, horse feed was chosen for use in the present studies.
The following high-purity reagents were used: lasalocid (93.4% purity) a ; monensin sodium salt (90–95% purity by thin layer chromatography b ; salinomycin (from Streptomyces albus, ≥98.0% purity) b ; narasin (from Streptomyces aureofaciens, ≥97% purity) b ; nigericin (>98% purity) b ; acetonitrile (ACN) c ; methanol c ; and HFBA (heptafluorobutyric acid, 99% purity). b General equipment used included a centrifuge, d mill with 1-mm filter, e wrist action shaker, f and syringe filters (0.2-µm polytetrafluoroethylene [PTFE] membrane, 13 mm in diameter). g The analytical equipment used included a triple quadrupole mass spectrometer with electrospray ionization. h Measurements were carried out under positive ion mode. Nitrogen gas was supplied by a nitrogen generator. i The HPLC system had an autosampler. A 50 mm × 2.1 mm (particle size: 5 µm) h column and a 10 mm × 2.1 mm (particle size: 5 µm) guard column h were used in the current study. The mobile phase was ACN:water, containing 20 mM of HFBA. The flow rate of the mobile phase was 300 µl/min. The analytes were eluted by the following procedure: 0–1.0 min: ACN 70%; 1.0–3.0 min: increase of ACN to 100%; 3.0–6.0 min keeping ACN at 100%; 6.1 min decrease of ACN to 70%, and keeping the ratio until 9.0 min for equilibrium for the next measurement. The triple quadrupole mass spectrometer was set up to the following MS/MS conditions: spray voltage 4500, sheath gas pressure 25, ion sweep gas pressure 5, auxiliary gas pressure 25, and capillary temperature 270ºC, and skimmer offset 0 with collision pressure 1.5. Argon was used as a collision gas. A summary of the parent and product ions under these conditions is given in Table 1.
Precursor and product ions of ionophores.*
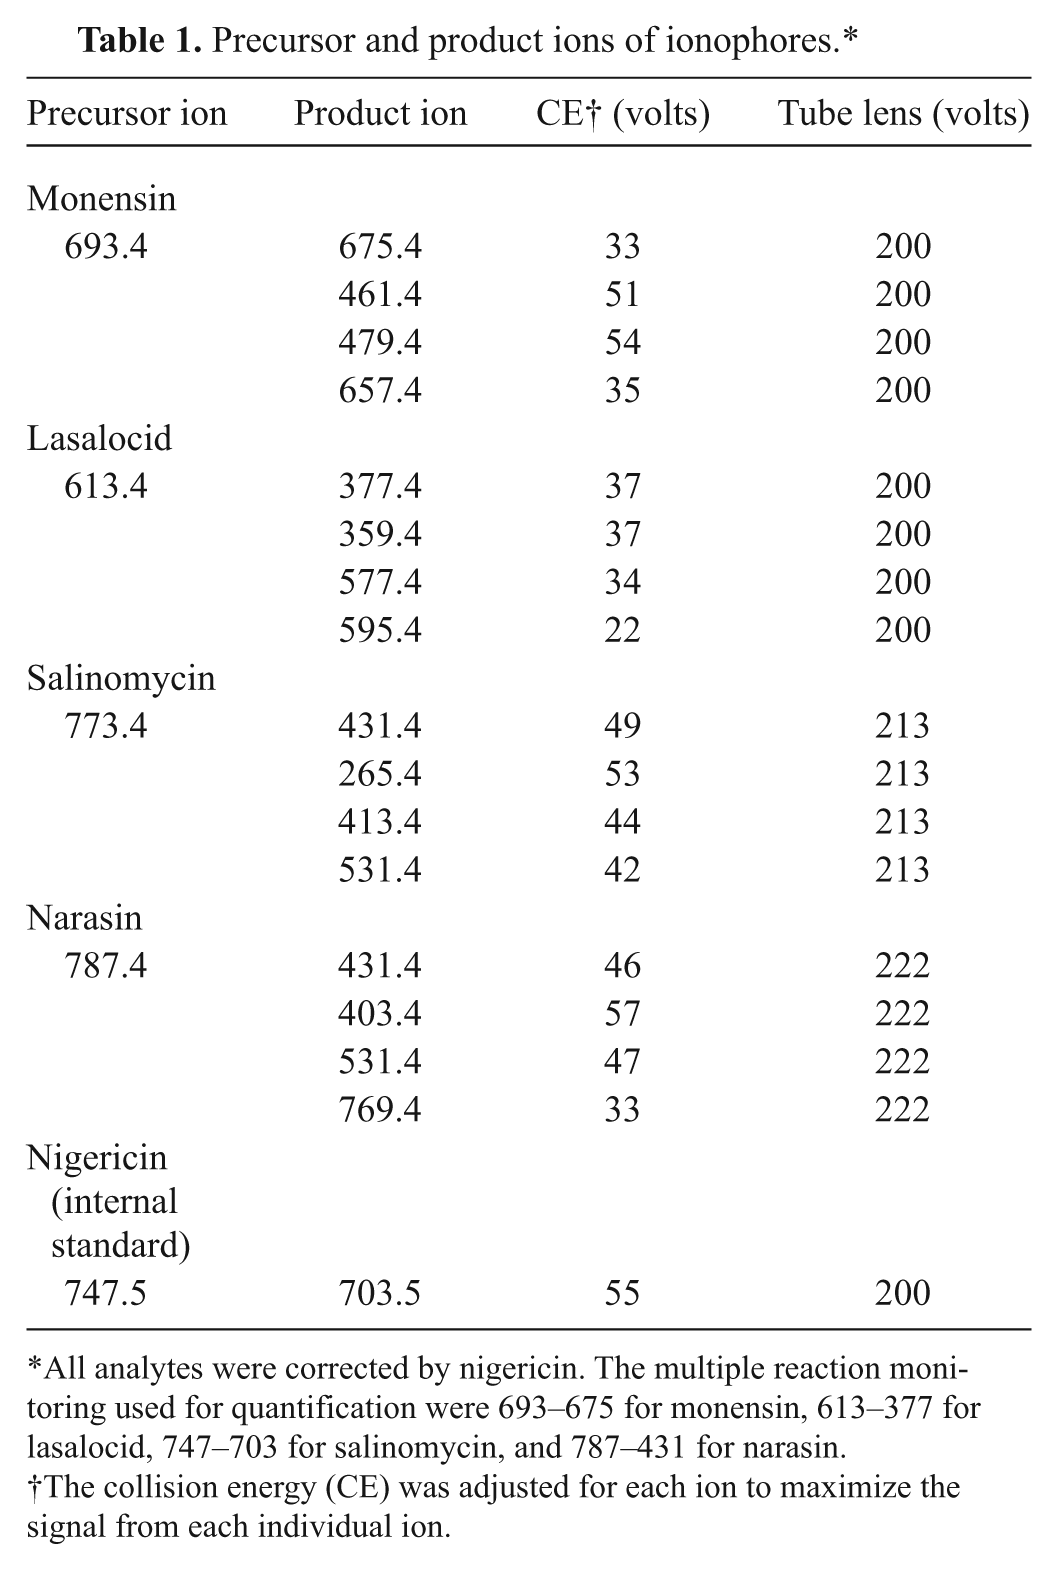
All analytes were corrected by nigericin. The multiple reaction monitoring used for quantification were 693–675 for monensin, 613–377 for lasalocid, 747–703 for salinomycin, and 787–431 for narasin.
The collision energy (CE) was adjusted for each ion to maximize the signal from each individual ion.
The procedure for sample extraction was similar as previously described. 5 Briefly, 100 ml of methanol:water (90:10) was added to 5.0 g of feed in a 250-ml stoppered flask and extracted using a wrist action mechanical shaker for 1 hr. Particulate matter was allowed to settle for 5 min. Approximately 10 ml (no accurate volume measurement necessary) of the extract was poured into a glass tube with a cap and centrifuged at 560 × g for 5 min. The supernatant was filtered using a 0.2-µm filter or sieve with a disposable syringe (0.2 µm PTFE membrane, 13 mm in diameter). g The dilution factor (DF) for the solution was 20 (20 DF, 5.00 g to 100 ml). An aliquot of the filtrate was then adjusted to a DF of 200 using methyl alcohol:water (90:10), with the addition of nigericin as internal standard to a final concentration of 1 µg/ml in the solution. For samples with ionophore concentrations at 5 µg/g or lower, the final solution was adjusted to a DF of 40 containing the same amount of internal standard (1 µg/ml). Samples with expected ionophore concentrations higher than 100 µg/g should be diluted further to keep the signal intensity lower than that of 0.6 µg/ml, the highest standard solution for calibration. The same procedure is applied to blank horse feed (negative control), as well as to horse feed spiked with 1 µg/g of monensin, lasalocid, salinomycin, and narasin for validating the instrument conditions. The assay linear range is 0.2–0.6 ug/ml. Preparation of standard solutions was done as previously reported. 5
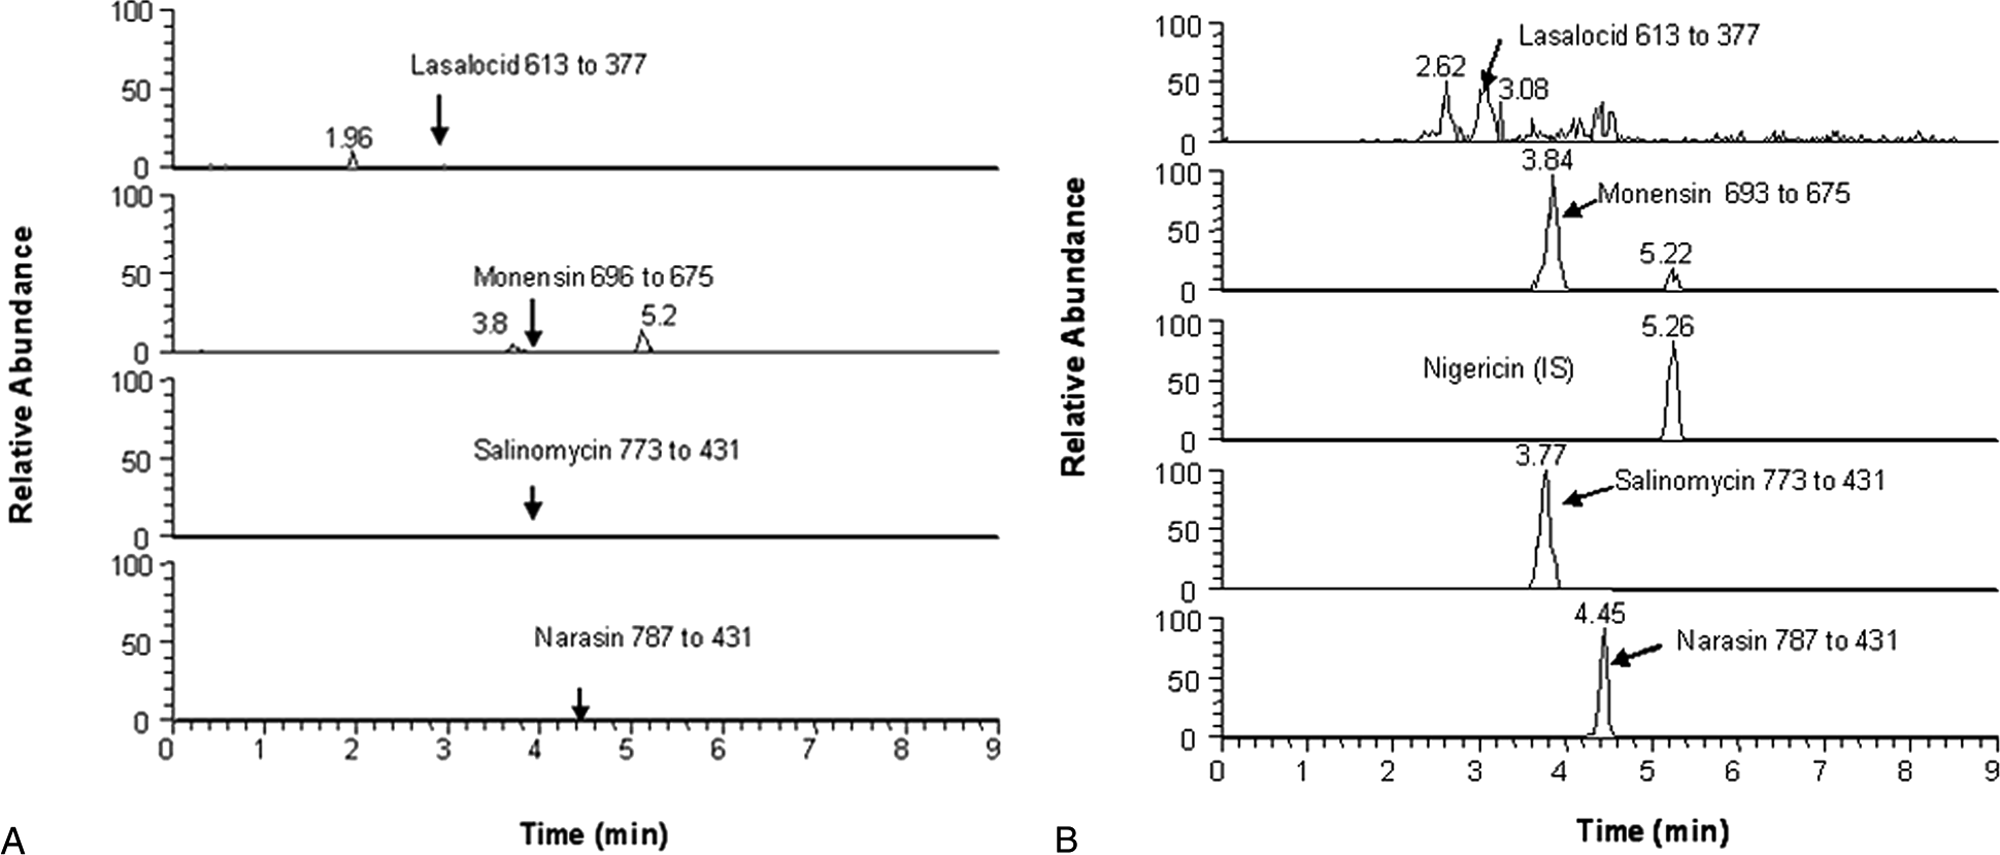
Monensin, lasalocid, salinomycin, and narasin were measured in feeds after methyl alcohol:water (90:10) extraction steps, as reported above, without further purification. It is understandable that the quality of the extract matrices may severely suppress the analytical signal. The extract matrices may also contaminate the mass spectrometer and require more frequent cleaning and maintenance. To avoid these problems, 2 strategies were used. First, the eluent before the analytes were eluted from the column were discarded. Under the HPLC procedure described, the retention times for monensin, lasalocid, salinomycin, and narasin were 3.8, 3.1, 3.8, and 4.4 min, respectively, as shown in Figure 1. As such, the eluent of the first 2 min was discarded. Secondly, a guard column was used, h which is essential in order to employ a simple sample preparation procedure for ionophore quantification developed in the current study without contaminating the mass spectrometer.
The effect of particle size on extraction efficiency of ionophores was also investigated. For this part of study, monensin was selected for testing because it is the most widely used compound of all the ionophores. Other ionophore compounds, with very similar properties, are expected to show similar tendency with that of monensin. To investigate the particle size effect, 5 samples (A–E) containing monensin were selected for the extraction experiment. Initially, the samples were ground in a mill for 2 min without sieving, then extracted and measured. Then, they were ground and passed through a 1-mm sieve, extracted, and measured. Results showed that the extraction efficiency of the sieved samples was better, in some cases by as much as 50%, compared to non-sieved samples (Fig. 2). On the basis of these results, all of the samples, whether they were originally in powder or in pellet forms, were ground; only powders passing through the 1-mm sieve were used for extraction and quantification of ionophores.
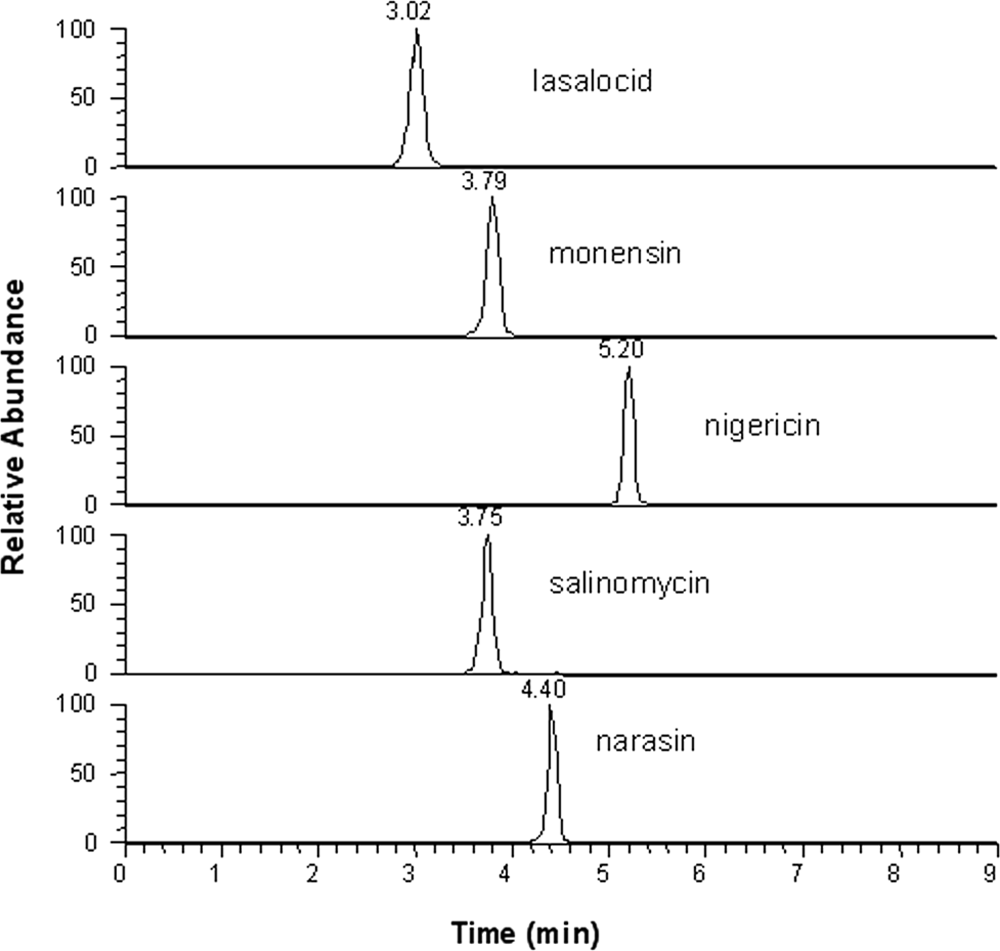
Chromatography of eluting monensin, lasalocid, salinomycin, and narasin at a spike amount of 10 µg/g, with liquid chromatography–tandem mass spectrometry detection under multiple reaction monitoring.
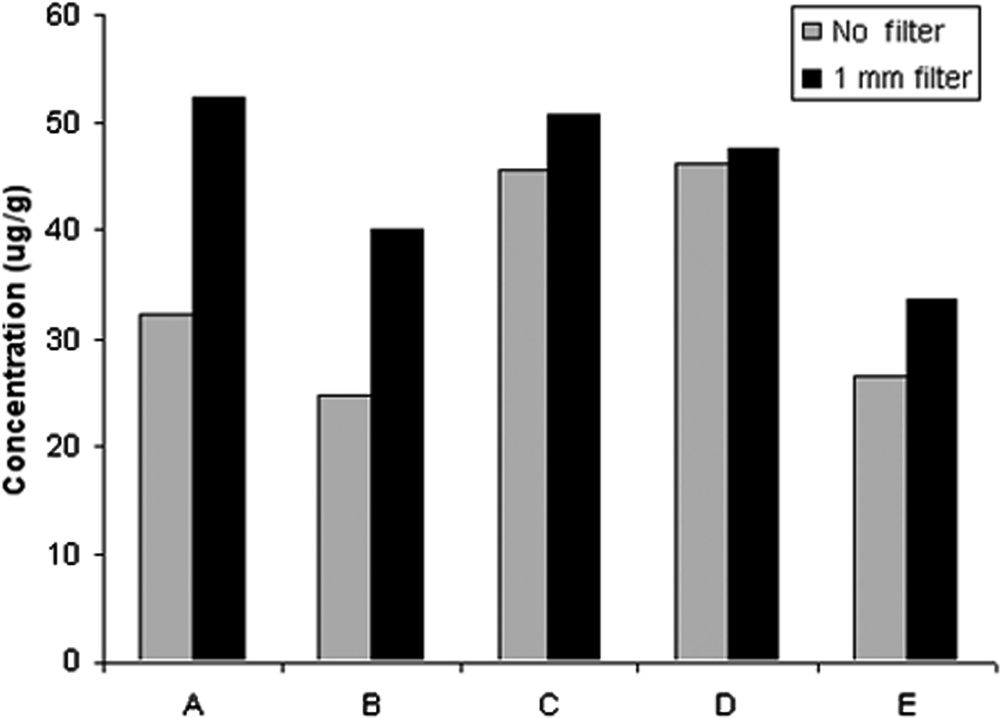
Investigation of particle size effect on extraction efficiency. The signal of monensin in all of the 5 samples (
The current study also investigated the stability of monensin in the extract. The primary extract solution (5.00 g of feed in 100 ml of methyl alcohol:water solvent) was used. Specifically, some unknown samples (a–h) containing monensin were extracted once, and the concentrations of ionophores in the extracts were measured 3 times (i.e., on day 1, day 3, and day 6). The extracts were stored at room temperature for the duration of the study. Results of stability of extracts are shown in Table 2. The ionophore concentrations were similar for all of the samples measured on days 1–6.
Stability test results of the extraction solutions (monensin in horse feed pellet, concentration in µg/g).*
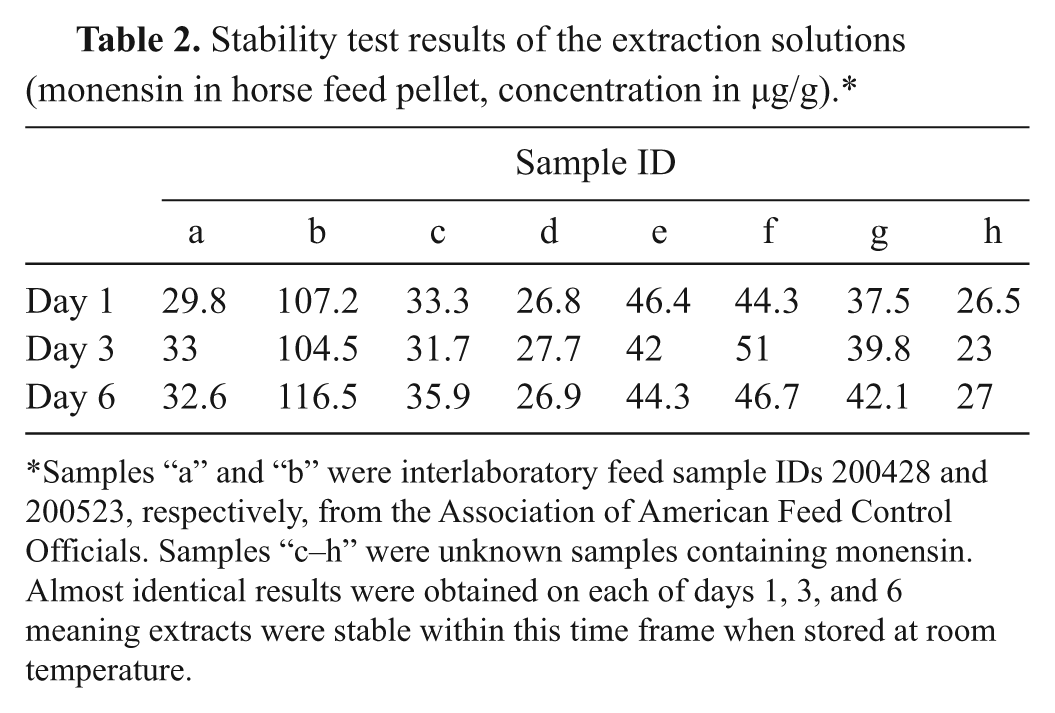
Samples “a” and “b” were interlaboratory feed sample IDs 200428 and 200523, respectively, from the Association of American Feed Control Officials. Samples “c–h” were unknown samples containing monensin. Almost identical results were obtained on each of days 1, 3, and 6 meaning extracts were stable within this time frame when stored at room temperature.
For the recovery study, a mixed standard solution of the 4 ionophore compounds was used for spiking blank horse feed. Samples were fortified with the ionophores at different concentrations, and the recovery rate was calculated. All 4 analytes were measured simultaneously. The spike levels used were 0.2, 0.5, 1, 5, 10, 50, 100, and 200 µg/g. The results are summarized in Table 3. All of the ionophore compounds can be quantified at 0.2 µg/g, which is sensitive enough for quantification of unknown feed samples. The recovery rates ranged from 69% to 122%, which was excellent.
Spike recovery (%) for different ionophore compounds in horse feed fortified at different concentrations (5 replicates for 0.2 µg/g spikes and 6 replicates for the others).*
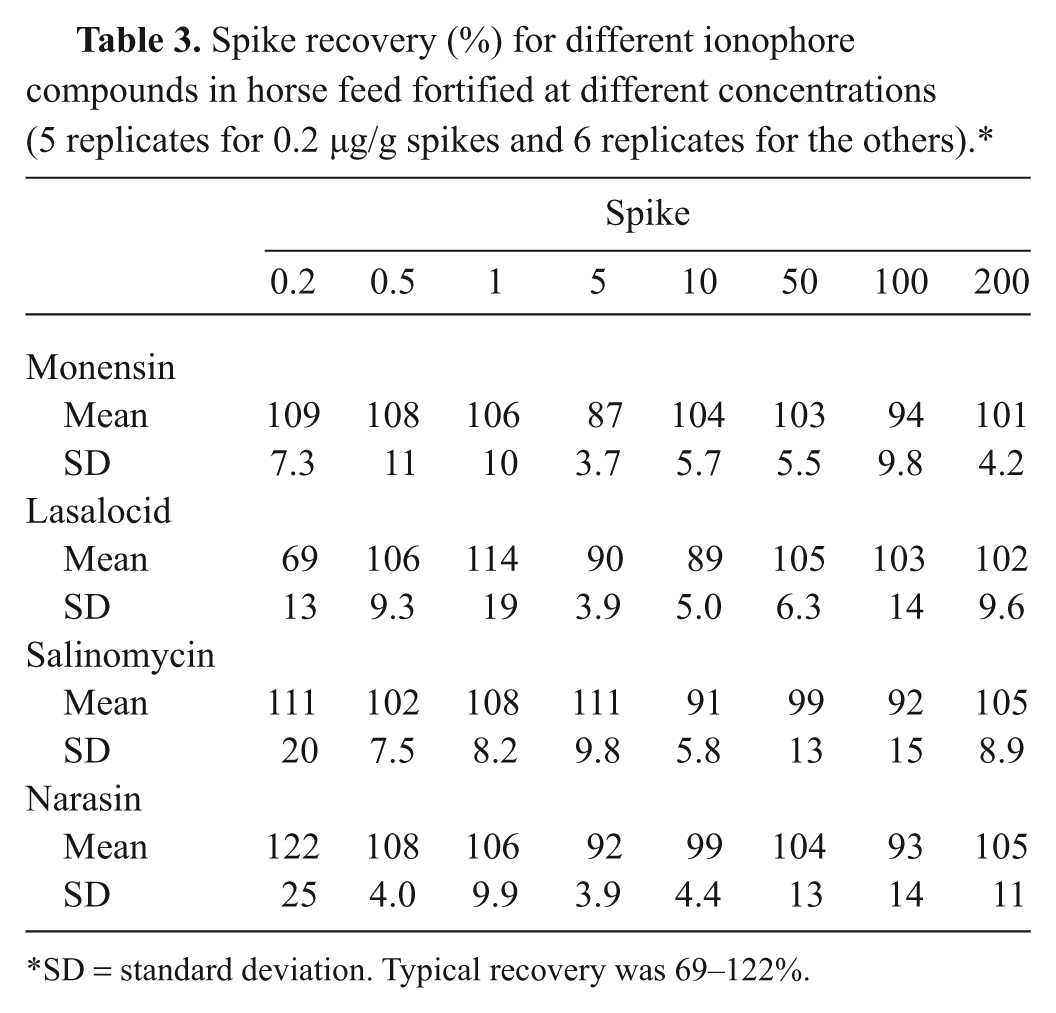
SD = standard deviation. Typical recovery was 69–122%.
Further validation of the assay was achieved by analysis of samples previously used for interlaboratory proficiency testing. The proficiency samples were part of old stock from previous participation in the American Association of Food Control Officials (AAFCO) proficiency testing by the authors’ laboratory. Samples from the Canadian Food Inspection Agency (CFIA) were generously provided by Dr. Harold Campbell. The samples were analyzed for the 4 ionophore compounds, and results were compared with the expected values provided by AAFCO or Dr. Campbell. The proficiency feed samples included broiler starter and cattle feed of different formulations (i.e., powder and pellet). A total of 12 samples was analyzed in 6 replications. A summary of the results is shown in Table 4. Results of both AAFCO samples fell within expected ranges. Note that for CFIA results, only the expected mean was provided. Seven out of the 10 CFIA samples passed. Results of 3 of the samples were marginally higher than the mean provided by CFIA. Note however, that the results of the analysis of 6 replicates were very tight. Overall, results obtained with the simple one-step extraction procedure were within expected concentrations similar to those provided by AAFCO and the CFIA. The rich diversity in sample matrices was very useful for the method validation and demonstrated the application of this method to different kinds of feed formulations.
Results of interlaboratory proficiency feed sample analysis by liquid chromatography–tandem mass spectrometry (µg/g).*
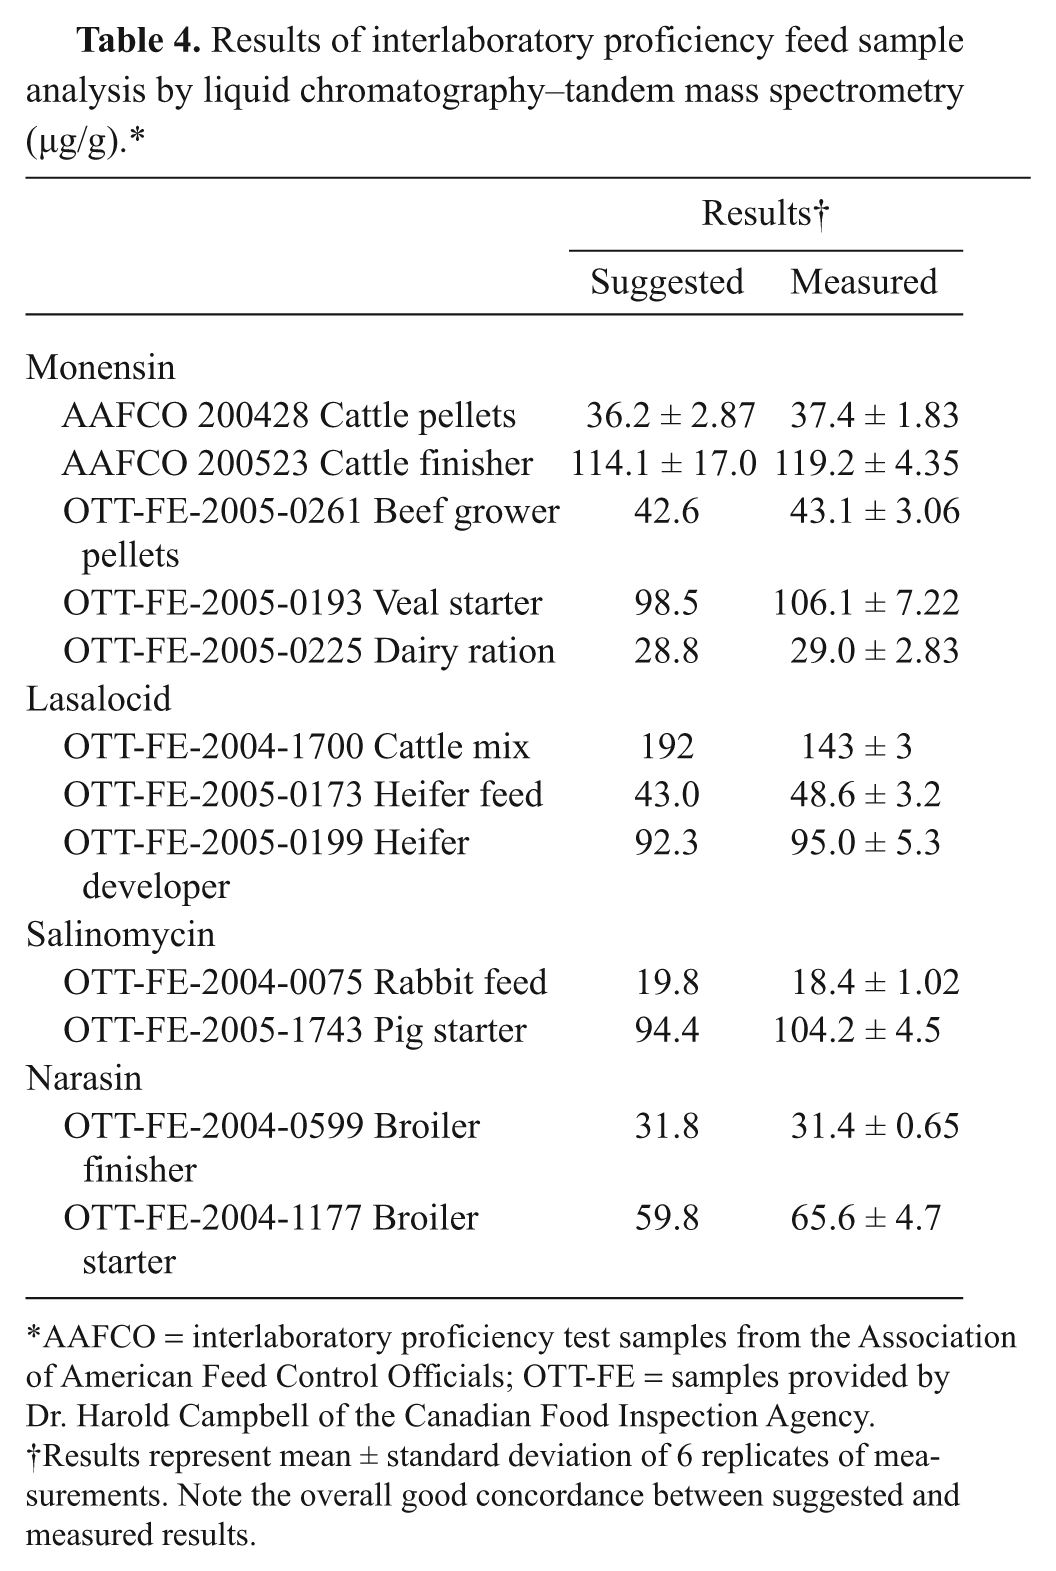
AAFCO = interlaboratory proficiency test samples from the Association of American Feed Control Officials; OTT-FE = samples provided by Dr. Harold Campbell of the Canadian Food Inspection Agency.
Results represent mean ± standard deviation of 6 replicates of measurements. Note the overall good concordance between suggested and measured results.
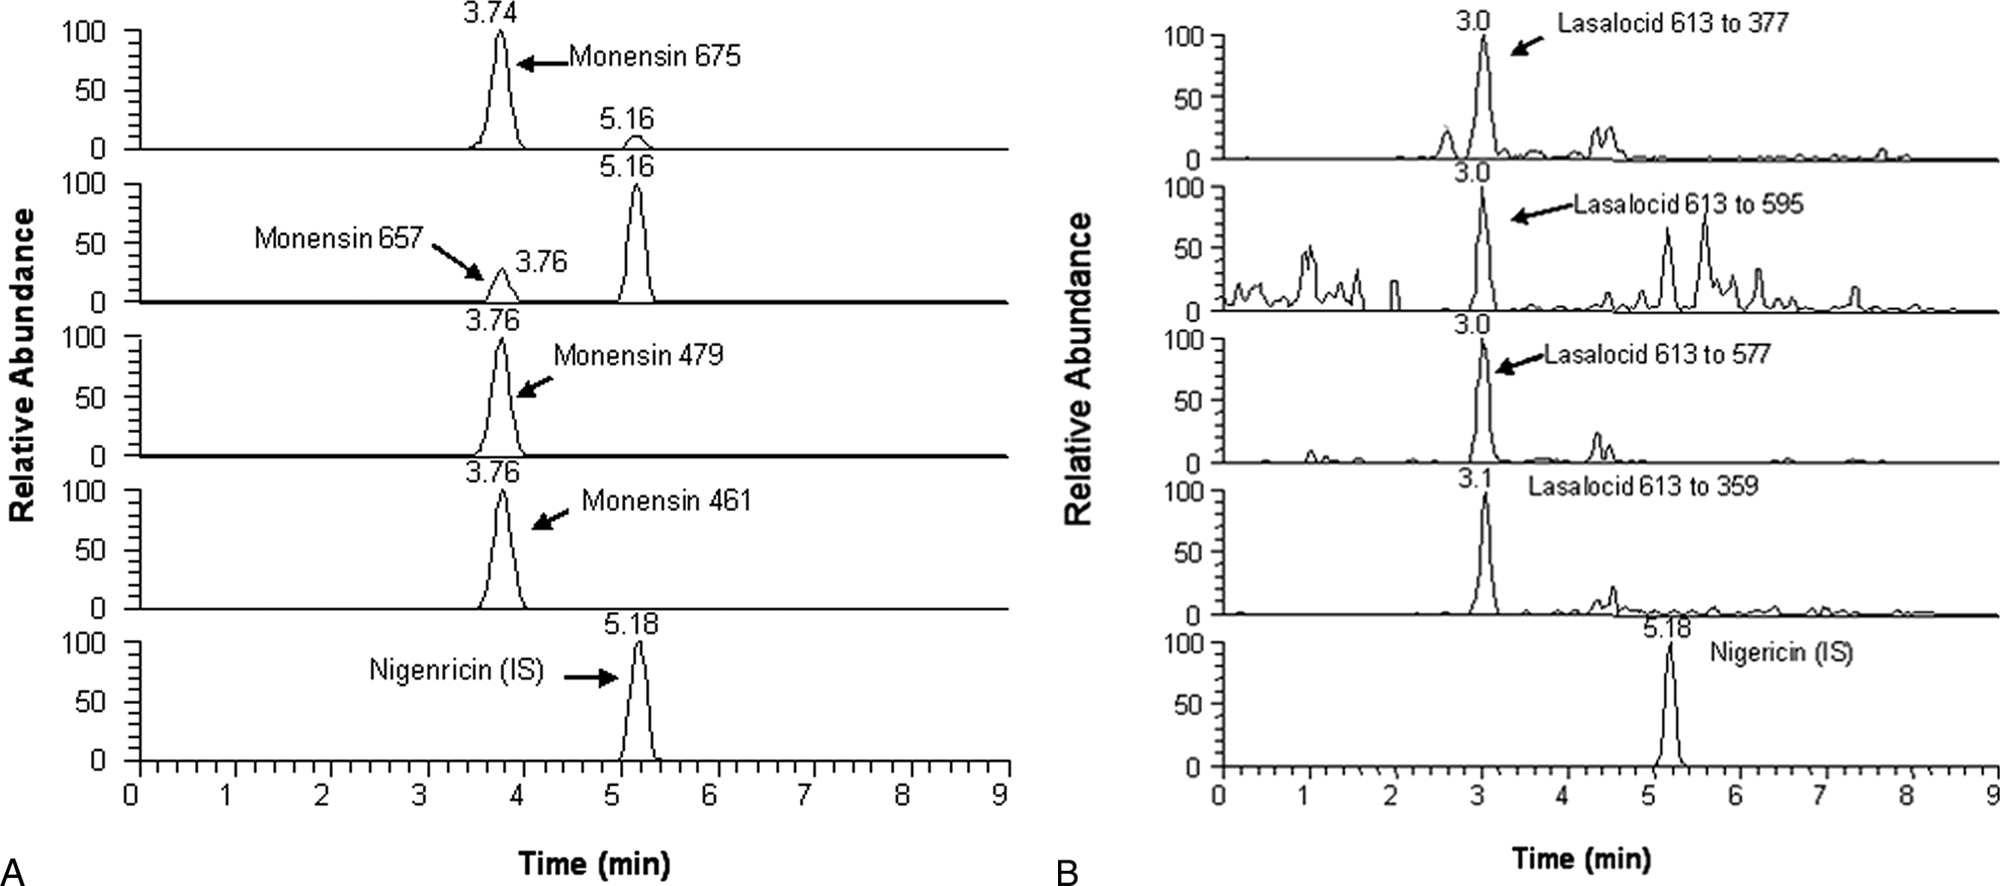
A good quantitative method should be selective. Selectivity was evaluated by extracting blank horse feeds and comparing the responses at the retention times of the ionophore compounds to those of horse feed spiked with ionophores at a concentration of 0.2 µg/g. Next, whether the method is sensitive enough for identifying ionophores at 0.2 µg/g in feeds was investigated. Horse feed was spiked with the 4 ionophores at this level. Detection limits were determined by extracting samples spiked with the 4 ionophore compounds at 0.2 µg/g and measuring the samples 10 times. Results were used for calculating detection limits for each of the 4 compounds.
A summary of the selectivity experiment is shown in Figure 3. The LC-MS/MS spectrum of the blank feed is shown in Figure 3A. Ionophore compounds showed their peaks clearly at the right retention times (i.e., 3.1, 3.8, 3.7, and 4.4 min) for lasalocid, monensin, salinomycin, and narasin, respectively (Fig. 3B). Although there was a background at retention time of 2.6 min for lasalocid, the background was completely separated from the peak of lasalocid and did not interfere with lasalocid quantification. For all of the analytes, the background observed in the control blanks was 20 times lower than those of the samples spiked with 0.2 µg/g. Therefore, there was no interference in quantifying these ionophores.
Liquid chromatography–tandem mass spectrometry spectra for the ionophores.
Results of the sensitivity experiment are summarized in Figure 4. In Figure 4A, a monensin spike at 0.2 µg/g was successfully identified. The peaks at retention time of 5.2 min were caused by the internal standard, nigericin. Salinomycin and narasin were as sensitive as monensin (data not shown). Spiking lasalocid, which has relatively low sensitivity, also gave a good spectrum for quantification at the 0.2 µg/g level (Fig. 4B). By extracting a sample spiked at 0.2 µg/g and measuring it 10 times, the detection limits for the ionophores in solution were calculated as 0.51, 1.4, 0.45, and 0.60 ng/ml for monensin, lasalocid, salinomycin, and narasin, respectively. By calculation, the detection limits for the ionophores in feed were 0.021, 0.056, 0.018, and 0.024 µg/g, respectively. Three times the signal-to-noise ratio was used to calculate the limit of detection. To obtain the limit of quantitation, the signal-to-noise ratio was multiplied 10 times. The results indicate that this analytical procedure is very sensitive and can simultaneously measure all 4 ionophore compounds at 0.2 µg/g of feed. This is high enough to measure ionophore compounds in medicated animal feeds whose concentration is usually in the range of 10–100 µg/g. In practice, it is unlikely that clients will be interested in ionophore concentrations lower than 1 µg/g in feed. In horses, the most sensitive species toxicosis is associated with monensin feed concentrations in excess of 8 µg/g. 4
Spectra of multiple monitoring reactions of the 4 product ions.
In conclusion, a very simple sample preparation procedure was developed for simultaneous rapid and accurate measurement of monensin, lasalocid, salinomycin, and narasin in feeds by LC-MS/MS. The ionophores were extracted by methanol:water (90:10), and the extract analyzed without further purification. Validation of the analytical procedures involved analysis of horse feed samples fortified with the ionophores at different concentrations and an additional analysis of interlaboratory proficiency test samples. Results of the interlaboratory proficiency test samples were largely within expected ranges. The method described herein is accurate and sensitive. The detection limit was found to be between 0.018 µg/g and 0.056 µg/g for the different ionophore compounds. However, measurement of ionophores at 0.2 µg/g of feed was demonstrated, which is far below the level of concern for ionophores in feeds (usually >8 µg/g). The LC-MS/MS described in the current study is a quantitative analysis that can be completed within 6 hr. This rapid, accurate, and sensitive method has potential in various veterinary diagnostic applications.
Footnotes
Acknowledgements
The authors would like to thank Dr. Wenlu Song, Susan M. Stahl, Kevin J. Pustulka, and Michelle Bennett for their help in the experiment. Also, the authors are grateful to Harold Campbell of the Canadian Food Inspection Agency and Charles L. Focht of The Department of Agriculture, State of Nebraska for providing interlaboratory proficiency test samples for this study.
a.
Alpharma LLC, Bristol, TN.
b.
Sigma-Aldrich, St. Louis, MO.
c.
Burdick & Jackson, Morristown, NJ.
d.
GS-6 centrifuge, Beckman, Brea, CA.
e.
Cyclone Sample Mill, UDY Corp., Fort Collins, CO.
f.
Model 75, Burrell Corp., Pittsburg, PA.
g.
VWR Scientific Products, Batavia, IL.
h.
Thermo TSQ-Quantum Discovery Max LC-MS/MS, Hypersil Gold column, Thermo Fisher Scientific, Waltham, MA.
i.
NM 30 LA, PEAK Scientific, Billerica, MA.
The authors declared that they had no conflicts of interests in their authorship and publication of this contribution.
The authors received no financial support for the research, authorship, and/or publication of this article.