
Abstract
In veterinary medicine, measurement of canine C-reactive protein (cCRP) is used widely to detect inflammatory diseases. We evaluated the precision of Randox and Fuji assays for cCRP, as well as accuracy, correlation, and agreement compared to a reference ELISA. Blood samples from 71 client-owned dogs (20 healthy, 51 diseased) were analyzed with the 3 assays. Inter-assay CVs were ~3.5% with both the Randox and Fuji assays. The mean biases were −1.90% for the Randox and −5.93% for the Fuji test; the targeted biases were ~8.5% for both assays. The CV, bias, and observed total error were acceptable for the 2 assays compared to ASVCP recommendations based on biological variation studies. The Spearman correlation coefficient for cCRP concentration compared with the reference ELISA was 0.83 for the Randox test and 0.92 for the Fuji test. Both assays measured cCRP precisely at intermediate and increased concentrations. Correlation with the reference ELISA was good, and both assays could be used to evaluate cCRP concentrations in veterinary practice. However, the assays did not reach analytical agreement; hence the results obtained by these assays are not interchangeable, and serial monitoring of cCRP requires the use of the same assay.
C-reactive protein (CRP) is a major acute-phase protein that is used widely as a nonspecific marker of inflammation in dogs.5,15 Given that CRP synthesis is rapidly up-regulated in hepatocytes after the onset of infection, inflammation, or tissue damage, an increased blood CRP concentration can usually be detected within 6 h, reaching a peak in 24–48 h. Elevated serum concentrations of canine CRP (cCRP) have been reported in various pathologic conditions, such as infectious diseases, neoplasia, immune-mediated disorders, trauma, surgery, and various inflammatory conditions.3–5,8,9,15,17,19 Under conditions such as infection, trauma, or cancer, concentrations can reach several hundred-fold above normal levels.3,5,12,17 The cCRP measurement can be used in the diagnosis and monitoring of various conditions, such as surgical trauma, inflammatory bowel disease, acute pancreatitis, pyometra, and bacterial enteritis.3,5
Several methods exist for measuring CRP. 12 A validated ELISA for cCRP in dogs has been reported for clinical laboratory use.11,14 However, the quantitative cCRP ELISA is time-consuming, laborious, and expensive. Therefore, several assays are widely used in veterinary medicine as an alternative to ELISA.9,18 In human medicine, point-of-care tests, which can overcome the shortcomings of ELISA, have been used widely for automated turbidimetric immunoassays. Some human CRP-specific antibodies that have cross-reactivity with cCRP have been used in animals. However, their use has been limited because of serious problems, such as the reduced reliability of the test as a result of the use of human calibrators in the measurement of canine samples.10,12,13
Canine-specific automated turbidimetric immunoassays are available, and various assays have been developed and used in animal hospitals.8,18 Several CRP assays have been validated for use in dogs. Assays have been compared, including the Gentian CRP immunoassay and Life Assays CRP (Olympus AU400 analyzer) 17 ; the Randox CRP assay and Biotecnica CRP assay 1 ; the Randox cCRP assay and Gentian cCRP immunoassay (ABX Pentra 400 analyzer) 7 ; and the Olympus CRP, Avacta cCRP bioanalyser assay, Gentian cCRP immunoassay (Olympus AU600 analyzer), and the Fujifilm Dri-Chem Slide vcCRP (Fuji Dri-Chem NX500 analyzer). 16
We evaluated 2 turbidimetric immunoassays used in veterinary hospitals for measuring cCRP, namely the Randox cCRP assay (BS-300 chemistry analyzer; Mindray Bio-Medical) and the Fuji Dri-Chem vcCRP-P (Dri-Chem 7000i; Fujifilm), and then compared their results to a reference ELISA (cCRP ELISA kit; BD Biosciences). These assays will be referred to hereafter as Randox, Fuji, and ELISA, respectively. The samples were excess to blood examination of client-owned dogs that had been presented for either health screening or diagnostic purposes to the Veterinary Medical Teaching Hospital of Chungnam National University (Daejeon, Republic of Korea) between December 2015 and September 2016. Institutional approval for this study was not required, given that the owners permitted the use of excess serum samples. We included 71 dogs of 23 breeds, including 5 mixed-breed dogs. There were 36 males (21 castrated), and 35 females (17 spayed). Twenty dogs were healthy, and 51 dogs had been diagnosed with various diseases, such as neoplasia, chronic kidney disease, and pancreatitis (Table 1). Only dogs undergoing a physical examination plus CBC, serum chemistry, and cCRP testing to determine health status were included. Absence of physical abnormalities and normal CBC, serum chemistry, and cCRP results were used to define dogs as healthy. Dogs that had any abnormalities on physical examination or on any of the 3 tests were classified as unhealthy.
Underlying health conditions of 71 canine patients used to evaluate canine C-reactive protein concentration with the Randox and Fuji assays.
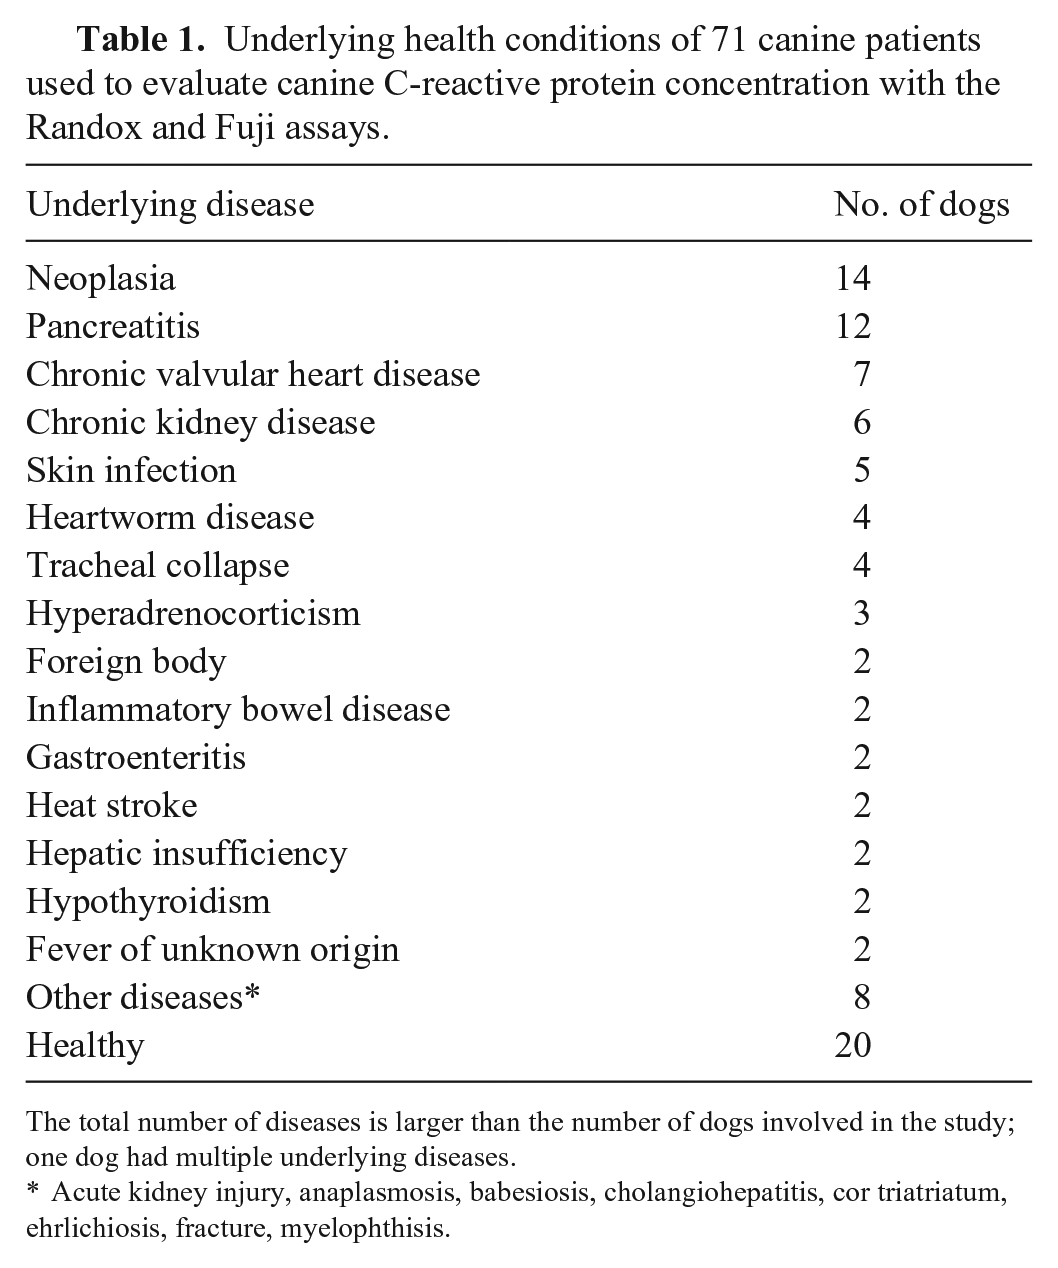
The total number of diseases is larger than the number of dogs involved in the study; one dog had multiple underlying diseases.
Acute kidney injury, anaplasmosis, babesiosis, cholangiohepatitis, cor triatriatum, ehrlichiosis, fracture, myelophthisis.
Blood samples were collected by jugular venipuncture into an EDTA tube for CBC tests (FL Medical) and 2 tubes with clot activator (Becton Dickinson) for collecting serum. All dogs underwent a routine physical examination, CBC (Advia 2120; Siemens), and biochemistry profiling (alanine aminotransferase, aspartate aminotransferase, alkaline phosphatase, glucose, total protein, albumin, globulin, urea, creatinine, sodium, potassium, chloride; BS-300; Mindray Bio-Medical).
Ten minutes after blood collection, tubes containing blood with clot activator were centrifuged at 1,500×g at room temperature for 10 min to obtain serum. Serum was separated and stored at room temperature; cCRP was measured using the 2 assays within 2 h of blood collection. Serum was also aliquoted and stored at −80°C for analysis using the reference ELISA. For inter-assay imprecision determination with the Randox and Fuji assays, similar samples frozen at −80°C were thawed daily for 5 consecutive days.
We measured the cCRP concentrations in sera from 71 dogs by the 2 tested assays (Randox, Fuji) and the reference ELISA, and then compared the results of the 2 tested assays to results of the ELISA. All measurements were performed by a veterinarian trained in performing both the Randox and Fuji assays, following the manufacturers’ instructions, and calibrated with test-specific calibration materials. For the ELISA, aliquoted sera were thawed, thoroughly mixed, and then the ELISA was performed manually according to the manufacturer’s instructions; absorbance was read at 450 nm (Biotek Epoch 2 microplate spectrophotometer; Agilent).
Intra-assay imprecision was determined using 10 measurements of patient serum samples with 3 cCRP concentrations [low: mean 7.72 (Randox), 5.7 (Fuji) mg/L; medium: mean 94.4 (Randox), 52.7 (Fuji) mg/L; high: mean 153 (Randox), 191 (Fuji) mg/L] on the same day. We assessed the inter-assay imprecision by measuring cCRP with both tested assays once a day for 5 consecutive days in 6 different frozen and aliquoted specimens, consisting of 2 specimens (1 specimen for the Randox and 1 specimen for the Fuji) in each cCRP concentration slot (low: <20 mg/L; medium: 50–100 mg/L; high: >130 mg/L). The calculated CV quantified the inter-assay variability. The CV was determined in each concentration range (low, moderate, high). Because the interpretation threshold of cCRP is likely to be in our medium range (50–100 mg/L), we elected to use the CV of this range to compute the observed total error (TEobs%). However, the interpretation thresholds of cCRP are documented in the literature from ~20 mg/L (to identify mild inflammation) to ~100 mg/L (to identify marked inflammation). Thus, depending on the goal when using our assays to measure cCRP, the CV may be significantly higher than reported here if using interpretation thresholds between 20 and 50 mg/L. We could not report CVs in this latter range because it does not overlap with any of our 3 concentration levels.
The observed bias was calculated as the relative difference between the reference ELISA and the 2 assays:
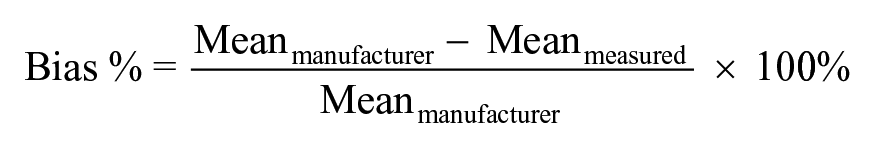
TEobs% was calculated from bias (%) and CV, according to the following formula:

We compared the CV, bias, and TEobs obtained in our study to their respective allowed limits recommended by the ASVCP based on biological variation studies.
Our comparison study included assessment of correlation and agreement. The distribution of the data for comparison of cCRP among assays was analyzed by the Shapiro–Wilk test: the variables did not follow a normal distribution; hence, the Spearman rank test was used to determine correlation coefficients among the data. Correlations were ranked as very high (0.9 < r ≤ 1.0), high (0.7 < r ≤ 0.9), moderate (0.5 < r ≤ 0.7), low (0.3 < r ≤ 0.5), or negligible (r = 0–0.3). 13 Then, we assessed agreement of both assays with the ELISA, using the Deming regression and the Bland–Altman method. To determine the normal distribution of the differences between methods, Kolmogorov–Smirnov and Shapiro–Wilk tests were used. None of the variables was normally distributed (p < 0.0001).
Statistical analyses were performed using the statistical software XLSTAT 2017 (v.19.02; Addinsoft), MedCalc software (v.15.8), and IBM SPSS (v.18). The 2 assays had different detection limits, as published by their manufacturers; the stated lower detection limit was >0.27 mg/L for the Randox method and 3 mg/L for the Fuji method; the upper limit of the reportable range was 200 mg/L for Randox and 210 mg/L for Fuji. For statistical analysis, ELISA results were adjusted to individual analyzer thresholds. Fuji values <3 mg/L were adjusted to 2.99 mg/L. ELISA values >210 mg/L were recorded as 211 mg/L.
The precision study revealed good intra-assay CVs of 0.9–2.0% for the Randox test and 2–4.6% for the Fuji test, with high and medium CRP concentrations, respectively. At low CRP concentration, the intra-assay CV increased significantly, 7.12% for the Randox test and 29.9% for the Fuji test (Table 2). The inter-assay CVs were 6.7 and 7.0% for the Randox test and 1.7 and 4.0% for the Fuji test, with high and medium CRP concentrations, respectively. At low CRP concentration, the inter-assay CV increased significantly; 14.3% for the Randox test, and 8.9% for the Fuji test (Table 3). Overall, the inter-assay imprecision of the Randox test was higher than that of the Fuji test at all 3 concentrations. When we observed inter-assay CV < intra-assay CV, this might be the result of the higher n in the intra-assay precision study (n = 10) versus the inter-assay precision study (n = 5); thus, we cannot rule out underestimated inter-assay imprecision of the 2 assays.
Intra-assay precision of 2 assays determined by 10 same-day repeated measurements of canine C-reactive protein (cCRP) in serum samples with 3 different CRP concentrations.
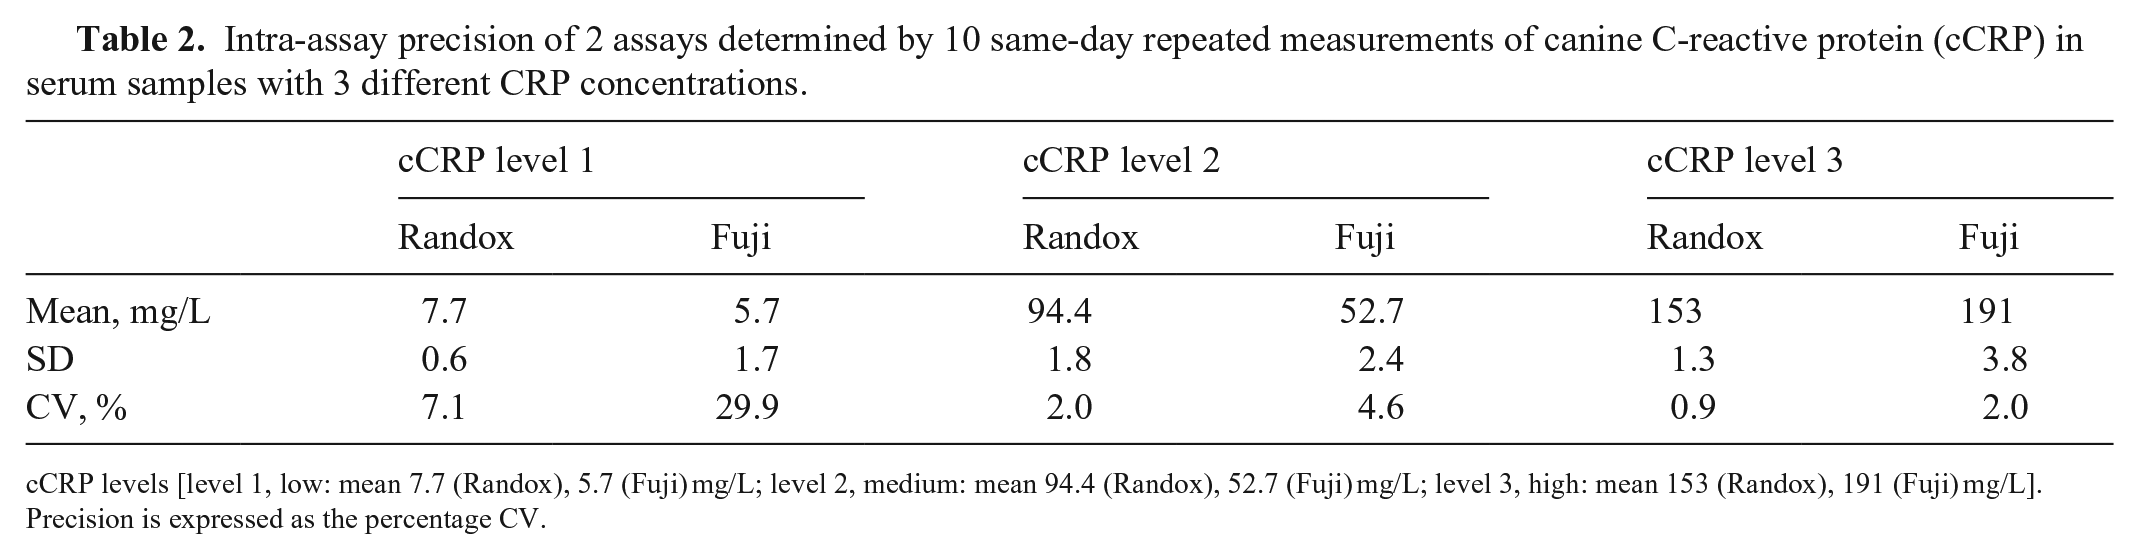
cCRP levels [level 1, low: mean 7.7 (Randox), 5.7 (Fuji) mg/L; level 2, medium: mean 94.4 (Randox), 52.7 (Fuji) mg/L; level 3, high: mean 153 (Randox), 191 (Fuji) mg/L]. Precision is expressed as the percentage CV.
Inter-assay imprecision of 2 assays for canine C-reactive protein concentrations (cCRP) using 6 canine serum samples (1 serum sample per concentration level for each assay) with 3 cCRP concentrations (low: <20 mg/L; medium: 50–100 mg/L; high: >130 mg/L) divided into aliquots and measured on 5 consecutive days.
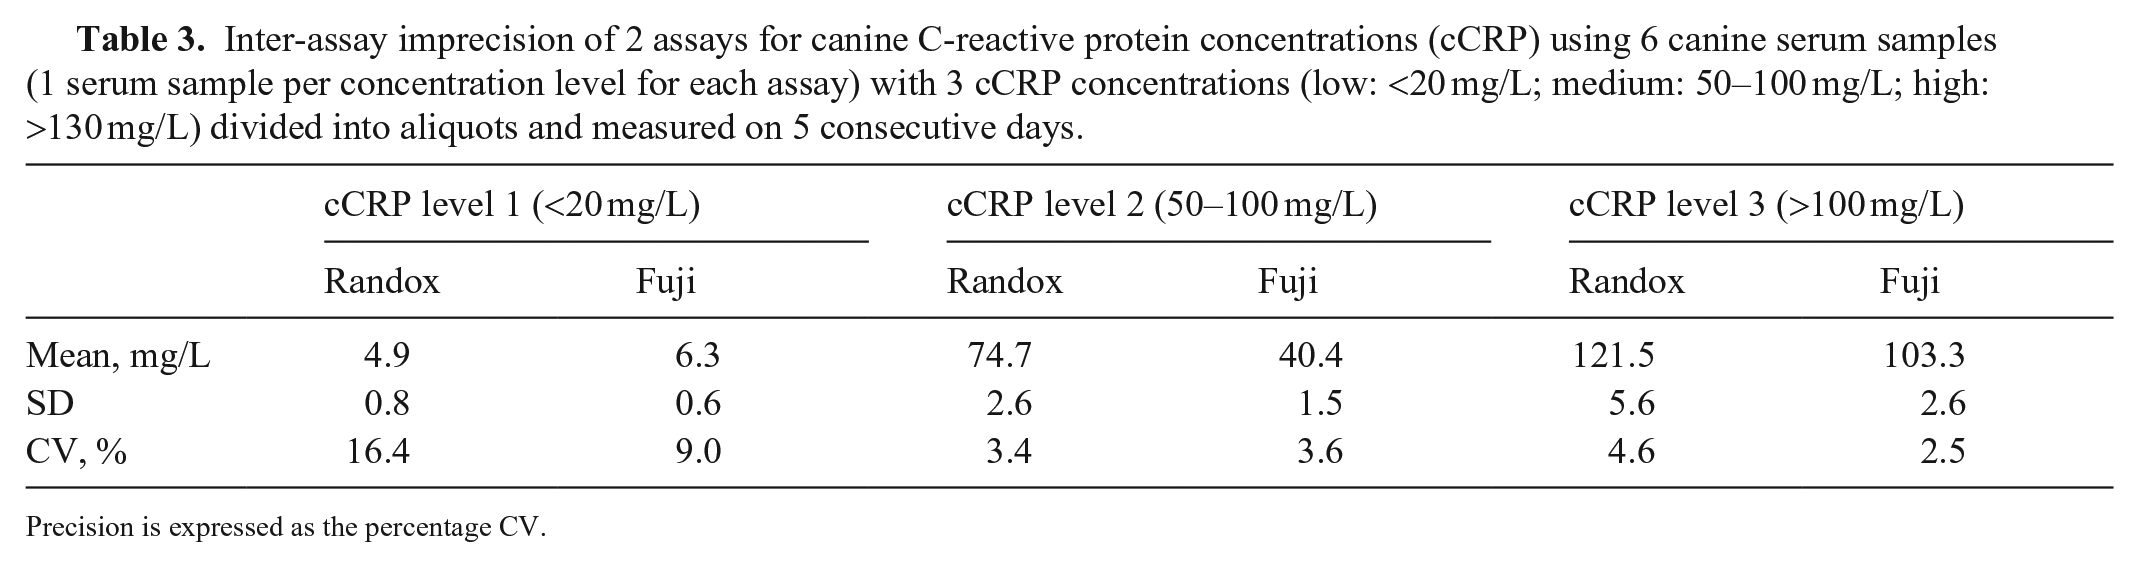
Precision is expressed as the percentage CV.
For the correlation study, according to the predefined scale for the Spearman correlation coefficient rs, the correlation of the Randox assay with the reference ELISA was high (rs = 0.83), and the correlation of the Fuji assay was very high (rs = 0.92). The calculated correlation was significant with both assays (p < 0.01).
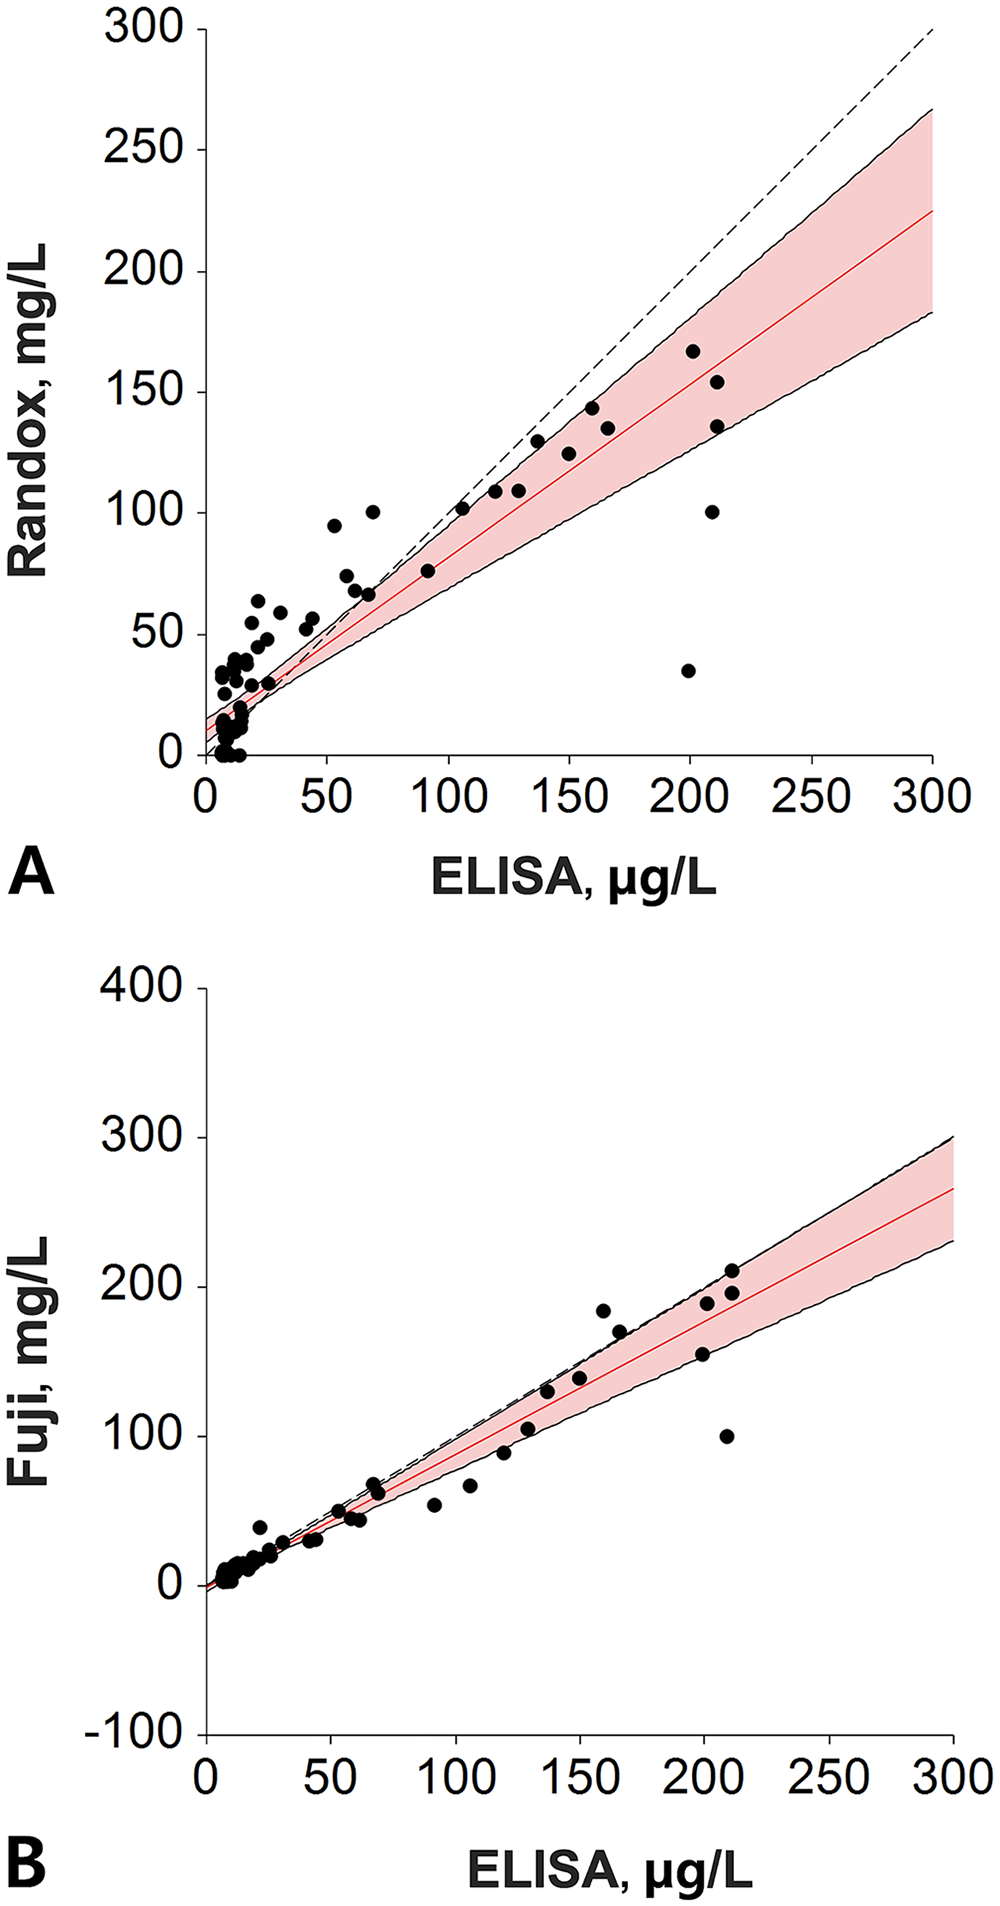
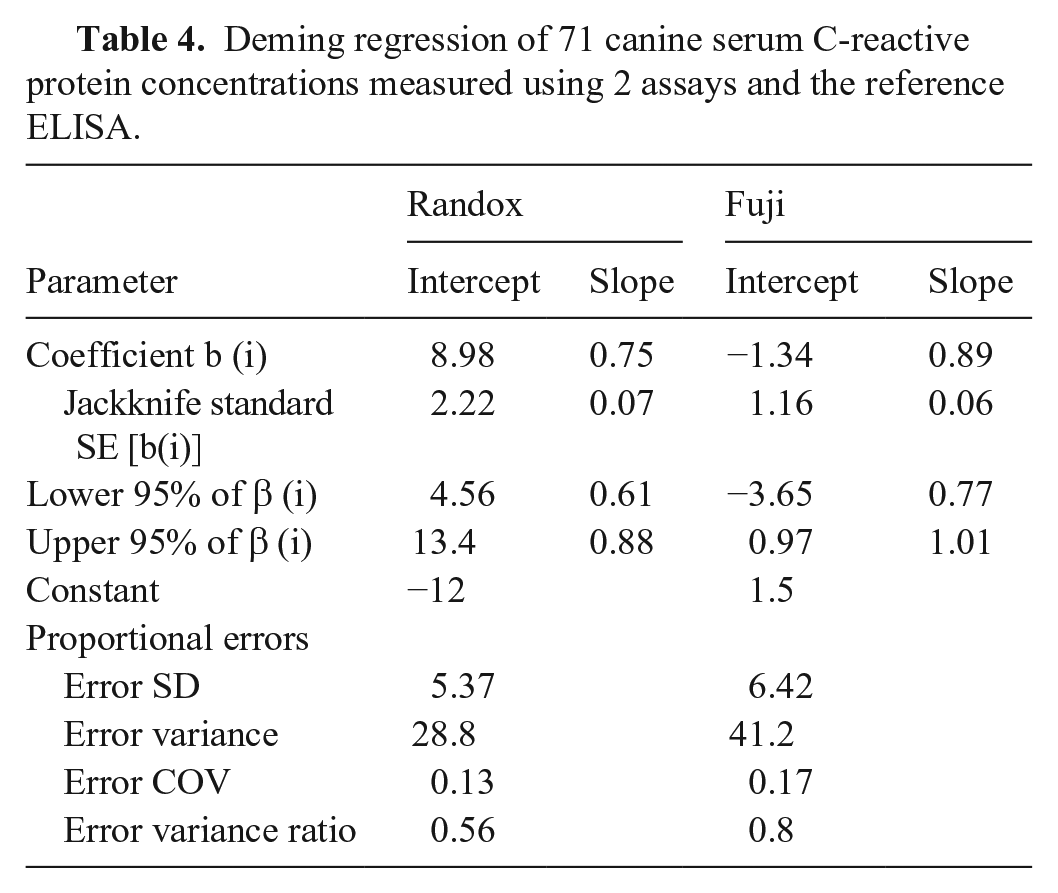
Plotting results of each tested assay and the reference ELISA, the linear coefficient of correlation, or coefficient of linearity (abbreviated “r”), was determined for the Randox assay (r = 0.7463) and the Fuji assay (r = 0.9215; Fig. 1). Given that the r was <0.975 (linear regression cannot be used) and there was a proportional bias between methods (paired t-test cannot be used), we used a Deming regression for comparison purposes (Fig. 2). Equations for the Deming regressions were y = 0.71x + 10.3 for the Randox assay (Fig. 2A) and y = 0.89x + 1.19 for the Fuji assay (Fig. 2B). The calculated intercept CIs included the value 0 for the Fuji assay (−3.57 to 1.19), but not for the Randox assay (5.6–15.01). The calculated slope CIs included the value 1.0 for the Fuji assay (0.77–1.01) but not for the Randox assay (0.57–0.86; Table 4).
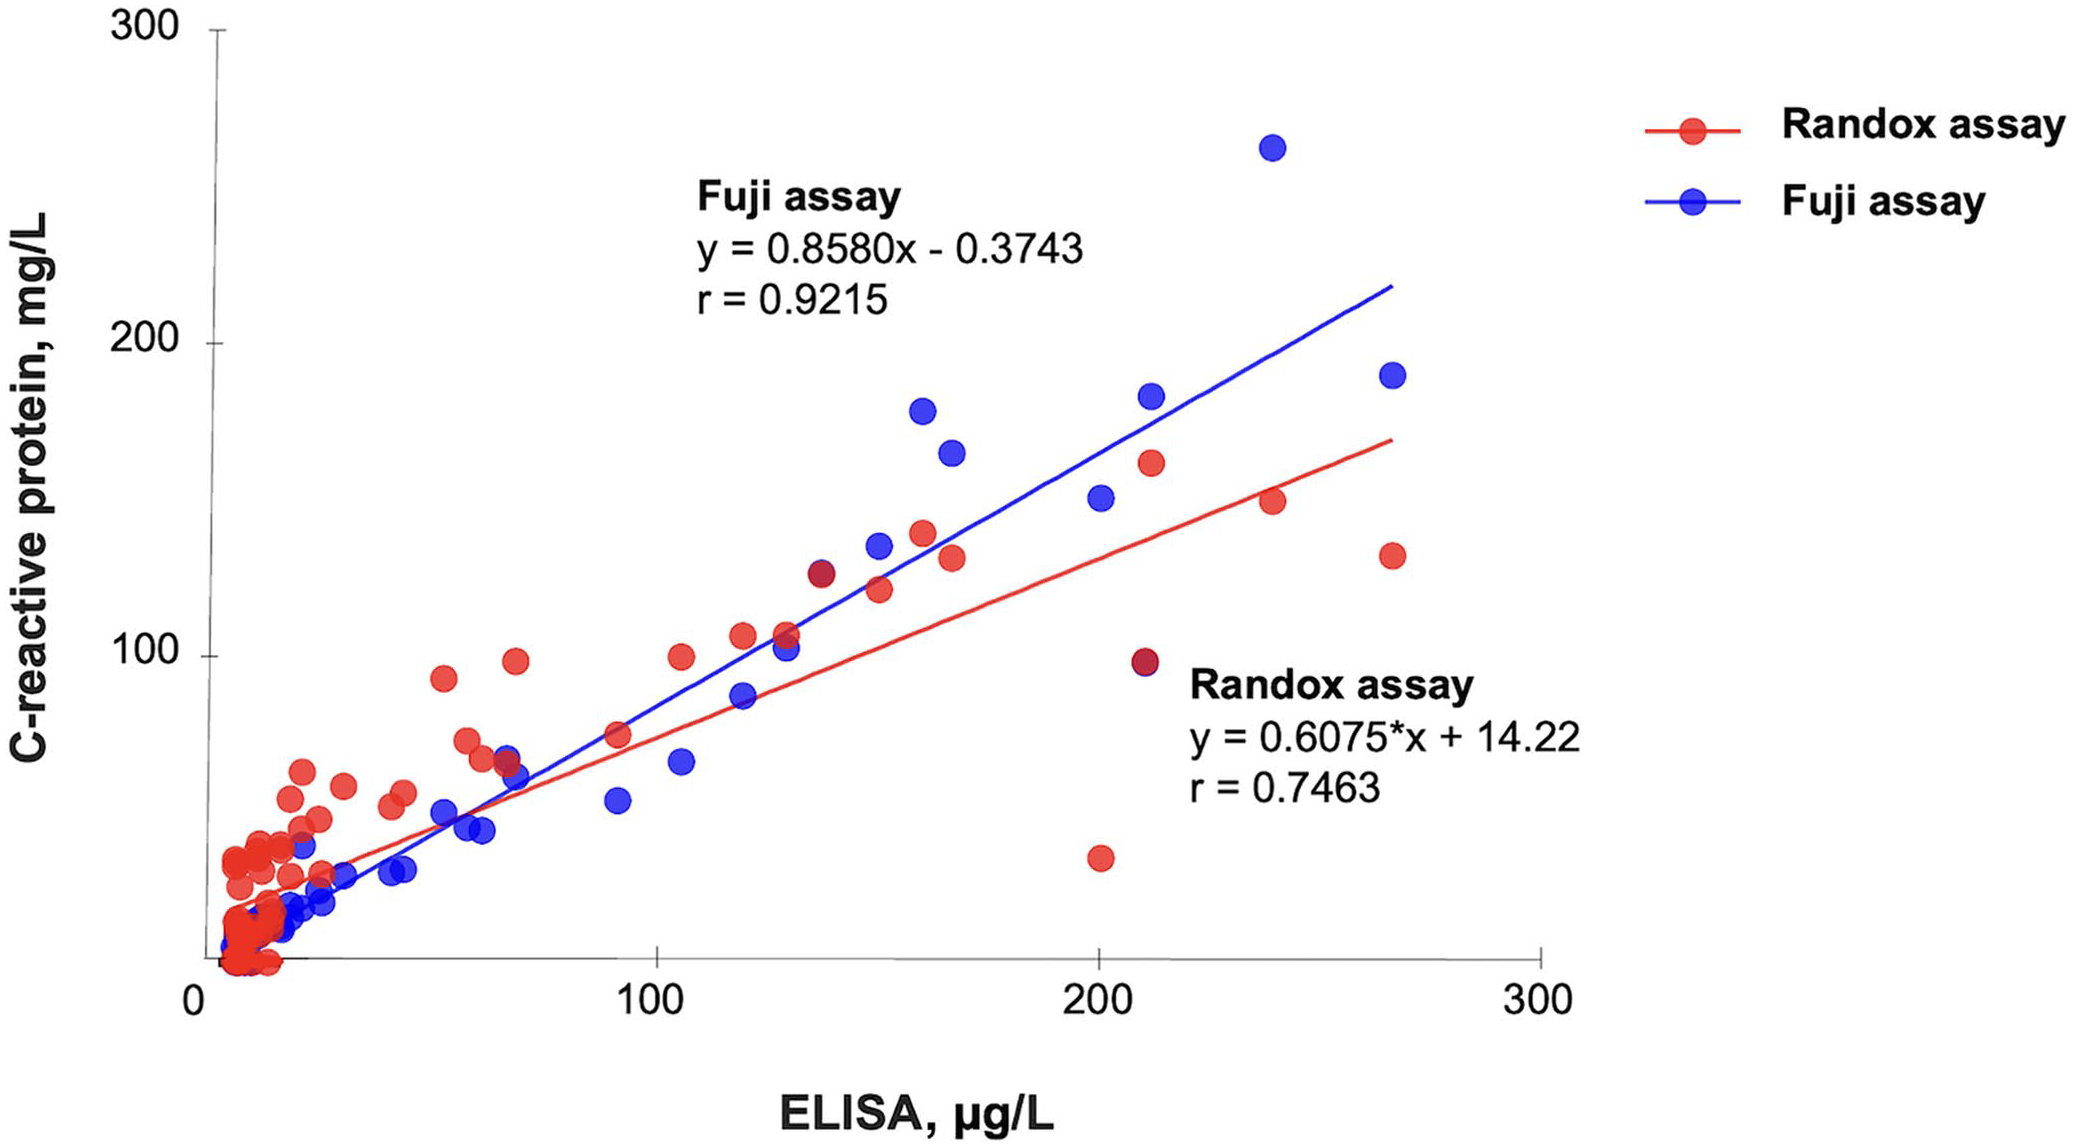
Linear regression of the Randox and Fuji assays for canine C-reactive protein and the reference ELISA in 71 canine serum samples.
Correlation between the
Deming regression of 71 canine serum C-reactive protein concentrations measured using 2 assays and the reference ELISA.
In the Bland–Altman difference plot, the mean bias for the Randox assay was −1.90% (95% CI: −9.185 to 5.388) and for the Fuji assay the bias was −5.93% (95% CI: −9.778 to −2.087; Fig. 3; Table 5). Constant and/or proportional biases were also detected using Bland–Altman analysis. 2 Compared to the ELISA results, the Randox assay results had a mean proportional bias (−1.9%); the Fuji assay results had a significant proportional bias (−5.93%). However, the mean bias, as its name indicates, averages the bias between methods across the entire reportable concentration range, minimizing the reported bias. When an analyte is specifically interpreted at increased concentration, such as for instance cCRP, it is more relevant to consider the bias existing within a narrower concentration range around its interpretation threshold. As mentioned earlier, cCRP interpretation thresholds may be elected between ~20 and 100 mg/L depending on the goal. If we consider an arbitrary interpretation threshold of 20 mg/L for the reference ELISA, the Deming regressions provide a concentration of 24.5 mg/L for the Randox assay and a concentration of 19 mg/L for the Fuji assay, meaning a bias +22.5% and a bias of +5%, respectively, compared to the reference ELISA. If we elect an interpretation threshold of 50 mg/L, biases become −8.4% for the Randox assay and −8.6% for the Fuji assay. If we elect an interpretation threshold of 100 mg/L, biases become −18.7% for the Randox assay and −9.81% for the Fuji assay. This illustrates the dependance of the bias on the concentration and allows understanding of why a mean bias may appear artificially low. Thus, the concentration-relevant biases are more relevant than the mean biases when computing TEobs%, given that TEobs% is computed for interpretation purposes, and interpretation is performed for cCRP at the concentration range of the interpretation threshold.
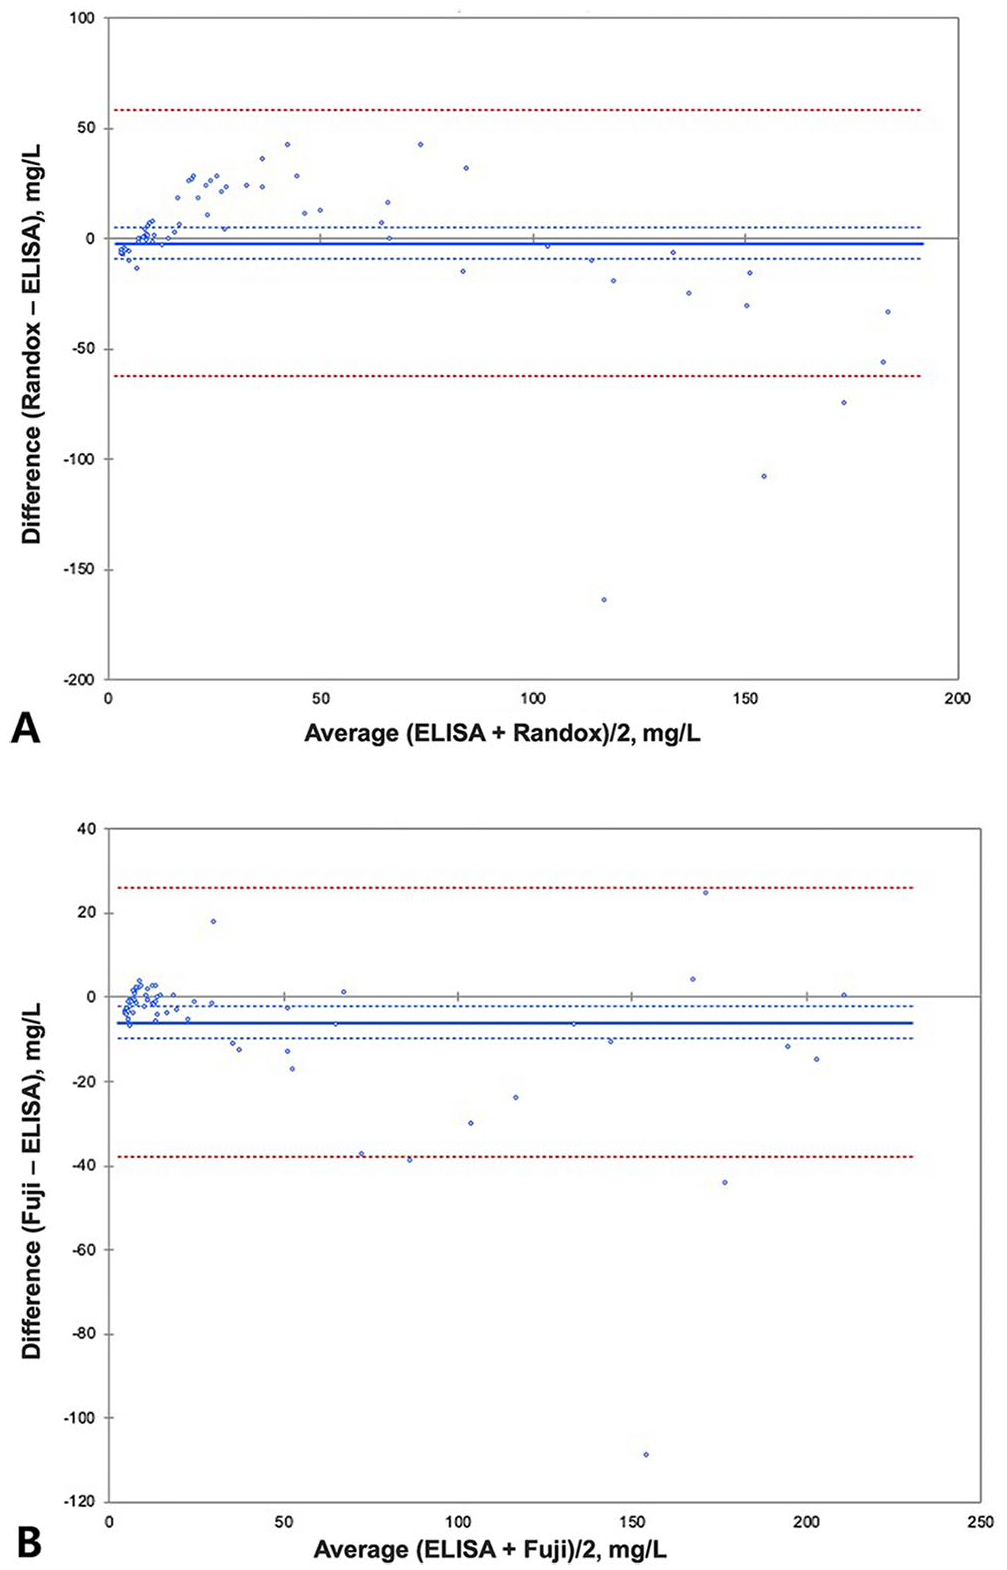
Bland–Altman plots comparing 71 canine serum C-reactive protein (cCRP) results for the
Comparison of the observed inter-assay CV of medium canine C-reactive protein (cCRP) level, bias, and observed total error (TEobs) for CRP in 2 assays of cCRP in canine serum samples compared to ASVCP guidelines 6 for method comparison.
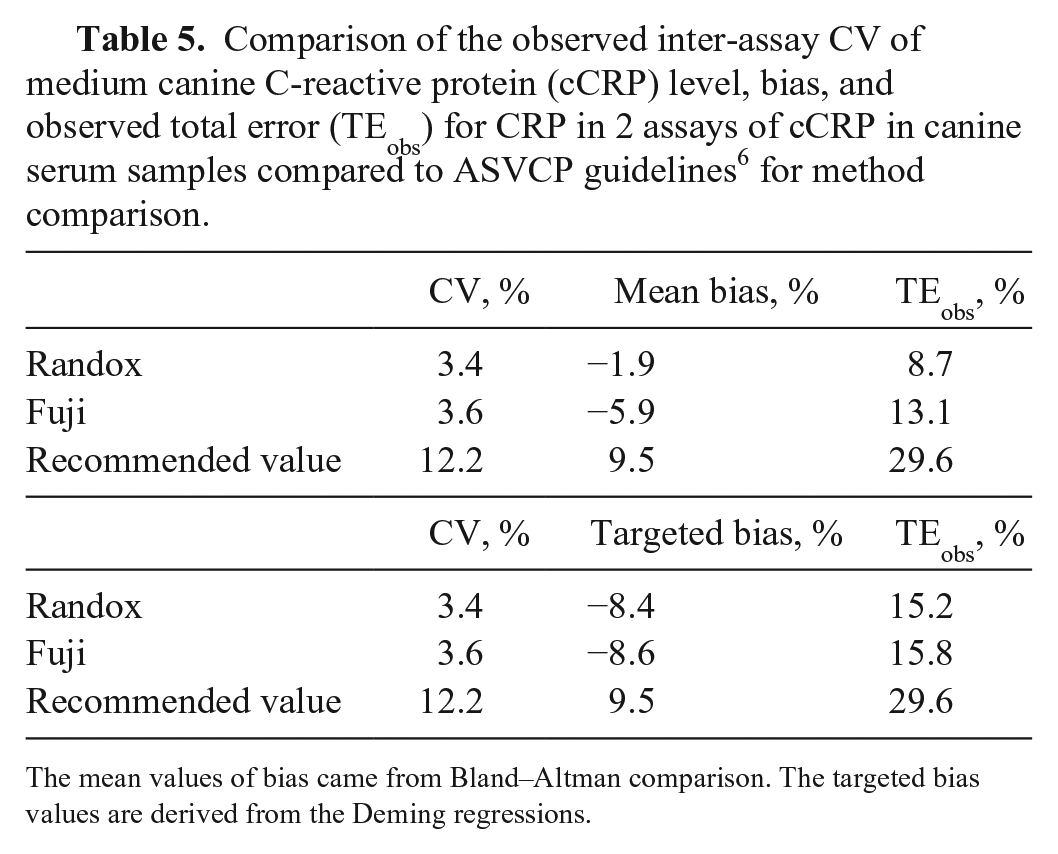
The mean values of bias came from Bland–Altman comparison. The targeted bias values are derived from the Deming regressions.
Given the bias between methods, generating RIs and threshold by method for correct interpretation and clinical decision making is indicated. Moreover, in the case of serial measurement values for a single patient, because these biases occur consistently, the values can still be helpful for indicating an inflammatory state. The RI of each assay would be different; determining method-specific RIs would allow compensation for the biases between methods. The Randox assay tended to measure CRP concentrations higher than the ELISA at <90 mg/L and lower than the ELISA at >90 mg/L. There is no published validation of the ELISA kit used in our study.
There were 3 major limitations to the computation of TEobs% in our study. The first was the determination of CV% in a concentration range from 50 to 100 mg/L, whereas the interpretation threshold could potentially be as low as ~20 mg/L, which then results in a risk of underestimation of CV in our study. The second limitation was the absence of published validation for our reference ELISA, and the question of using the ELISA as a reference. The third limitation consisted of our ignorance of the interpretation threshold for the Randox and Fuji assays, and the uncertainty about the bias. For the latter limitation, we are providing a computation of TEobs% with the mean bias between methods (probably irrelevant) and with a targeted bias at 50 mg/L, around the middle of the relevant range to consider for an interpretation threshold (then probably relevant). Considering an interpretation ~50 mg/L, the Randox and Fuji assays met the criteria presented in the ASVCP guidelines for allowable total error (TEa; 15.2, 15.8), bias (−8.4, −8.6), and CV (3.4, 3.6%). We cannot completely rule out that these assays would still meet the performance recommendations if the interpretation elected is at a significantly lower interpretation threshold.
The Randox and Fuji assays are rapid, reliable in the conditions we defined, readily available, inexpensive to use, and may be considered adequate for measurement of cCRP concentrations in dogs for identification of moderate or marked inflammation. These assays are acceptably correlated with our reference method. However, given that the results of these assays did not reach analytical agreement, the results obtained from these assays cannot be interchanged, and the same assay should be used for continuous monitoring of cCRP. Further studies are necessary for comparison among several assays of cCRP in veterinary medicine.
Footnotes
Acknowledgements
Our manuscript is based on the master’s thesis of Sung-Ah An at Chungnam National University, Daejeon, Republic of Korea.
Declaration of conflicting interests
The authors declared no potential conflicts of interest with respect to the research, authorship, and/or publication of this article.
Funding
This manuscript was published with the support of “Cooperative Research Program of Center for Companion Animal Research” (project PJ01404502): Rural Development Administration, Republic of Korea.