
Abstract
Trace mineral status is a critical component of bovine health. Impairment of physiological processes, caused by trace mineral toxicities or deficiencies, can be potential underlying factors of disease. Historically, the status of critical trace minerals, such as copper, manganese, selenium, and zinc, has been evaluated through the analysis of hepatic tissue. We assessed variation of these 4 elements between homogenized liver and samples of 0.02 g, 0.1 g, 0.5 g, and 1.0 g. We also evaluated concentration differences in copper, manganese, selenium, and zinc among samples stored under different durations. No differences in concentrations of copper, manganese, selenium, or zinc were observed among samples stored frozen for 3, 7, and 14 d post-collection. Statistical differences in concentrations of selenium and zinc were observed between 0.02-g biopsy samples and larger samples. Moisture content differed between 0.02-g biopsies and larger samples and over time. Results indicate that as little as 0.02 g of hepatic tissue dried to ~0.006 g is reliable for interpretation of trace mineral status and determination of toxicities and deficiencies in cattle pertaining to copper, manganese, selenium, and zinc, despite the small differences observed.
Nutrition serves as a foundational block for bovine health. 9 Trace minerals (TMs) are constituents of nutrition, and adequate concentrations are required for the facilitation of numerous physiological processes.8,15 TM imbalances, such as toxicities and deficiencies, can lead to impairment of these processes. 8 TM bioavailability, antagonists, and over- or under-supplementation may contribute to such imbalances.11,15 Predisposition to TM-associated toxicities and deficiencies can be dependent on age, breed, and environmental factors such as diet and regional geology.4,17 Clinical manifestations resulting from the hindrance of such processes may be associated with impaired immune system function, morbidity, decreased production, and death.6,7,13 The interactions shared among minerals are intricate. 12 An imbalance in a single mineral may have subsequent effects on other minerals and their associated functions.14,15
The liver serves as the major storage organ for a few TMs in ruminants. Liver biopsies offer a viable antemortem sampling option for evaluating TM status.1,3 Procurement of such samples to assess TM status in cattle was first described in 1950. 5 Since then, there has been progress regarding instrument and technique development, 2 but the size of sample obtained is still dependent on the instrument and technique used. 16 Controversy followed regarding the size of sample needed for reliable interpretation.1,10 We hypothesized that there would be no significant differences in Cu, Mn, Se, and Zn concentrations between different sizes of samples or concentrations in samples stored for different lengths of time when analyzed by inductively coupled plasma–mass spectrometry (ICP-MS).
Our first objective was to evaluate for differences in Cu, Mn, Se, and Zn between homogenized liver samples and samples of ~0.02 g, 0.1 g, 0.5 g, and 1.0 g. Our second objective was to evaluate differences in concentration of these minerals following different storage times prior to analytical processing.
Eight whole bovine livers from market-weight steers of undisclosed breed were collected from an abattoir for evaluation of TM concentrations. Livers were collected within 30 min of euthanasia, chilled during transport to the diagnostic laboratory, and stored at −20°C until time of sample collection. A period of 24 h was used for livers to thaw prior to sample collection. To replicate the natural position of the liver in a standing bovid, each liver was placed on a device that would hold the liver in a consistent position. Contamination between livers was prevented through washing and disinfection of the device between livers.
Samples were collected from the caudodorsal portion of the liver in a consistent manner using a plastic grid (Prym Consumer, Spartanburg, NC). Positioning of the grid was such that the first sampling section laid at 2.5 cm and 3.5 cm cranial to the caudal margin and ventral to the dorsal margin of the right lobe, respectively. Preparation of the grid through the cutting of openings prior to sampling allowed for consistency and to ensure that the correct size of samples was excised from their respective coordinates. Eight livers were sampled. Nine sets of 5 different-sized samples were collected from each liver.
Rows in the plastic grid were labeled 1–9 indicating the group of associated samples and the duration of storage that each row of samples would be assigned (Fig. 1). Storage duration for each row of samples was randomly assigned by lottery to prevent bias in storage effect toward specific sets of samples or areas of the liver. Each row possessed a set of samples that would be stored for 3, 7, or 14 d. Columns corresponded to the size of sample to be collected in each row. Collection of 0.02-g samples was performed using a 14-gauge biopsy needle (Surgivet 20mmT; Smiths Medical, St. Paul, MN). If a full biopsy needle trough was not obtained, subsequent attempts were conducted to accumulate enough tissue to fill the trough. Liver samples of 0.1 g, 0.5 g, and 1.0 g were obtained through excision using a number 10 scalpel blade inserted to a depth of ~0.5 cm. One-gram samples, taken 0.6 cm from paired 0.02-g samples, measured 1.5 × 1.5 × 0.5 cm. Half-gram sections were one-half that size. A liver portion, measuring 5.0 × 14.0 × 1.0 cm, immediately cranial to the grid was excised for homogenization and analysis. Size approximations of 0.1-, 0.5-, and 1.0-g samples were subjectively compared to pre-weighed bovine liver samples prior to the study. Each set of samples was taken at the same time prior to collection of the next set of paired samples in the following row.
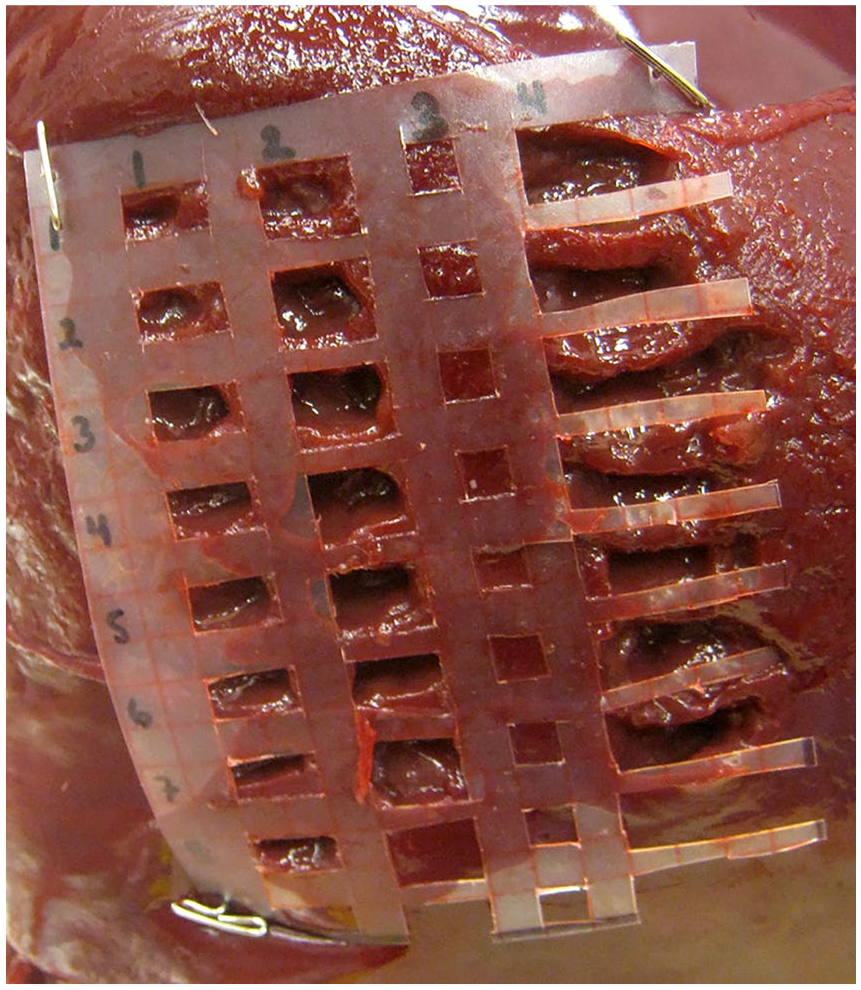
The plastic grid used to ensure consistent sample collection. Column numbers indicate sample size: 1 = 0.1 g, 2 = 0.5 g, 3 = 0.02 g, 4 = 1.0 g. The section of liver for homogenized samples was collected immediately cranial (right of the grid) and adjacent to the grid. Rows indicate groups of different sample sizes to be stored for a specified duration of time.
Samples were placed immediately in pre-labeled 5-mL polystyrene snap-cap tubes (Corning Science, Tamaulipas, Mexico). Plastic toothpicks (MedTech Products, Irvington, NY), were used to collect the 0.02-g samples taken with the biopsy needle; forceps were used for collection of the larger samples. To prevent contamination, all instruments were rinsed in saline (Braun Medical, Irvine, CA) and dried between samples. Toothpicks were disposed of after each use. Samples were stored at −20°C for their intended duration of storage. Prior to analysis, samples were weighed then dried at 100°C for 24 h at the conclusion of 3, 7, and 14 d post-collection, respectively. After drying, samples were weighed a second time and placed in a desiccator at room temperature prior to digestion and analysis to prevent moisture accumulation.
Dried 0.02-, 0.1-, 0.5-, 1.0-g, and homogenized samples weighed an average of 0.006, 0.038, 0.146, 0.293, and 0.303 g, respectively. Dried samples were digested in TM-grade nitric acid for 2 h at 65°C on a hot plate (BioExpress, Kaysville, UT) and diluted accordingly with 18Ω water. Randomized ordering of samples for analysis was performed using the random number generator function of Excel (Microsoft, Redmond, WA). Randomization of sample order precluded erroneous analysis of or bias toward a specified group of samples. Liver samples were analyzed for Cu, Mn, Se, and Zn by ICP-MS (820-MS inductively coupled plasma mass spectrometer; Varian Analytical Industries, Victoria, Australia). A single analytical run was performed on all samples. A National Institute of Standards and Technology (NIST; https://www.nist.gov/) liver standard and an in-house laboratory control liver were used to ensure quality control and to verify instrument accuracy.
Data were analyzed using split column analysis of variance with JMP Pro (SAS Institute, Cary, NC). Experimental design allowed for assessment of the effects of the amount of liver collected representative of method (0.02-, 0.1-, 0.5-, and 1.0-g biopsies, and homogenate) and storage duration prior to analytical processing (3 d, 7 d, 14 d), along with interaction of the 2 factors, with Cu, Mn, Se, and Zn concentrations as the response. Following establishment of any significant difference among the factors, specific differences in TM concentration means were evaluated using Tukey–Kramer adjustment for multiple comparison. Moisture content of samples was evaluated in the same manner. Significant differences were reported as p ≤ 0.05.
Differences in Cu, Mn, Se, and Zn concentrations among sample sizes were observed (p < 0.01; Table 1). There were no differences in Cu, Mn, Se, or Zn concentrations among samples stored for different lengths of time (p ≥ 0.06; Table 2). Copper concentrations in 0.1-g samples were less than those of 0.5 g, 1.0 g, and homogenized samples (p < 0.05). Manganese concentrations within homogenized samples were greater than all other samples (p < 0.02) but did not differ from those of 0.5-g samples. Mean selenium concentrations of 0.02-g samples were lower than all other sample sizes over all lengths of storage (p < 0.01). The mean zinc concentration of 0.02-g samples was less than all other sample types (p < 0.01). There was no evidence for an interaction among samples of different sizes and durations of storage for Cu, Mn, Se, and Zn (p > 0.05).
Mean trace mineral concentrations of different-sized samples. Mineral concentrations are reported on a dry-matter basis. Nine replicates of each sample size were taken from 8 animals.
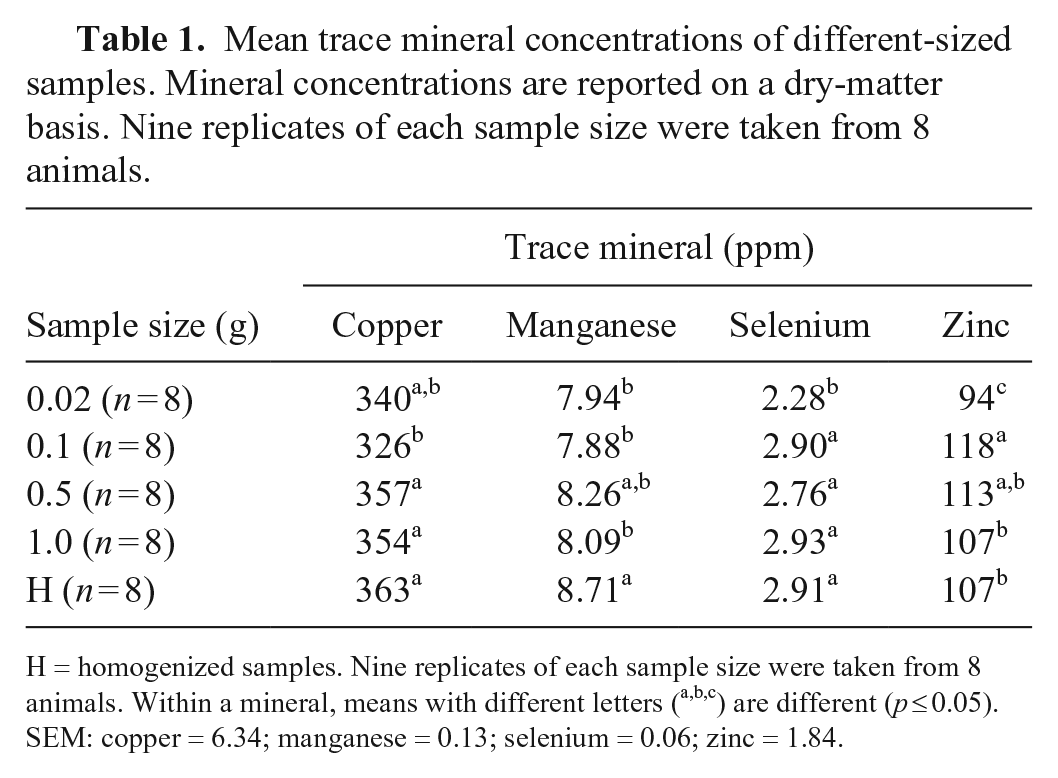
H = homogenized samples. Nine replicates of each sample size were taken from 8 animals. Within a mineral, means with different letters (a,b,c) are different (p ≤ 0.05). SEM: copper = 6.34; manganese = 0.13; selenium = 0.06; zinc = 1.84.
Mean trace mineral concentrations of samples stored for different lengths of time. Mineral concentrations are reported on a dry-matter basis.
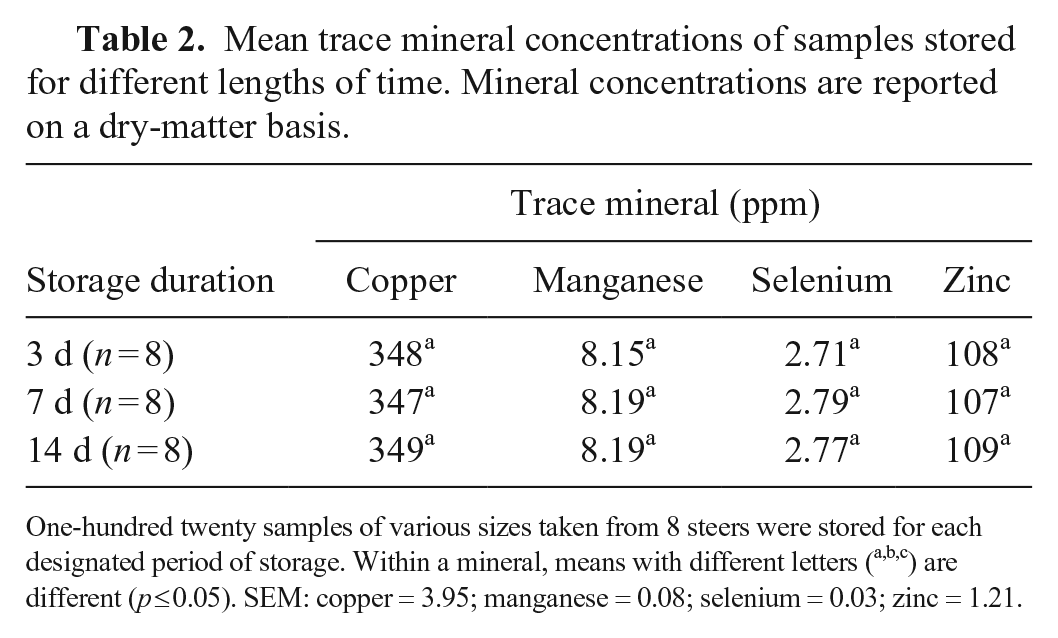
One-hundred twenty samples of various sizes taken from 8 steers were stored for each designated period of storage. Within a mineral, means with different letters (a,b,c) are different (p ≤ 0.05). SEM: copper = 3.95; manganese = 0.08; selenium = 0.03; zinc = 1.21.
Differences in moisture content were observed among different-sized samples (p < 0.01) and storage duration (p < 0.01; Fig. 2). Moisture content of 0.02- and 0.1-g samples was lower than all other sample types. Moisture within 0.02-g samples remained relatively the same through day 7 of storage. Moisture content of 0.02-g samples decreased by ~9% following 7 d through 14 d of storage. The moisture content of 0.02-g samples at 3 d and 7 d of storage was greater than biopsies stored for 14 d. There was a difference in moisture content as a result of the interaction between sample size and duration of storage. Moisture in 0.02-g samples decreased drastically as length of storage increased (p < 0.01).
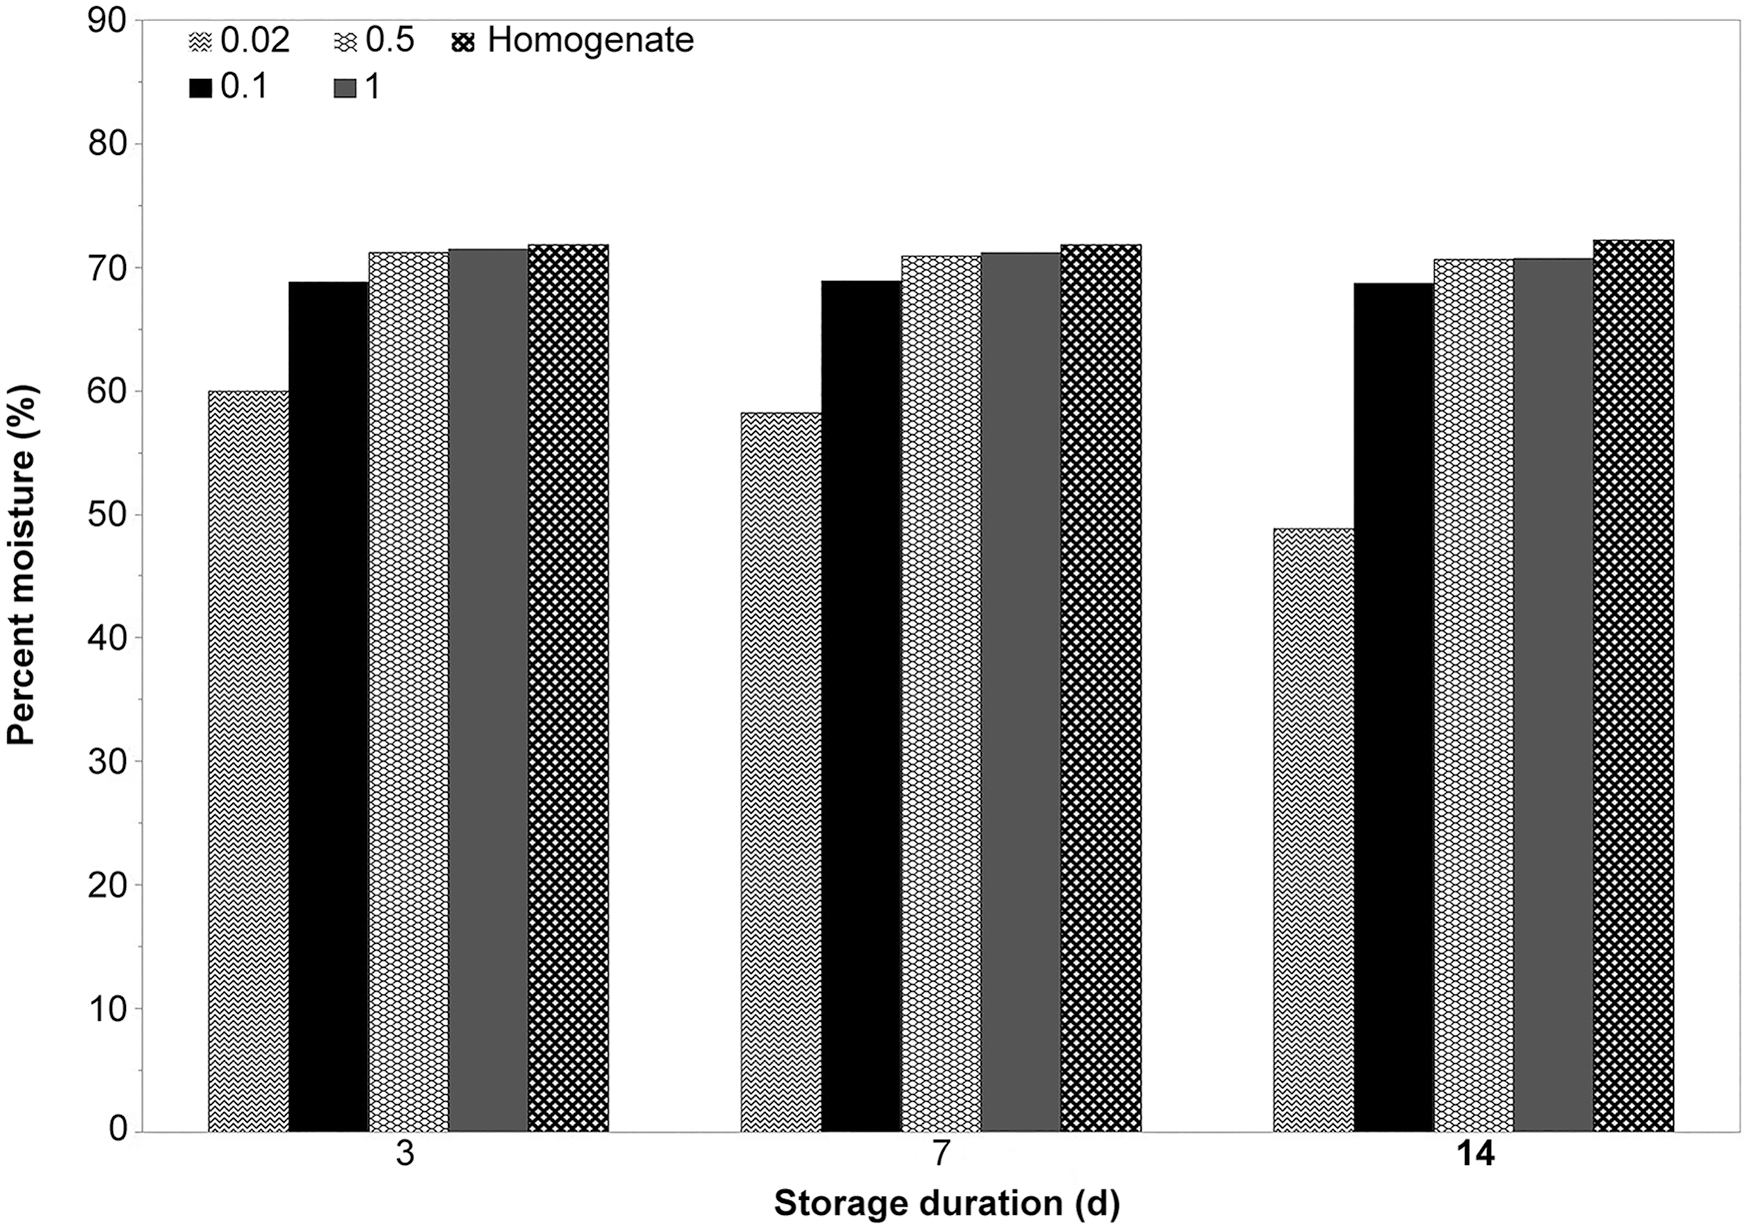
Moisture concentration of different sizes of liver samples represented in grams over storage time.
No difference among Cu, Mn, Se, and Zn concentrations was observed among the samples stored for 3, 7, and 14 d. Hepatic concentrations of these elements within each respective sample type remained consistent over different lengths of storage. Although small, statistical differences in concentrations were noted among samples of different sizes. Concentrations of Se and Zn in 0.02-g biopsies were statistically lower than larger samples. The lower concentrations of Zn in 0.02-g biopsies compared to that of larger samples is consistent with a previous study. 1 Concentration variation between different sample sizes within individual livers was similar to the overall analysis encompassing all livers. There was no evidence of a significant interaction between size of sample and duration of storage for Cu, Mn, Se, and Zn. Several variations in concentrations between different-sized samples stored for different durations were present. However, the lack of evidence for an interaction suggests that variation in concentrations between samples of different sizes is responsible for such differences.
Both sample size and storage duration appear to affect the percent moisture of 0.02-g samples. The results reveal a difference in moisture content between biopsy and larger samples stored for extended periods of time, with a dramatic decrease observed within the biopsy samples. Traditional conversion of results from wet weight to dry weight involves the multiplication of the wet-weight concentration by 3.5. 12 The difference in moisture content observed in 0.02-g samples emphasizes that TM analysis of liver samples should be performed on a dry-weight basis. Therefore, caution is advised in determining dry-weight TM concentrations following wet-weight analysis through the usual conversion practice. The data show that moisture content can vary between samples, even those within proximity, potentially providing inaccurate results if performed on a wet-weight basis. Instances in which 0.02-g biopsies are collected and stored over time prior to analysis would be especially prone to such errors because of potential variation in moisture content.
The processing procedure for each biopsy sample was identical and was performed in a consistent manner. The location in which biopsies were taken for our study correlates to liver that lies in the region of the right 10th intercostal space as indicated in a previous study (Hickok D, et al. Multi-elemental analysis of bovine liver biopsy and whole liver. Lincoln, NE: University of Nebraska-Lincoln, Institute of Agriculture and Natural Resources, 1996. Available at: https://digitalcommons.unl.edu/animalscinbcr/468/). Samples were taken in the same general area. This area is consistent with regions designated as “B” in one previous study 3 and “D3” and “D4” in another (Hickok D, et al. 1996). The region in which samples were obtained in the 1996 study was previously established to have higher concentrations of Cu, Mn, and Zn (Hickok D, et al. 1996).
A statistical difference (not a clinically relevant difference) in concentrations was observed based on sample size. All samples were collected, processed, and analyzed in an identical manner. Randomization of sample collection and analysis precluded bias toward either storage or sample-size groups. Control liver and NIST standards ensured consistent instrument function and accuracy. Concentrations among individual samples were not identical, but there were no statistical differences. A reason for this may be the result of variation in locations, although miniscule, from which samples were collected. Samples were not taken from the same exact site. Although some variation in TM concentrations in different regions of the liver has been noted, the only significant difference was for Mn (Hickok D, et al. 1996). The establishment of variation of TM concentrations between regions of the liver begs the question of the variation in TM concentrations within each of the regions. Given that samples taken within the same region were not identical, variation within each region is present to a degree.
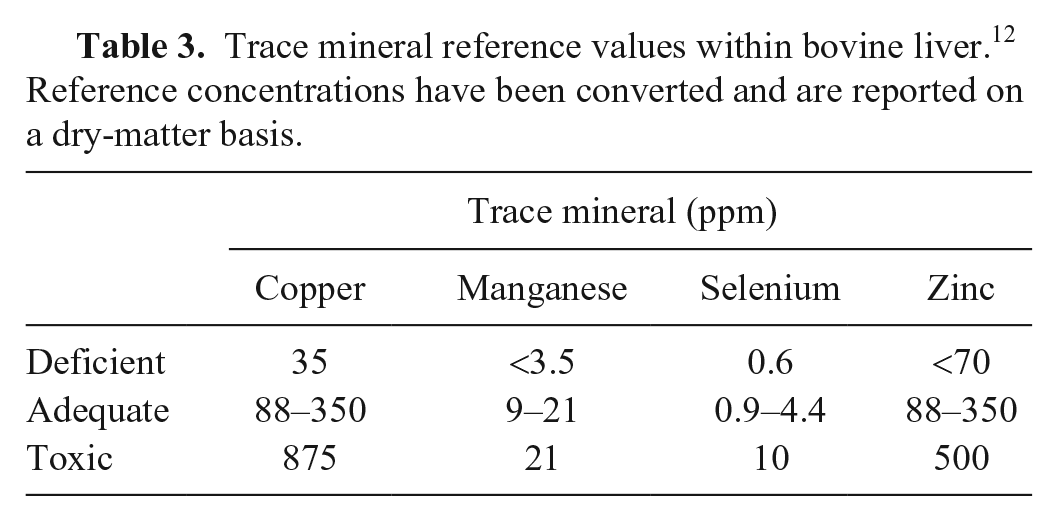
Samples, regardless of size, produce an approximation of TM concentration. The differences between the various types of samples are small and likely of little consequence for diagnostic purposes. 1 However, given the narrow margin between adequacy and deficiency regarding Se, 0.02-g biopsy samples may not always provide an accurate value, and results must be interpreted with caution. 12 Interpretation of results from any size of sample must be made within the clinical context of each individual case. Although there is no defined number of animals that should be sampled if a mineral deficiency or toxicosis is suspected, analysis of at least 10 individuals consistent with clinical observations should be analyzed along with several “normal” individuals. Normal animals can serve as comparative specimens but establishing reference values for comparison is recommended (Table 3). Given that the portion of the liver sampled in our study is believed to be the region containing the highest concentrations of the minerals of focus, it would be the best location to sample to evaluate for deficiencies. If this area is TM depleted, it is likely that the animal is depleted of the specified mineral (Hickok D, et al. 1996).
Trace mineral reference values within bovine liver. 12 Reference concentrations have been converted and are reported on a dry-matter basis.
Trace mineral concentrations in as little as 0.02-g samples, subjected to subsequent drying, would be considered reliable for diagnostic interpretation in accordance with a previous study. 1 We theorized that samples <0.005 g (5 mg) dry weight were considered unreliable for interpretation. The dry weight of all biopsy samples, except for 3, were ~ ≥0.005 g. Despite the statistical difference in Cu, Mn, Se, and Zn concentrations among samples of different sizes, our results agree with the previous study. 1
Liver biopsies provide a reliable diagnostic sample for evaluation of bovine TM status.1,10 Our results reveal that there is little difference in TM concentrations between samples of different sizes stored for different periods of time, suggesting that as little as 0.02 g of hepatic tissue would be reliable for diagnostic interpretation. Hepatic tissue can be stored for at least 14 d at −20°C with little concern for change in dry-weight concentrations of Cu, Mn, Se, or Zn. Evaluation of TM status of cattle is encouraged to prevent inadvertent TM deficiencies or excesses associated with adverse health. Analysis of liver for TM in 20-mg biopsy samples should always be done on a dry-matter basis. Evaluation of TM concentrations from samples ≥ 0.02 g of liver utilizing ICP-MS may offer aid in identifying deficiencies and toxicities in cattle.
Footnotes
Acknowledgements
We thank Olha Ivanytska, Angela Willems, and Dwayne Schrunk for their assistance and guidance with sample processing and analytic testing at the ISU VDL. We thank Dr. Somak Dutta for guidance and input regarding our statistical model. We thank the abattoir for its participation in procuring bovine livers for trace mineral analysis.
Declaration of conflicting interests
The authors declared no potential conflicts of interest with respect to research, authorship, and/or this publication.
Funding
The authors received no financial support for the research, authorship, and/or publication of this article.