
Abstract
To evaluate the utility of random-effects linear modeling for herd-level evaluation of trace mineral status, we performed a retrospective analysis of the results for trace mineral testing of bovine liver samples submitted to the Michigan State University Veterinary Diagnostic Laboratory between 2011 and 2017. Our aim was to examine random-effects models for their potential utility in improving interpretation with minimal sample numbers. The database consisted of 1,658 animals distributed among 121 herds. Minerals were assayed by inductively coupled plasma–mass spectroscopy, and included cobalt, copper, iron, molybdenum, manganese, selenium, and zinc. Intraclass correlation coefficients for each mineral were significantly different (p < 0.001) from zero and ranged from 0.38 for manganese to 0.82 for selenium, indicating that the strength of herd effects, which are presumably related to diet, vary greatly by mineral. Analysis of the distribution and standard errors of best linear unbiased predictor (BLUP) values suggested that testing 5–10 animals per herd could place herds within 10 percentile units across the population of herds with 70–95% confidence, the confidence level varying among minerals. Herd means were generally similar to BLUPs, suggesting that means could be reasonably compared to BLUPs with respect to the distributions reported here. However, caution in interpreting means relative to BLUPs should be exercised when animal numbers are small, the standard errors of the means are large, and/or the values are near the extremes of the distribution.
Keywords
Introduction
Assessment of trace mineral nutrient (TMN) status by laboratory means is common in bovine testing. Various laboratory samples such as blood serum or tissues are commonly analyzed, but liver tissue is considered an ideal test sample for the assessment of trace mineral nutriture. This is because bovine liver is readily accessible for biopsy sampling, and liver plays a central role in the metabolism of several TMNs.3,17
Frequently, the objective of TMN testing is to detect marginal deficiencies that may affect animal health or performance in subtle ways. Clinical concern for such marginal deficiencies typically arises at the herd level and is manifested by increased disease incidence or reduced productive or reproductive performance within the herd.7,19 In such cases, testing several animals from a herd or group is recommended to increase the sensitivity of the testing, 18 which is referred to as herd-level testing.
Methods of interpreting herd-level test results are not well established, and such interpretation is statistically more challenging than the interpretation of a single value from an individual animal. The challenge arises because individual values measured from multiple animals sampled within a herd are subject to 2 interrelated sources of variation, both of which are subject to a combination of randomness and biological effects. One source of variation is the expected variability that exists among individuals within a herd. This variation may result from many factors such as genetics, physiologic state, or prandial influences, among many other known and unknown influences. This is intra-herd variation. The other source of variation is inter-herd variation, which is created by factors that are common to all animals in a herd but vary from one herd to another. Some of the same biological factors may affect both intra- and inter-herd variation, but inter-herd variation is subject to environmental influences that are specific to each herd within the population. With respect to herd-level TMN testing, diet is the environmental factor generally of most interest. In a broad sampling of animals across the population, these 2 sources of variation are combined to give rise to a population distribution that is reflected in a standard deviation (SD), which is specific and characteristic for each TMN. It is from these population SDs that reference intervals for the interpretation of individual animal values are usually derived.
Inter-herd variability is reflected in the distribution of herd means that could be created by testing several animals in each of a group of herds. If the combined animals from all herds reflected a homogeneous population, then the mean of herd means would estimate the population mean, and the SD of herd means would be smaller than the population SD, diminishing as the number of animals tested per herd increased, as described by the central limit theorem. 13 However, the clinical assumption in herd-level testing is that the combined animals within a population of herds do not represent a homogeneous population. Rather, the clinical assumption is that there are herd influences, or herd effects, that are characteristic of the diet and management in the individual herds. These herd effects are assumed to vary, even over a population of healthy, well-nourished, and well-managed herds, thus creating a population distribution of herd means.
When a herd mean is calculated in a clinical investigation, the value is influenced by the randomness of each individual tested as well as by the dietary and environmental effects (herd effects) that influence all animals in the herd. It is the herd effects that are of clinical interest, but they are potentially obscured by the randomness of the values of the constituent individuals.
Statistical analyses exist to reveal measurable differences (such as herd effects) that are obscured among the randomness of individual measurements (animals). Statistical analyses of designed laboratory experiments might compare the effect of specific treatments applied to individual animals in a group. In such situations, classical statistical methods, such as the student t-test and analysis of variance (ANOVA), are appropriate means of comparing responses to treatments. In such situations, all animals would be selected and managed carefully in an attempt to minimize sources of variation other than the treatment. In such cases, the treatment responses are assumed to be finite and determined by some specific characteristic of the treatment, which could be a drug, feed additive, or something similar. A difference associated with a treatment is referred to as a fixed effect. 15
Rather than examining for a fixed effect, in herd-level TMN evaluation it is more appropriate to envision the herd under investigation as being compared to a group of herds selected at random from a population of apparently healthy and productive herds, none of which are identical. In this situation, inter-herd differences are referred to as random effects 16 because the comparison herds were selected at random from the reference population. Statistically, the desired objective is to determine the probability that the herd being investigated does not belong in the reference population (i.e., is not typical of a healthy, well-nourished herd). Random-effects models are designed to answer this question using appropriate computational methods, which are different from those used in the analysis of fixed effects.
Solutions to random-effects models are characterized by an overall model intercept, which is a close approximation of the population mean, intraclass correlation coefficient (ICC) values for each variable, and best linear unbiased predictor (BLUP) values for each group (herd). The values of ICC vary between 0 and 1. High ICCs indicate that intra-herd mineral concentration values are closely grouped relative to the distribution of inter-herd values; relatively low ICC values indicate the opposite. 4 In the 2-factor models presented here, the ICC value may be interpreted as the proportion of variability attributable to inter-herd variation.
The BLUP values generally approximate herd means. Relative to means, BLUPs are shrunk by the restricted maximum likelihood (REML) algorithm toward the overall population mean. The result is that a small number of relatively high or low values will have less effect on a BLUP than it will on the mean for the group. This allows information from relatively extreme values to be retained, in contrast to being potentially discarded as outliers, without inordinately influencing the interpretation. This effect of moderating the influence of disparate values has the potential to improve sample number economy, potentially allowing herd interpretations to be made with fewer animals sampled, compared to interpretations made from the herd mean. 5 Like ANOVA, the REML calculation assumes normal distribution of residuals. In contrast to ANOVA, there is no assumption of uniform variance among groups. 16
The primary objective of our research was to apply random-effects analysis to a large clinical database of bovine hepatic trace mineral concentrations to determine intra- and inter-herd variance proportions for each of several minerals, including cobalt (Co), copper (Cu), iron (Fe), manganese (Mn), molybdenum (Mo), selenium (Se), and zinc (Zn). Our goal was to use this information to make inferences as to which hepatic mineral concentrations are most amenable to herd-level nutritional interpretation. Secondary objectives were (1) to provide preliminary information relative to optimal numbers of animals to test per herd or group, and (2) to examine solutions to random-effects estimates as a direct means of interpreting herd-level TMN values. The optimal number of animals to test per herd was hypothesized to vary based on the specific mineral of primary interest.
Materials and methods
Data were selected as a convenience sample from all samples of bovine liver submitted to the Michigan State University Veterinary Diagnostic Laboratory (East Lansing, MI) between 2011 and 2017. The data were narrowed by selecting those cases in which 10–20 samples were submitted from a single owner on the same day and in which the age of the animal was either listed as “adult” or as > 30-d-old. The assumption was made that animals submitted on the same day from the same owner were sampled from a single herd, although this was not known with certainty. In all cases, species was listed as “bovine.” No attempt was made to subset the animals by sex, breed, season of sample collection, or geographic region.
Samples were all of unfixed tissue and < 100 mg as received, and in nearly all cases appeared to have been taken by percutaneous biopsy. Tissues were dried and weighed before overnight digestion at 95°C in ~10× the dry tissue mass of nitric acid. Digested samples were diluted with distilled, deionized water to 100× the dried tissue mass.
Elemental analysis employed collision/reaction cell inductively coupled plasma–mass spectrometry 20 (ICP-MS; 7900 spectrometer; Agilent Technologies). An aliquot of each diluted tissue digest and calibration standard was diluted 20-fold with a solution containing 0.5% EDTA and Triton X-100, 1% ammonium hydroxide, 2% butanol, 5 ppb of scandium, and 7.5 ppb of germanium, rhodium, indium, and bismuth as internal standards. The ICP-MS was tuned to yield a minimum of 7,500 cps sensitivity for 1 ppb yttrium (mass 89), < 1.0% oxide level as determined by the 156/140 mass ratio, and < 2.0% double-charged ions as determined by the 70/140 mass ratio. Elemental concentrations were calibrated using a 6-point linear curve of the analyte-internal standard response ratio. Standards were from Inorganic Ventures. Bovine liver standards (National Institute of Standards and Technology) were used as controls. All results are expressed on a dry tissue basis.
The initial dataset was comprised of 1,658 animals distributed among 121 herds with designed range of 10–20 animals per herd and a mean of 13.7/herd. This dataset was sequentially sorted by concentration of each mineral. Extremely high or low mineral values were retained for minerals when the preponderance of the highest or lowest values for a mineral came from the same few herds. Where this was not the case, individual animal values for a given mineral that were > 3 SD from the overall mean were dropped from the dataset as outliers, which resulted in the loss of 11 values for Mo.
For each mineral, individual histograms by herd were visually examined for evidence of bimodal distribution, which might have indicated that multiple populations were included in the sample set, or that there was potential contamination of some samples. Herds exhibiting such a pattern were dropped from the analysis. In the case of Zn, this resulted in dropping 14 herds; in the case on Mn, 5 herds were dropped. Thus, for all Zn analyses there were 107 herds, and for Mn analyses there were 116 herds. Many samples were submitted in test tubes designed for blood collection; the stoppers in many such tubes are known to be contaminated with Zn. 10 Thus, we suspect contamination of some biopsy samples as a result of contact with the tube stopper, resulting in occasional spuriously high Zn values in some herds. A potential explanation for the occasional high Mn values was not apparent.
ICCs were calculated (Proc Mixed program in SAS v.9.4; SAS Institute); the selected covariance structure was “Variance Components,” and REML was selected as the estimation method. Normality of residual distribution was evaluated visually using the graphical output (histograms and quantile-quantile plots) provided by Proc Mixed. Log transformation was applied if it provided clear improvement in the normality of residual distribution, as was the case for all minerals except Mo. If log transformations were used in statistical calculations, back-transformed results were used in data presentation. In those instances in which subsamples of animals were selected from herds, Proc SampleSelect in SAS v.9.4 was used to select the subsamples randomly.
To explore the relative effect of ICC on sample size required for statistical power, 2 simulated databases were created (Excel; Microsoft). The simulation databases consisted of 100 herds of 100 animals each with 1 mineral value created for each animal. ICCs for these databases were adjusted to reflect the range of ICC values observed for the minerals in the clinical dataset. The ICC values were adjusted by restricting the range of means and corresponding SDs allowed for the individual herds. A broader range of inter-herd means with a more restricted range of intra-herd SD values resulted in higher ICC values and vice versa. The ranges were defined using the RANDBETWEEN function in Excel. The individual animal values in each herd were then created in a normal distribution within herds with the Excel function NORM.INV(RAND(),X,Y) with X and Y respectively representing the mean and SD as generated by the RANDBETWEEN function. Random samplings of animals from the simulated herds were generated using Proc SampleSelect in SAS v.9.4. Five sets of random samplings were done across all 100 herds in each of the 2 datasets at each of 3 sample sizes (5, 10, 15). The solutions-to-random-effects function in Proc Mixed was used to test if the herd BLUP was different than the intercept (approximation of the population grand mean). The herds were sorted by the probability (p value) that BLUPs were different than the intercept. Herds were identified that had p values closest to the pre-specified α levels (0.01, 0.05, 0.10). For these herds, the absolute difference in the herd BLUP relative to the intercept was determined. This process was repeated for 5 iterations. The data were analyzed (Proc ANOV in SAS v.9.4) as a 2 × 3 × 3 factorial with main effects of ICC, α level cutoff, and sample size. The dependent variable was the proportional deviation of the herd BLUP from the intercept (grand mean). There were n = 90 individual points. The relationship of this analysis to statistical power is further described in the Results section.
Results
The ICC values were significantly different from zero (p < 0.001) for all minerals, indicating that environmental effects across herds (inter-herd effects) influenced hepatic mineral concentrations significantly. However, the magnitude of the ICC values varied substantially among the various minerals (Table 1).
Intraclass correlation coefficients (ICCs) for herd effect for bovine hepatic trace mineral concentrations measured in 121 herds.
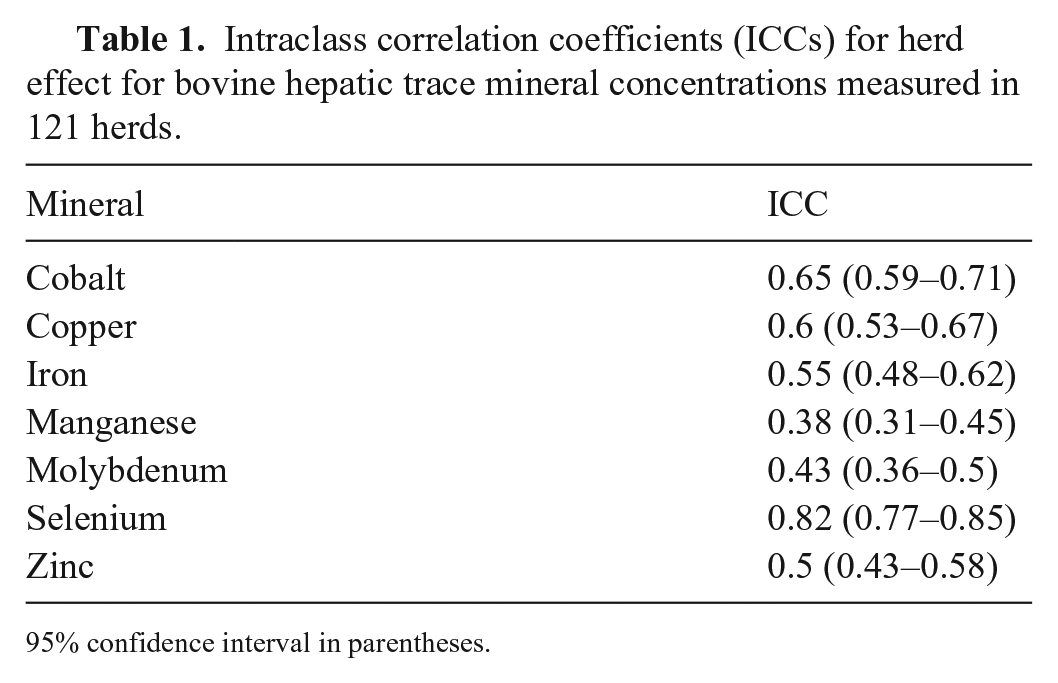
95% confidence interval in parentheses.
For clarity of illustration, given the large number of herds, the values of BLUPs are presented as line graphs (Fig. 1) in which the BLUP values for each herd are sorted from lowest to highest and represented by the solid orange line. For those mineral values log-transformed prior to analysis, the BLUP values have been back-transformed prior to the construction of these charts. To illustrate the relationship of means to BLUPs across the range of values, the means for each herd are plotted along with the BLUPs and represented by the blue line. Thus, deviations in means relative to BLUPs are indicated on the charts by deviations of the blue line from the orange line. Individual peaks along the blue line represent individual herd deviations whereas longer areas of separation between the colored lines, as is seen along the right side of the graph for copper values, represent a series of herds with mean values deviating from BLUP values. The population mean is represented as a horizontal, dotted line across each chart. Minerals with relatively steep changes in BLUP values across the population, such as Se (Fig. 1), had greater extremes of deviation from the population mean. This was reflected in the proportion of herds for which BLUP values differed significantly (p < 0.05) from the mean, which ranged from a high of 81% for Se to a low of 39% for Mn. The population distributions of BLUP values for each mineral are presented as histograms (Fig. 2) and percentiles (Table 2). The confidence interval (CI) values plotted above the histograms were derived by subsampling from the herds at either 5 or 10 samples per herd.
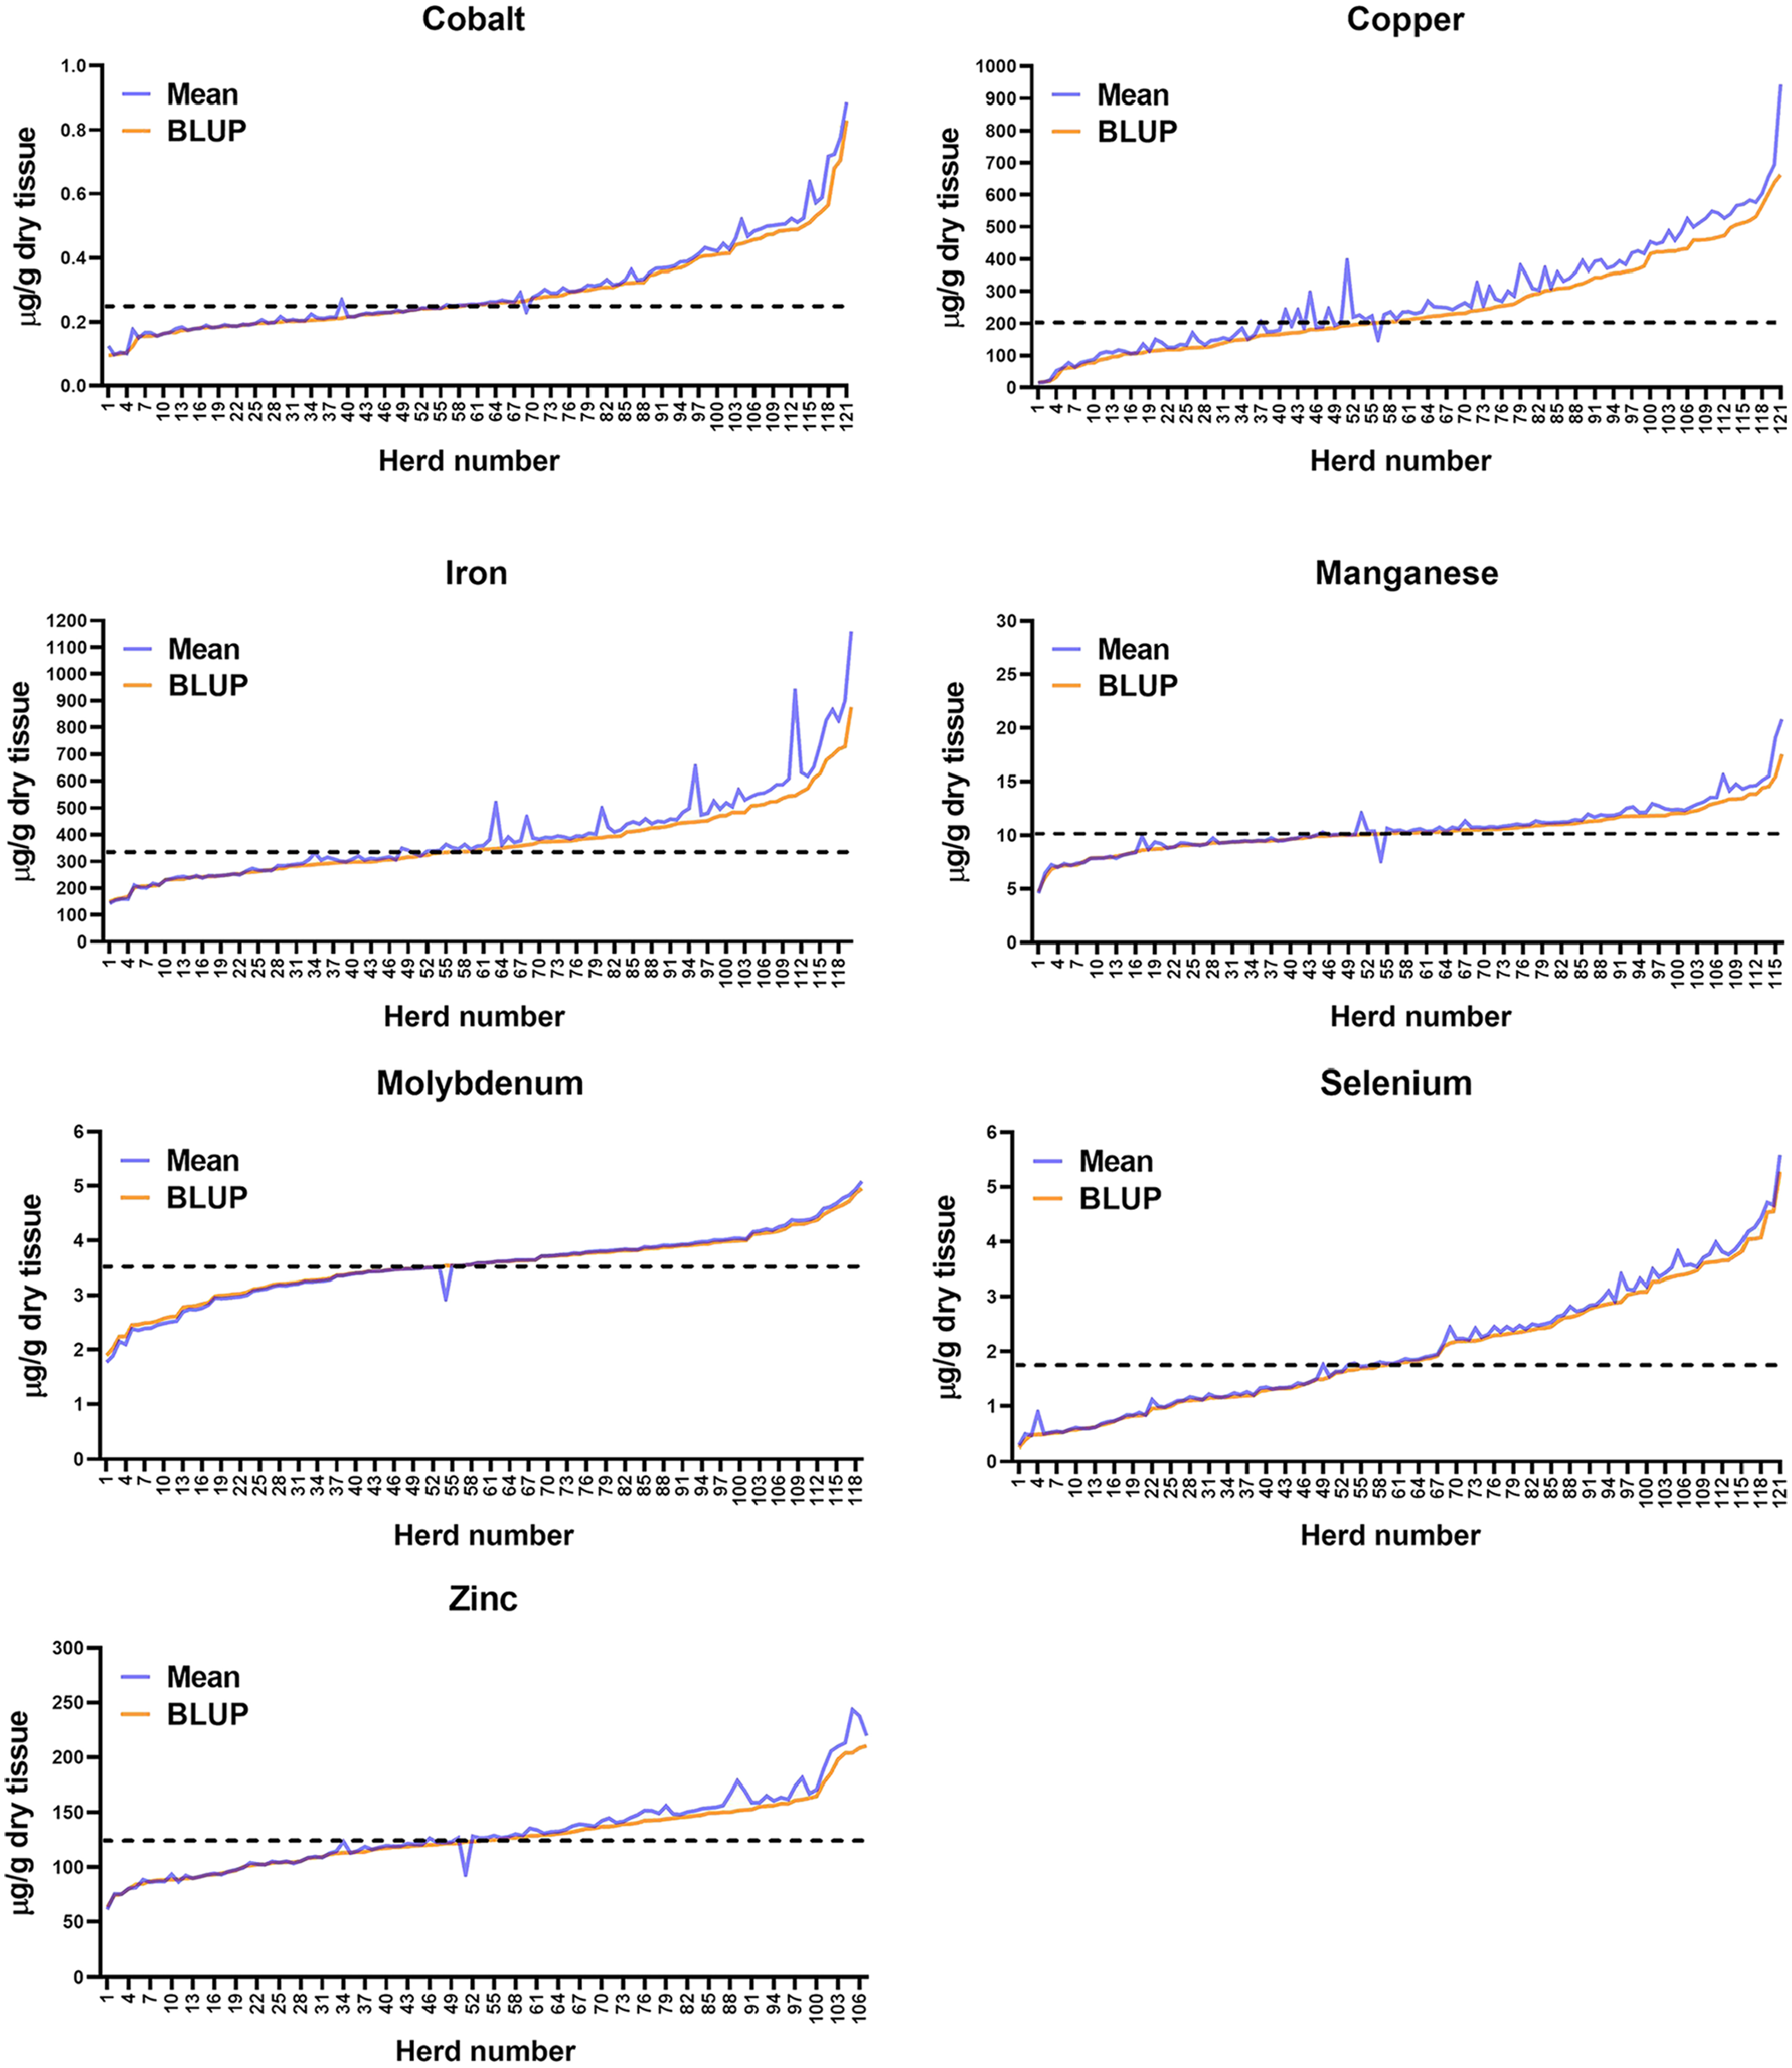
Distribution of best linear unbiased predictors (BLUPs) and means for bovine hepatic trace minerals. Values represent a retrospective analysis of 121 accessions in which 10–20 bovine liver samples were submitted to the Michigan State University Veterinary Diagnostic Laboratory, 2011–2017. The combined animals from each accession were assumed to represent a herd. Values for individual herd BLUPs are plotted from lowest to highest (orange line) with corresponding herd means plotted as the blue line. The dotted line represents the population mean.
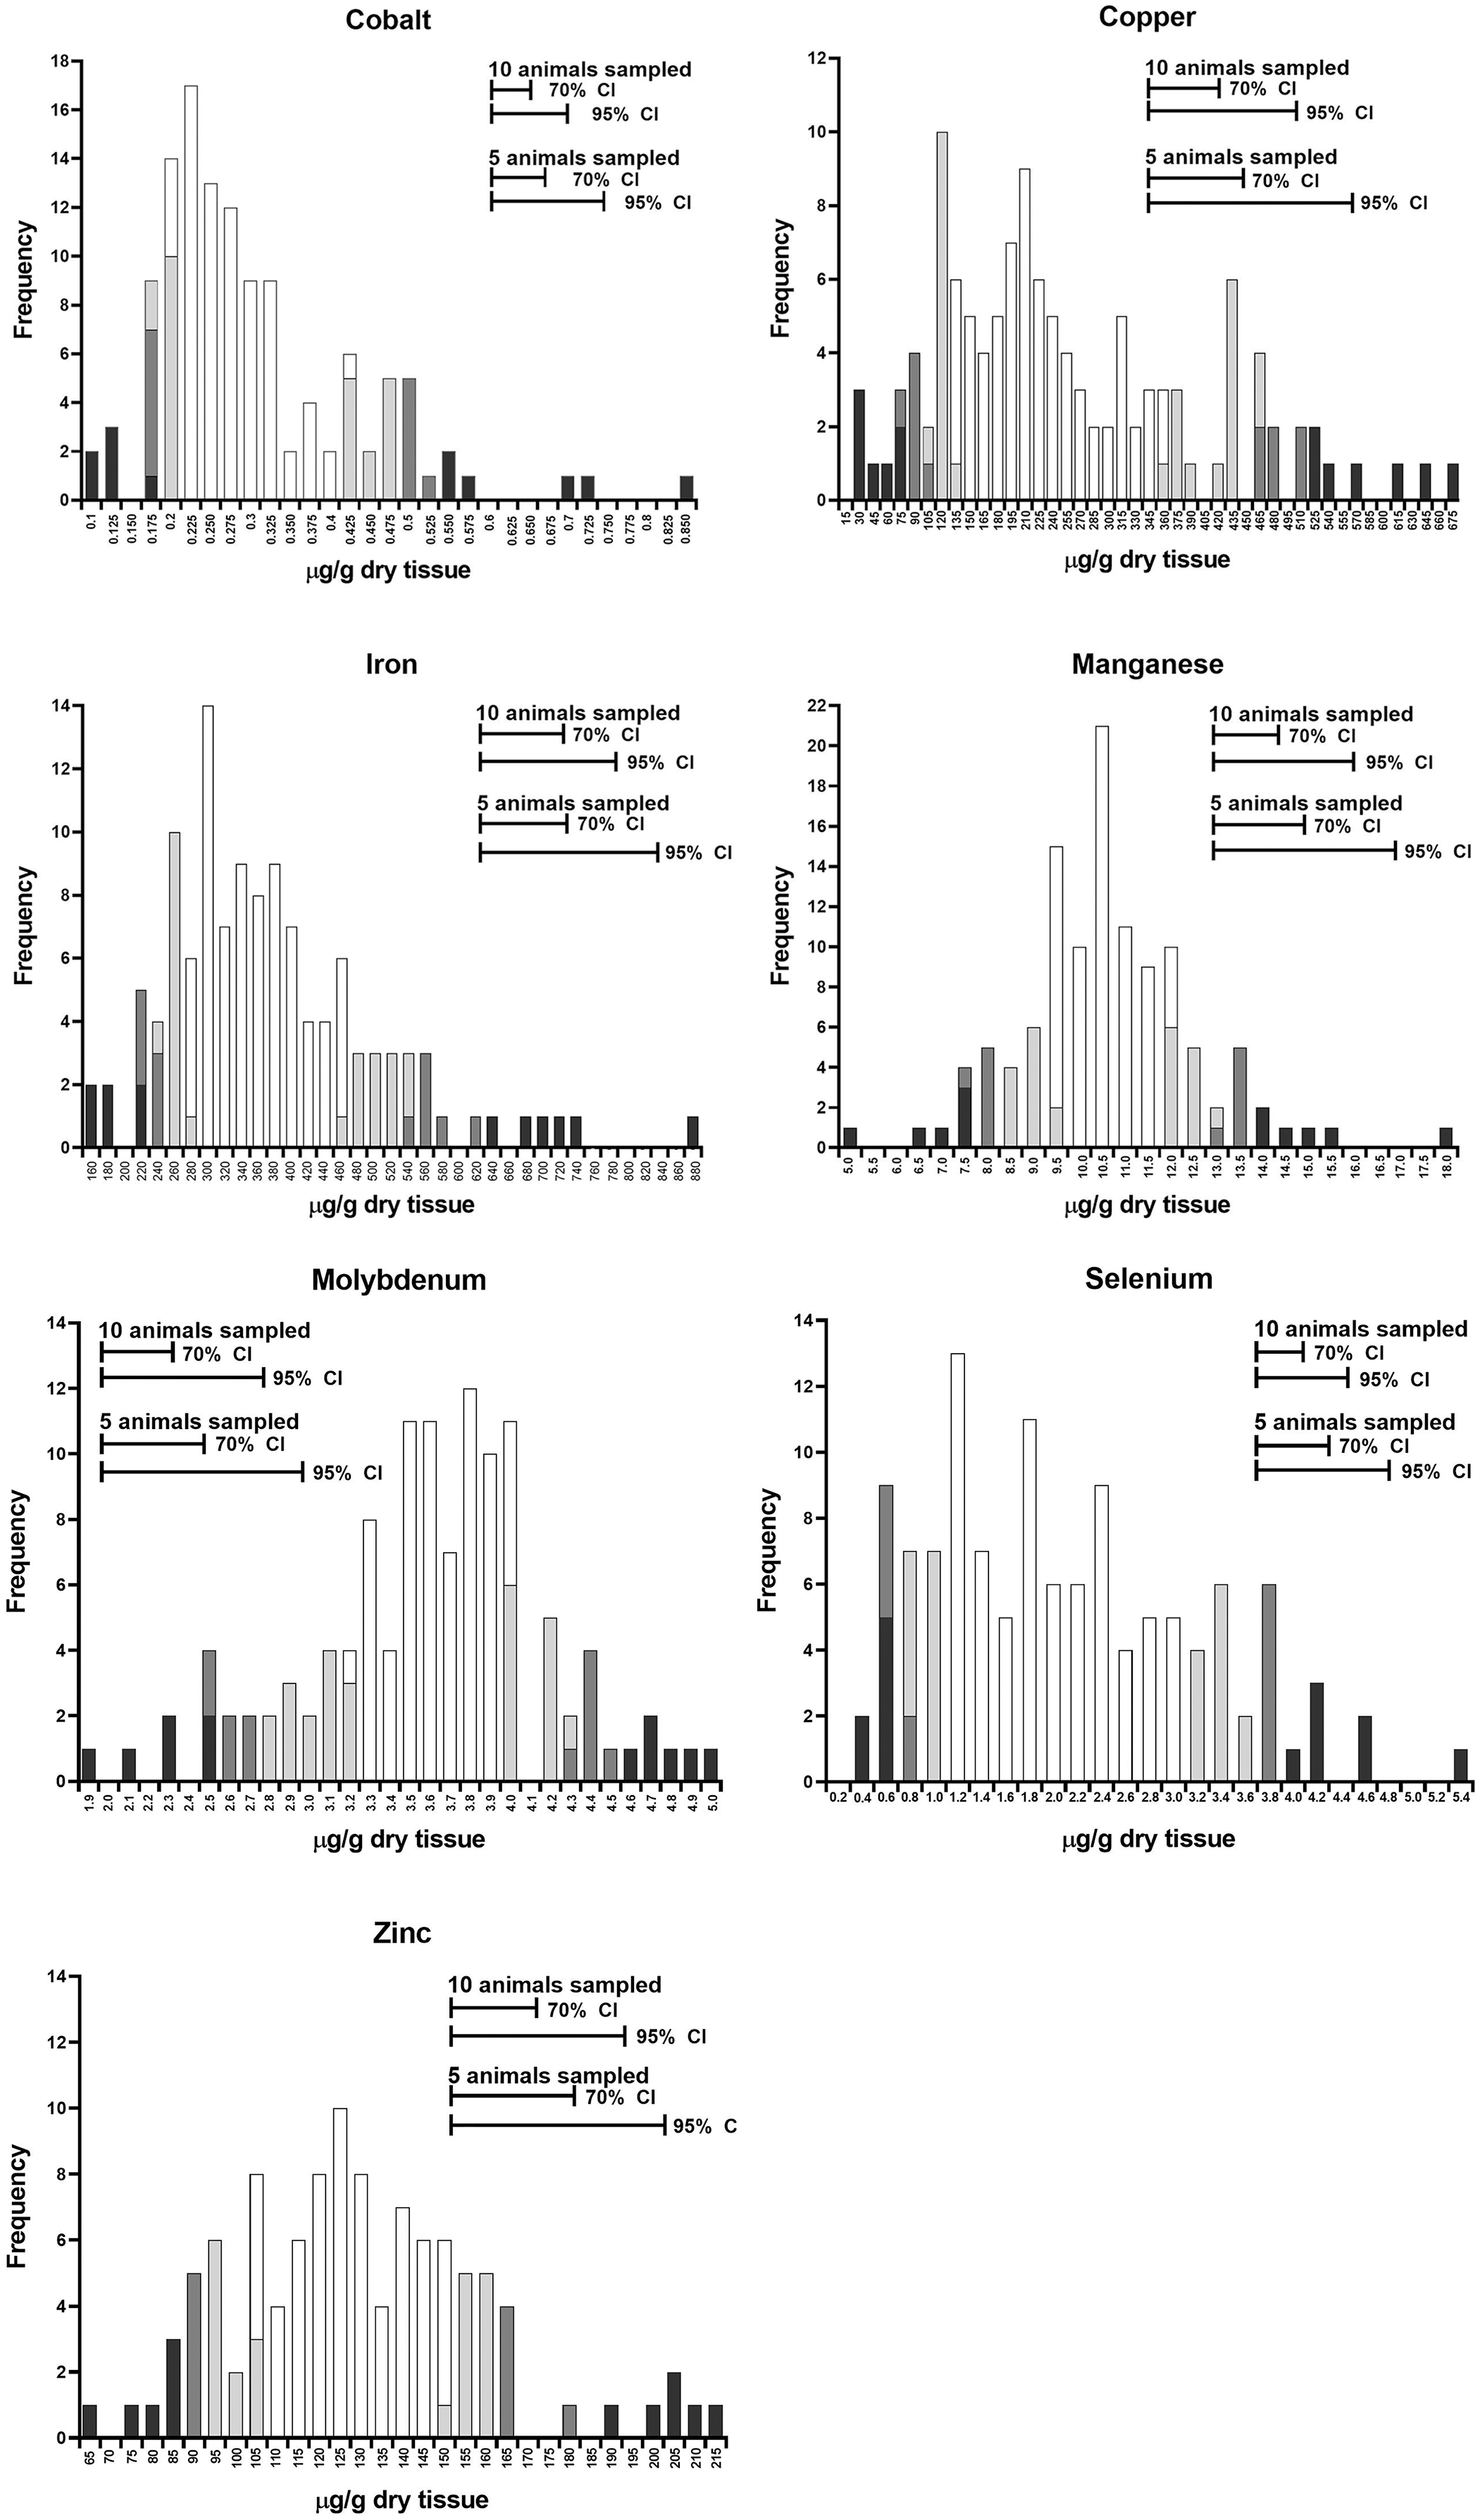
Histogram of best linear unbiased predictor (BLUP) values from a retrospective analysis of 121 accessions in which 10–20 bovine liver samples were submitted to the Michigan State University Veterinary Diagnostic Laboratory, 2011–2017. The combined animals from each accession were assumed to represent a herd. Portions of the frequency bars with darkest shading represent the 5th and 95th percentiles of the distribution, the next lighter shading adds the 10th and 90th percentiles, and the lightest shading adds the 20th and 80th percentiles. Open bars represent the remainder of the distribution. Horizontal lines at the top of the chart represent the 70% and 95% CIs for herd values, based on samples of either 5 or 10 animals/herd.
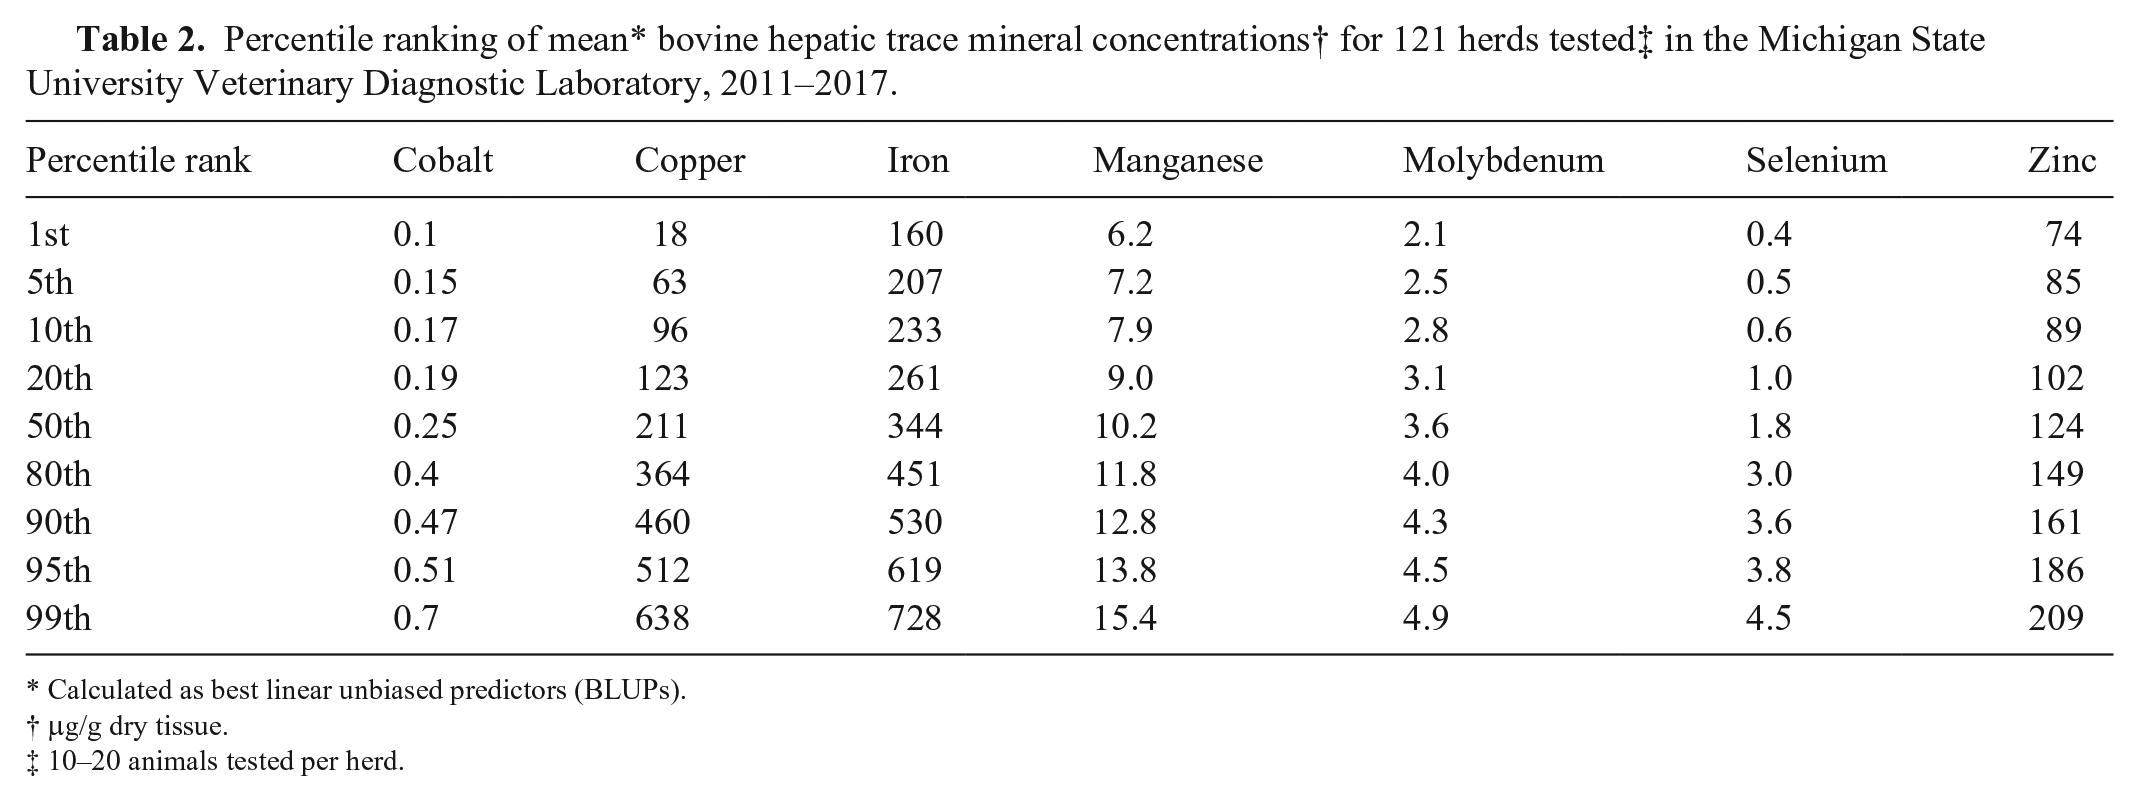
Calculated as best linear unbiased predictors (BLUPs).
μg/g dry tissue.
10–20 animals tested per herd.
The objective of the analysis of the simulated data was to illustrate indirectly the effect of variation in ICC values on the statistical power available to identify herds as having excessive or deficient hepatic TMN status (Fig. 3). Statistical power is the probability of rejecting a null hypothesis when the null hypothesis is false, 13 which in this case equates to identifying a herd as different from a reference standard. For this example, the standard was the population mean. In relation to the analyses reported here, statistical power is a function of the number of animals tested per herd, the minimum degree of difference from a reference value that is considered clinically meaningful, the confidence that is desired for the interpretation (α), and the intra-herd variability of mineral values. The ICC is related to the latter of these variables in that higher ICCs reflect lower intra-herd variability, relative to inter-herd variability. Thus, higher ICCs could be expected to indicate greater statistical power, assuming that the other factors determining power are equal.
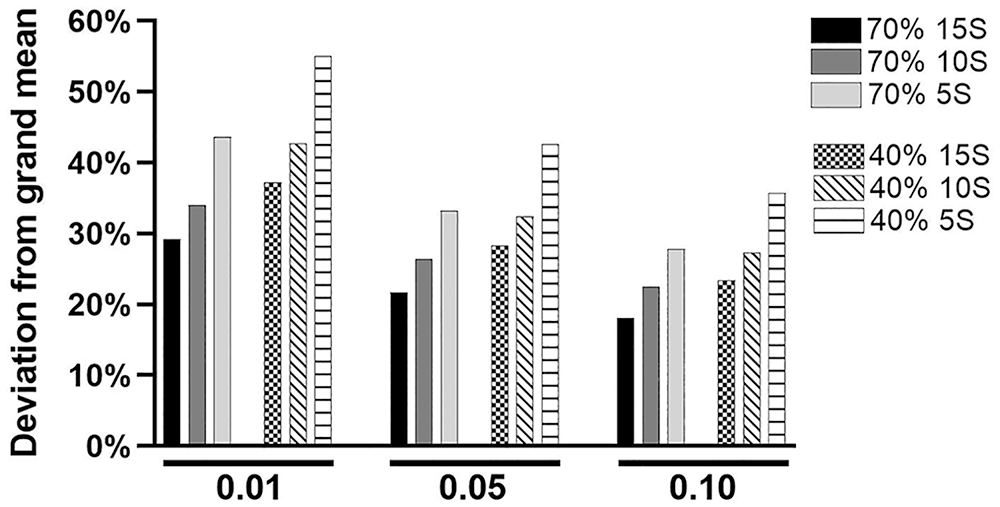
Effect of intraclass correlation coefficient (ICC) and sample size on statistical power. Two hypothetical databases of 100 herds of 100 animals each were created. One had an ICC of 0.7 and the other an ICC of 0.4, reflecting the range of ICC values observed in the clinical data. The solid bars represent the database with an ICC of 0.7, and the patterned bars an ICC of 0.4. Herds were sampled randomly without replacement. Sets of 15, 10, and 5 samples (15S, 10S, 5S) were taken. The chart illustrates the mean percent deviation of the herd BLUP from the grand mean that resulted in a significant difference at the listed p values, based on 5 iterative samplings for each combination of ICC and sample size. Both main effects (ICC and sample size) were significant (p < 0.01). There was a significant (p < 0.03) interaction of ICC by sample size in which the response increased to a greater extent relative to sample size in the 40% compared to the 70% ICC groups. Note that both increasing the ICC and increasing the sample size resulted in a smaller deviation in herd BLUP from overall mean that would be identified as significant at the various p levels.
As expected, increasing the α value resulted in smaller deviations being classified as significantly different from the population mean (p < 0.01), as did increasing the sample size (p < 0.01; Fig. 3). Increasing ICC also resulted in smaller deviations, on average, being identified as significantly different from the population mean (p < 0.01), suggesting the statistical power for classifying herds increases with the ICC. The population mean was used as the reference point upon which herds were compared (Fig. 3). We do not propose that the population mean is the appropriate standard of comparison in clinical application, but we do not feel an appropriate alternative standard can be determined from the data available for our analysis.
Discussion
The ICC values for each mineral in our analysis demonstrate that measurable effects of herd environment on hepatic mineral concentrations were observed. Although it is hypothesized that these environmental effects were primarily the result of nutritional influences, that cannot be concluded with certainty from these data. The influence of diet on hepatic trace mineral concentrations is well established for most nutritionally important trace minerals. 17 However, across a broad population of herds, the proportional contributions of herd environment (inter-herd variation) versus random variation among individual animals (intra-herd variation) have not been demonstrated previously, to our knowledge. The inference from this information is that nutritional information of sufficient sensitivity may be derived from herd-level analysis of bovine hepatic biopsy specimens from a number of animals that would be deemed practical by most veterinary practitioners and herd managers.
The physiologic basis of the observed differences in ICC values among specific minerals cannot be determined from our data. However, some speculation can be offered. Se, the mineral with the highest ICC value, provides an example. Biological homeostasis of this element is regulated primarily at the level of excretion. Available dietary Se appears to be absorbed from the gut in a largely unregulated manner. Considerable metabolism of Se occurs in the liver, in which the element is directed into a hierarchical pattern of synthesis of various selenoproteins; Se in excess of requirements is converted into water-soluble products destined for urinary excretion. 1 The liver is the central clearinghouse for directing dietary Se between metabolism and excretion, thus establishing Se homeostasis. This is consistent with our observation that there is a large herd effect, which is likely to be dietary, on hepatic Se concentration.
Hepatic Mn concentration, in contrast to Se, had a relatively low ICC value, indicating a relatively low effect of herd environment. Mn homeostasis appears to be primarily regulated at the level of dietary absorption, with absorption being down-regulated as tissue sufficiency is achieved. 12 Thus, for typical diets, dietary Mn in excess of requirements is retained in the gut and never reaches the liver or systemic tissue environment. Therefore, hepatic Mn concentrations could be expected to be influenced much less, compared to Se, by dietary variation among herds, which is consistent with our observation of a low ICC value for Mn. Additional hypotheses could be generated to explain the variation observed in ICC values among hepatic mineral concentrations, but these examples illustrate how nutritional and metabolic physiology could interact to create the results observed in our analysis.
Quantitative information relative to the diagnosis of trace mineral deficiencies or excesses cannot be determined from the data presented here. Diagnosis of overt trace mineral deficiency diseases or toxicities requires the identification of functional or morphologic abnormalities in addition to low or high tissue mineral concentrations. 17 Currently, overt trace mineral deficiency diseases are unusual in agricultural production in developed countries. Of greater concern is the existence of “mineral-responsive” conditions that are clinically indistinguishable from non-mineral–associated disorders. Such conditions include other forms of malnutrition or subclinical toxicities, chronic parasitism, and other forms of chronic infectious disease. All of these conditions may result in reduced feed intake, suppressed immunity, poor growth rates, poor fertility rates, and general ill thrift, thus, mimicking the signs associated with trace mineral responsive conditions.18,8,14,17 Feed analysis and soil mapping may be useful in predicting the probability of trace mineral responsive conditions, but are frequently insufficient. 18 Thus, animal evaluation, including trace mineral analysis, is an essential part of trace mineral investigations.
Interpretation of clinicopathologic data at the herd-level in livestock species has been the subject of several investigations.2,11,9 The central characteristic in these studies has been the establishment of “cut points” that identify animals at risk of disease. The proportion of tested animals with values outside the specified cut points is then used as the herd-level criterion for evaluation. The establishment of cut points requires the existence of one or more dichotomous variables that have a relatively strong relationship with the clinicopathologic variable being investigated. As pointed out above, abnormalities associated with mineral-responsive conditions are nebulous and may be related to numerous conditions other than trace mineral deficiencies; thus, there are most likely no dichotomous variables associated with moderate trace mineral deficiencies with sufficient sensitivity and specificity to allow the determination of useful individual animal cut points for application to herd-level TMN evaluation.
We anticipated that solutions of the random-effects estimates, which identify herds with BLUPs significantly deviant from the population mean, might serve as a useful clinical index of mild-to-moderate trace mineral deficiency or excess. In the case of each of the minerals, however, there was a high proportion of herds with BLUPs significantly different from the population mean. This is not surprising given that, in individual animals, a broad range of hepatic mineral concentrations is compatible with health and productivity; thus, it could be expected that there would be a similar situation at the herd level, making the population mean too restrictive as an index of clinical comparison.
Rather than using the population mean as a reference point, a more expedient means of applying BLUPs to the herd-level evaluation of hepatic trace mineral concentrations might be to compare herd BLUPs to the population distribution of BLUPs. An ideal database for such comparison would be a relatively large population of healthy, productive cattle herds, as has been attempted in relation to serum trace mineral concentrations. 6 Relative to hepatic trace mineral concentrations, such a database does not exist. Given the expense and the need to solicit cooperation of herd owners for liver biopsy of their animals, creation of such an ideal database is unlikely to occur in the foreseeable future. The database used in our investigation was useful for the stated objectives but is not ideal for the establishment of reference values. However, to illustrate the method by which our data might be applied in comparing individual herd BLUPs to a large distribution of herd BLUPs, we have presented in Table 2 and Fig. 2 the percentile distribution of BLUPs for the 121 herds examined in our study. Because our database is large and novel in its herd-level character, the distribution of our data may provide useful insight for clinical interpretation of herd BLUPs or means. Our database should not, however, be interpreted as an ideal standard from which to make clinical interpretations.
As expected, herd BLUP and mean values were generally similar. In those instances where there was deviation, the deviation did not appear sufficient to affect clinical interpretation, or both the BLUP and mean values were at the tails of the distribution and a clinical problem was likely to have been suspected based on the interpretation of either parameter. Thus, herd means appear of nearly equivalent value to BLUPs in clinical evaluation. This is of practical significance because BLUPs can only be calculated within the analysis of a reference population, and the individual animal values generally require logarithmic transformation prior to analysis. These factors limit the practical application of random-effects models in individual herd evaluation. Nevertheless, analysis of the random-effect models has provided important information relative to the planning of herd-level hepatic mineral sampling, particularly relative to sample number decisions.
Analysis of random-effects models provides a pooled standard error (SE) that may be used to predict herd-level SEs, given a specific number of animals sampled. This is valuable because it facilitates sample number estimates relative to desired statistical power, prior to the collection of samples. Histograms of BLUP values are provided for each mineral (Fig. 2). The frequency bars, or portions of bars, with the darkest shading represent the lower 5th or the upper 95th percentiles of the distribution, the intermediate shading adds the lower 10th and upper 90th percentiles, and the lightest shading adds the lower 20th and upper 80th percentiles; the open bars represent the remainder of the distribution. The interval segments in the upper portions of each chart represent the 70% and 95% CIs around the BLUP, respectively. The CIs are calculated at each of 5 or 10 animals sampled per herd. The width of the CIs varies among minerals and is a function of the ICC and the number of animals sampled. These variables, ICC and number of animals sampled, influence the statistical power of comparisons among herds.
Statistical power is typically expressed as a percentage and is the probability of detecting a difference of a given magnitude or greater among means at some stated confidence level (p value), should such a difference actually exist. 13 Statistical power in any analysis comparing means is a function of SEs of the means, with diminishing SEs resulting in increasing statistical power. SEs of means, in turn, are a function of sample size and the SD of the population. In random-effects analyses, increasing ICC is additive with sample size in determining statistical power because an increasing ICC reflects diminishing intra-herd SDs, relative to the magnitude of inter-herd variation. Thus, both increasing sample size or increasing ICC will result in smaller SEs and an increasing probability of distinguishing differences among herds (Fig. 3).
For each mineral in our analysis, the degree of statistical power for placing herds within the population distribution at 5 or 10 animals sampled per herd is reflected in the relative sizes of the 70% and 95% CIs (Fig. 2). For these hepatic trace mineral concentrations, herds could be reasonably placed within the population distribution by sampling 5–10 animals, with smaller sample numbers more acceptable for high ICC minerals like Se or Co, and larger sample numbers more appropriate for low ICC minerals, such as Mn. Herd mean values could be reasonably substituted for BLUPs in the application of these charts.
The statistical power required for a herd investigation should be perceived as a clinical decision. In scientific investigation, 95% CIs or greater are an accepted norm; these values reflect the general concern of research investigators for avoiding type I statistical error: concluding an effect when no effect is present. In clinical practice, however, type II error may be of equal or greater importance; the cost of not intervening when intervening is indicated may outweigh the cost of a potentially unnecessary intervention. Diagnosticians should provide knowledgeable advice, and clinicians and herd managers must weigh the cost of laboratory testing versus their confidence in the testing information.
Footnotes
Declaration of conflicting interests
The authors declared no potential conflicts of interest with respect to the research, authorship, and/or publication of this article.
Funding
The authors received no financial support for the research, authorship, and/or publication of this article.