
Abstract
Veterinary analytical chemistry laboratories might be called upon to analyze formalin-fixed or paraffin-embedded tissue samples for trace minerals. The purpose of this study was to determine whether concentrations of copper (Cu), iron (Fe), and zinc (Zn) are comparable among fresh or frozen, formalin-fixed, and paraffin-embedded bovine liver samples on an as-received basis. Three liver sample subtypes (fresh or frozen, formalin-fixed, and paraffin-embedded) from 12 cows were collected and analyzed for Cu, Fe, and Zn concentrations. Concentrations were measured by using inductively coupled argon plasma atomic-emission spectroscopy. There was no significant difference in mineral measurements between fresh or frozen and formalin-fixed samples for Cu and Zn (both P ≥ 0.052). The median concentration of Fe was lower in the fresh or frozen samples than in the formalin-fixed samples. However, for every pair of fresh or frozen and paraffin-embedded samples for all 3 minerals, the fresh or frozen sample had a lower measurement than the paraffin-embedded sample (all P = 0.005). Differences in mineral measurements associated with tissue processing did not result in differences in classification (within or outside the reference range) for Fe. However, the classification of Cu and Zn was different up to 25% of the time with fresh or frozen versus formalin-fixed or embedded liver. Although Cu, Fe, and Zn concentrations attained from processed tissue may be useful, they must be evaluated with caution.
Keywords
Tissues are analyzed for trace minerals at veterinary analytical chemistry laboratories to diagnose toxicosis, assess nutritional status, or associate with histologic findings. Such tissue samples are usually collected and submitted fresh or frozen. Sometimes, however, the only tissue available for mineral analysis is either formalin fixed or formalin fixed and then paraffin embedded. The effect of these processes on the trace mineral content in animal tissues has been addressed in relatively few publications, and results have been variable. 6,7 The purpose of this study was to determine whether concentrations of copper (Cu). iron (Fe), and zinc (Zn) in fresh or frozen (fresh) bovine liver differ from concentrations found in formalin-fixed liver or formalin-fixed and paraffin-embedded liver on an as-received (wet-weight) basis.
Sample sets that consisted of 3 liver samples were collected and analyzed from 12 cows that were submitted for routine necropsy to the Pathology Service of the College of Veterinary Medicine at Cornell University. One sample from each of the 12 cows included in this study was stored fresh or frozen at −40°C until analyzed. One sample from each set was stored in 10% neutral-buffered formalin, and 1 sample was formalin fixed, processed routinely, and embedded in paraffin. Liver samples were removed from the wax block before analysis.
Liver samples were originally part of a retrospective study to determine the cause of arterial rupture in Holstein cattle. All samples were collected in 2005 or 2006, and analyzed within 2 years of collection. Four of these sample sets were from Holstein cows diagnosed with vascular rupture. The other 8 sample sets were from a control group of cattle, with various case histories (including pneumonia and enteritis), submitted for necropsy.
Samples of fresh or frozen, drained, formalin-fixed, and embedded liver removed from paraffin blocks, apparently by cutting, usually arrived at the laboratory in whirl-pack bags. Fresh or frozen samples were kept fresh or frozen until processing. Samples were processed as-received by using a modified Association of Official Agricultural Chemists (AOAC) official method of analysis 985.01. 1 The weight of the samples varied widely, depending on how much sample was available. Because of our expectation of low concentrations of the minerals, the sample weight was typically in the range of 2 to 4 g; the sample was placed into dried and weighed 30-ml glass Pyrex beakers (Pyrex No. 1000) and accurately weighed to 0.0001 g (0.1 mg). Samples were dried for 2 hr in a convection air oven at 125°C, then transferred into a muffle furnace preheated to 500°C and heated at that temperature to constant weight (∼4 hr). After cooling, 3–4 Hengar Carborundum no. 12 Granules a were added to each beaker to aid boiling. To dissolve the minerals, 20 ml of acid mixture (25 ml concentrated trace mineral grade nitric acid b plus 25 ml concentrated trace mineral grade hydrochloric acid c plus 50 ml deionized water) were added to each sample. Beakers were covered with watch glasses. The samples were brought to a gentle boil on a hot plate and then boiled for 20 min. The digests were allowed to cool and then were transferred quantitatively to volumetric flasks with deionized water. The digests were diluted to 100 ml final volume with deionized water. In some cases, the amount of liver sample available was as small as 100 mg; in such cases, the sample was taken to a final volume of 10 ml to increase the analyte concentration. When the final volume of 10 ml was used, the amount of acid mixture used for dissolving the ashed sample was reduced proportionately. Resulting solutions were 5% nitric acid (V/V) and 5% hydrochloric acid (V/V). After mixing, some of each sample was then poured into 15-ml centrifuge tubes and centrifuged at ∼1,000 × g for 10 min before inductively coupled argon plasma analysis (ICAP). d Calibration was checked after every 10 test solutions. If the instrument had drifted out of calibration (>3% of original values), it was recalibrated. The lines (wavelengths) used to measure Cu, Fe, and Zn were 324.7 nm, 259.9 nm, and 213.8 nm, respectively. Because of the low wavelength, Zn was measured in a vacuum optic to exclude air from the optical path.
Determination of Cu, Fe, and Zn was made by using ICAP. The modified AOAC Method 985.01 was validated for use on animal tissues (liver) by testing the National Institute of Standards and Technology (NIST) Standard Reference Material (SRM) 1577b Bovine Liver. This SRM was also used to determine accuracy and precision. A mixed standard solution made from high-purity raw materials certified traceable to NIST SRM in 5% nitric acid e had concentrations of Cu, Fe, and Zn of 200 ppm for each mineral. This solution was further diluted to obtain 4 working standard solutions with concentrations of 0 ppm. 2 ppm, 10 ppm, and 20 ppm for each mineral. The acid concentration of the final dilution of these working standards was 5% nitric acid (V/V), 5% hydrochloric acid (V/V). Because other types of samples were being tested, the concentration range of the working standard solutions purposefully was wide to include other higher concentrations. The resulting mineral concentrations were calculated on an as-received basis. The coefficients of variation for each mineral on a standard reference liver sample (NIST. SRM 1577b Bovine Liver, certified values: Cu 160 ppm, Fe 184 ppm, Zn 127 ppm) were: Cu, 7.8% at 135.5 ppm; Fe. 7.7% at 178.7 ppm; and Zn, 7.6% at 126.8 ppm.
Five samples of 10% neutral buffered formalin were collected in trace-mineral Vacutainers, 1 from a decanter in the necropsy laboratory and 4 from jars of formalin and animal tissue that had been collected 1 to 45 days previously. These 5 samples were used to determine whether formalin was contaminated with trace minerals or whether trace minerals leached from tissues. Samples of deionized water; 70%, 80%, 95%, and 100% ethanol; Propar; xylene; and paraffin recovered from the tissue processing-and-embedding instrument f were collected in clean plastic containers to rule out mineral contamination associated with the embedding process. A known aliquot of each of these materials was evaporated to dryness, and the resulting residue was dissolved in nitric acid and hydrochloric acid. These solutions were then tested by ICAP atomic-emission spectroscopy, as described previously.
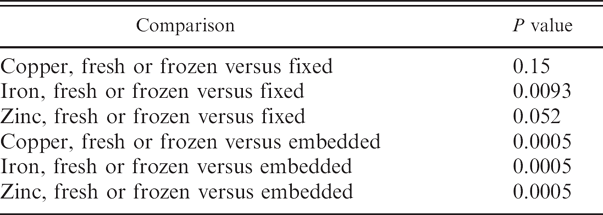
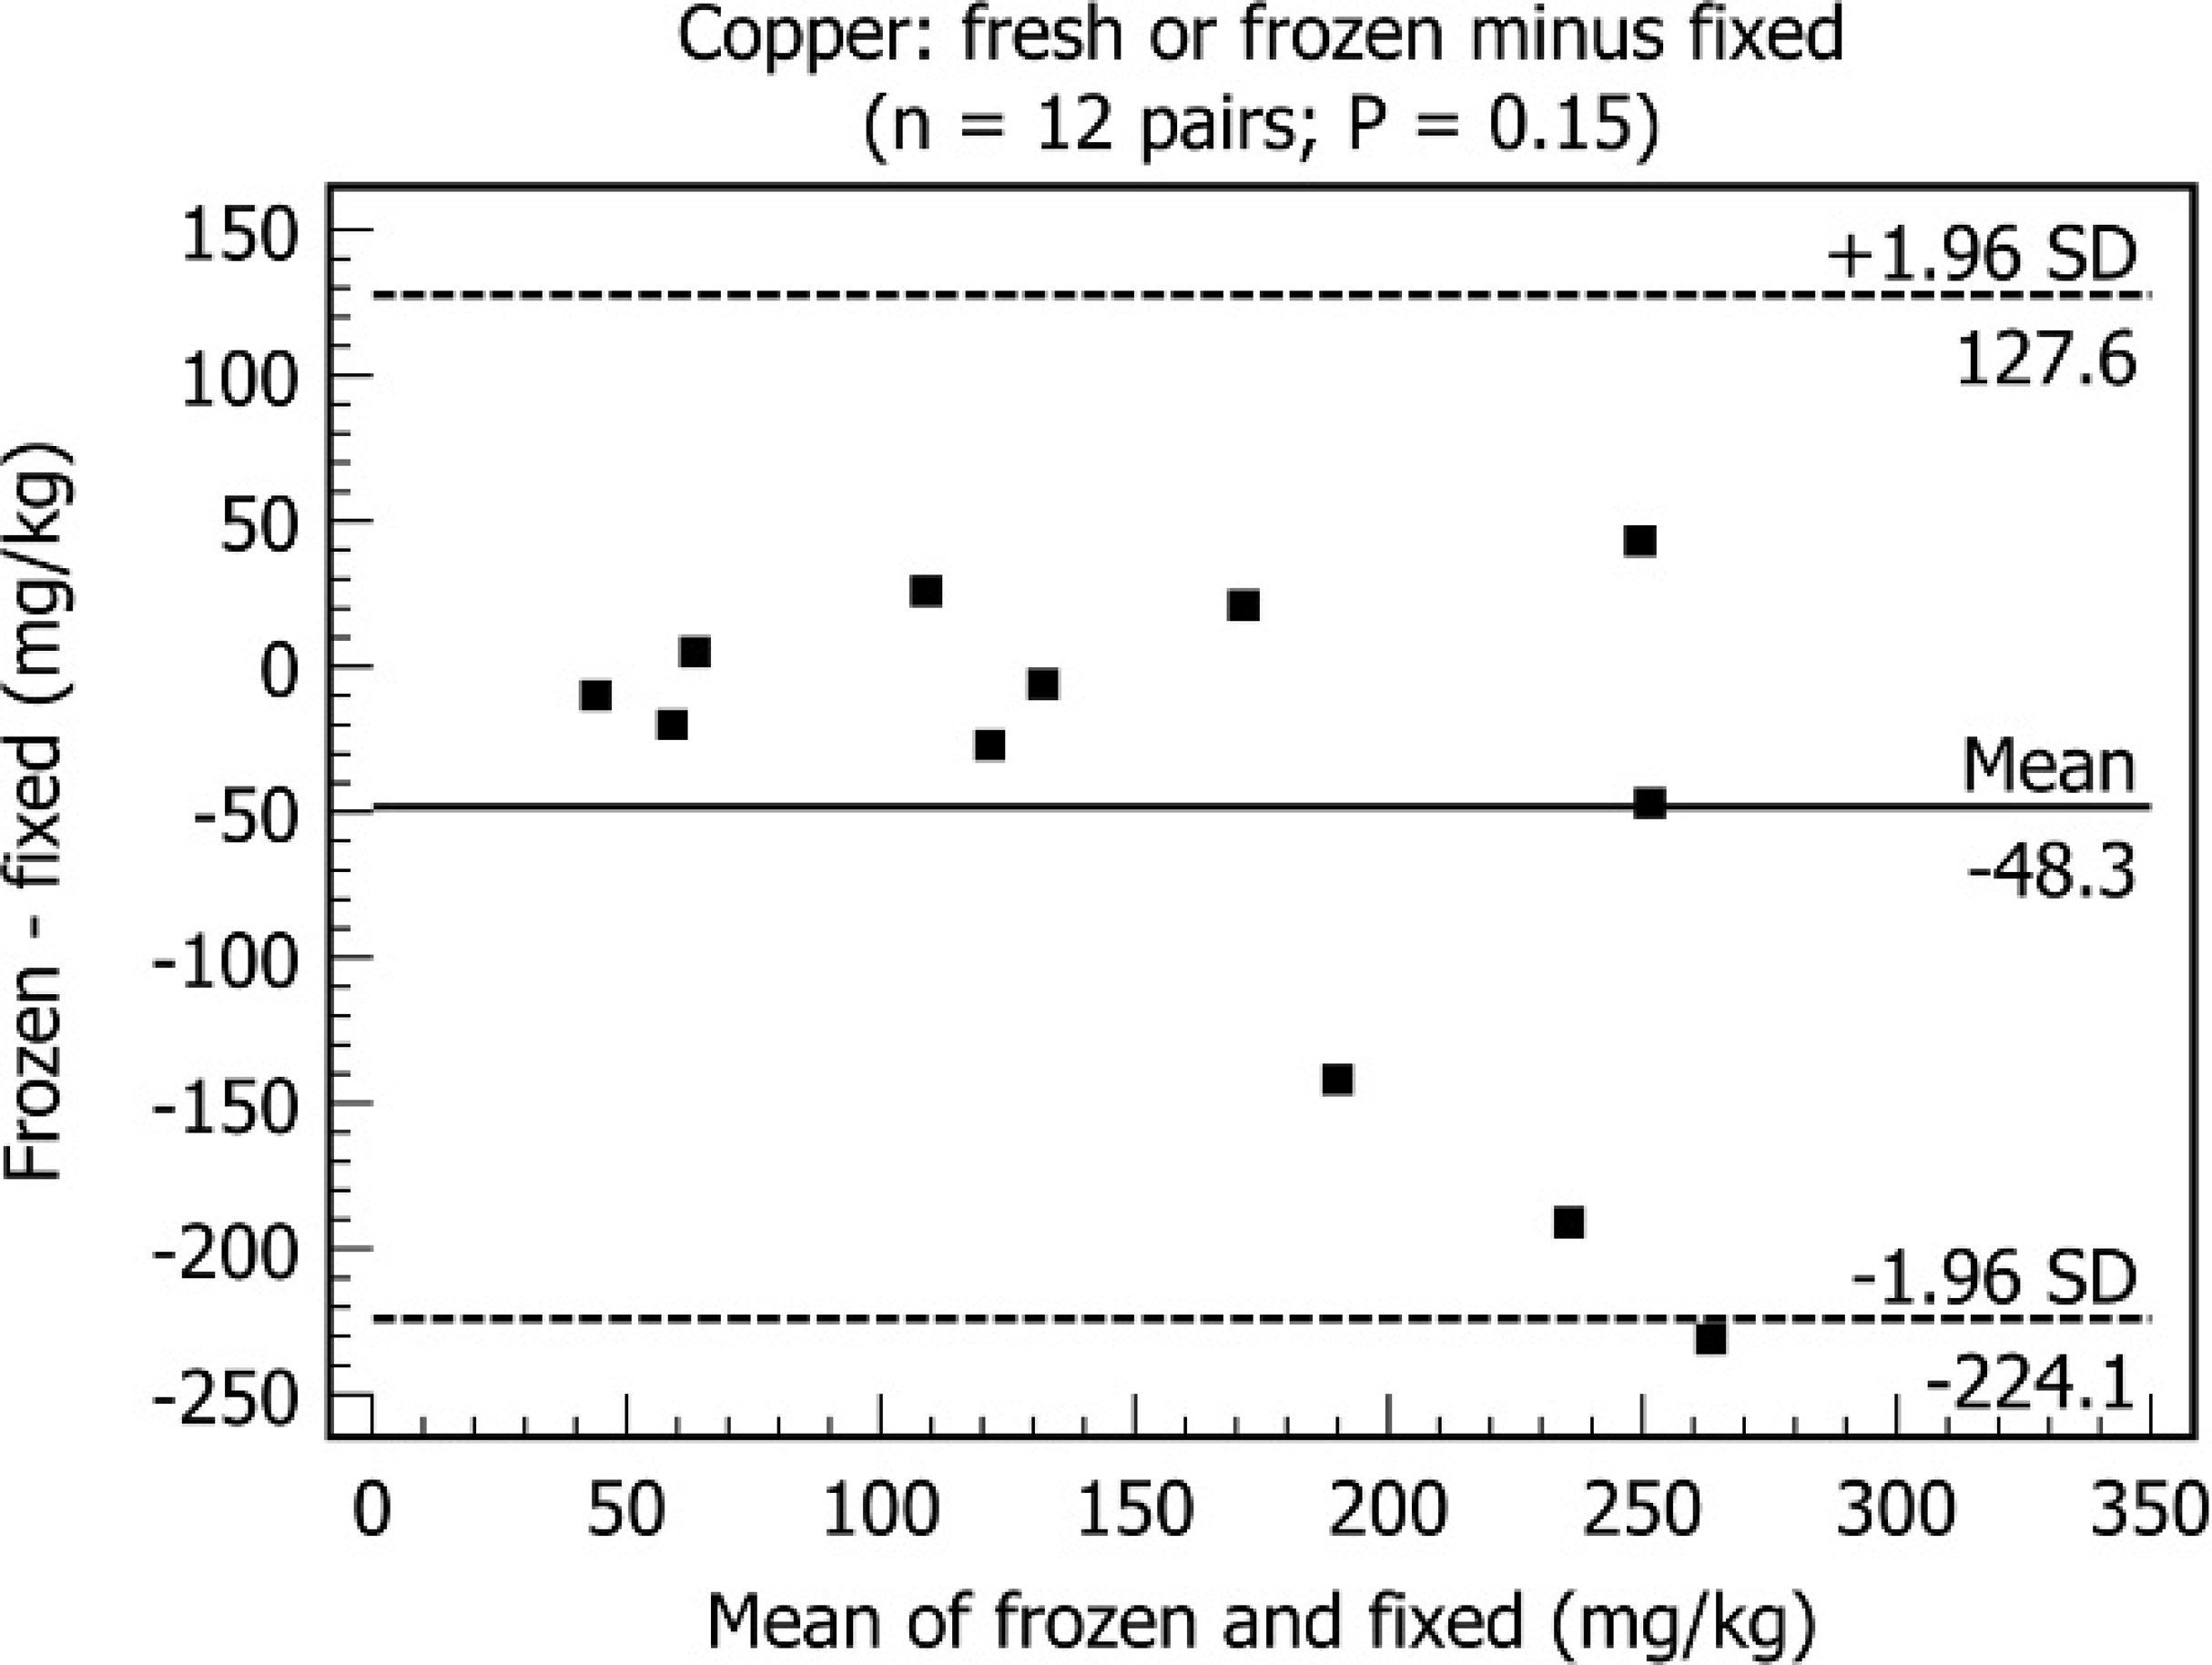
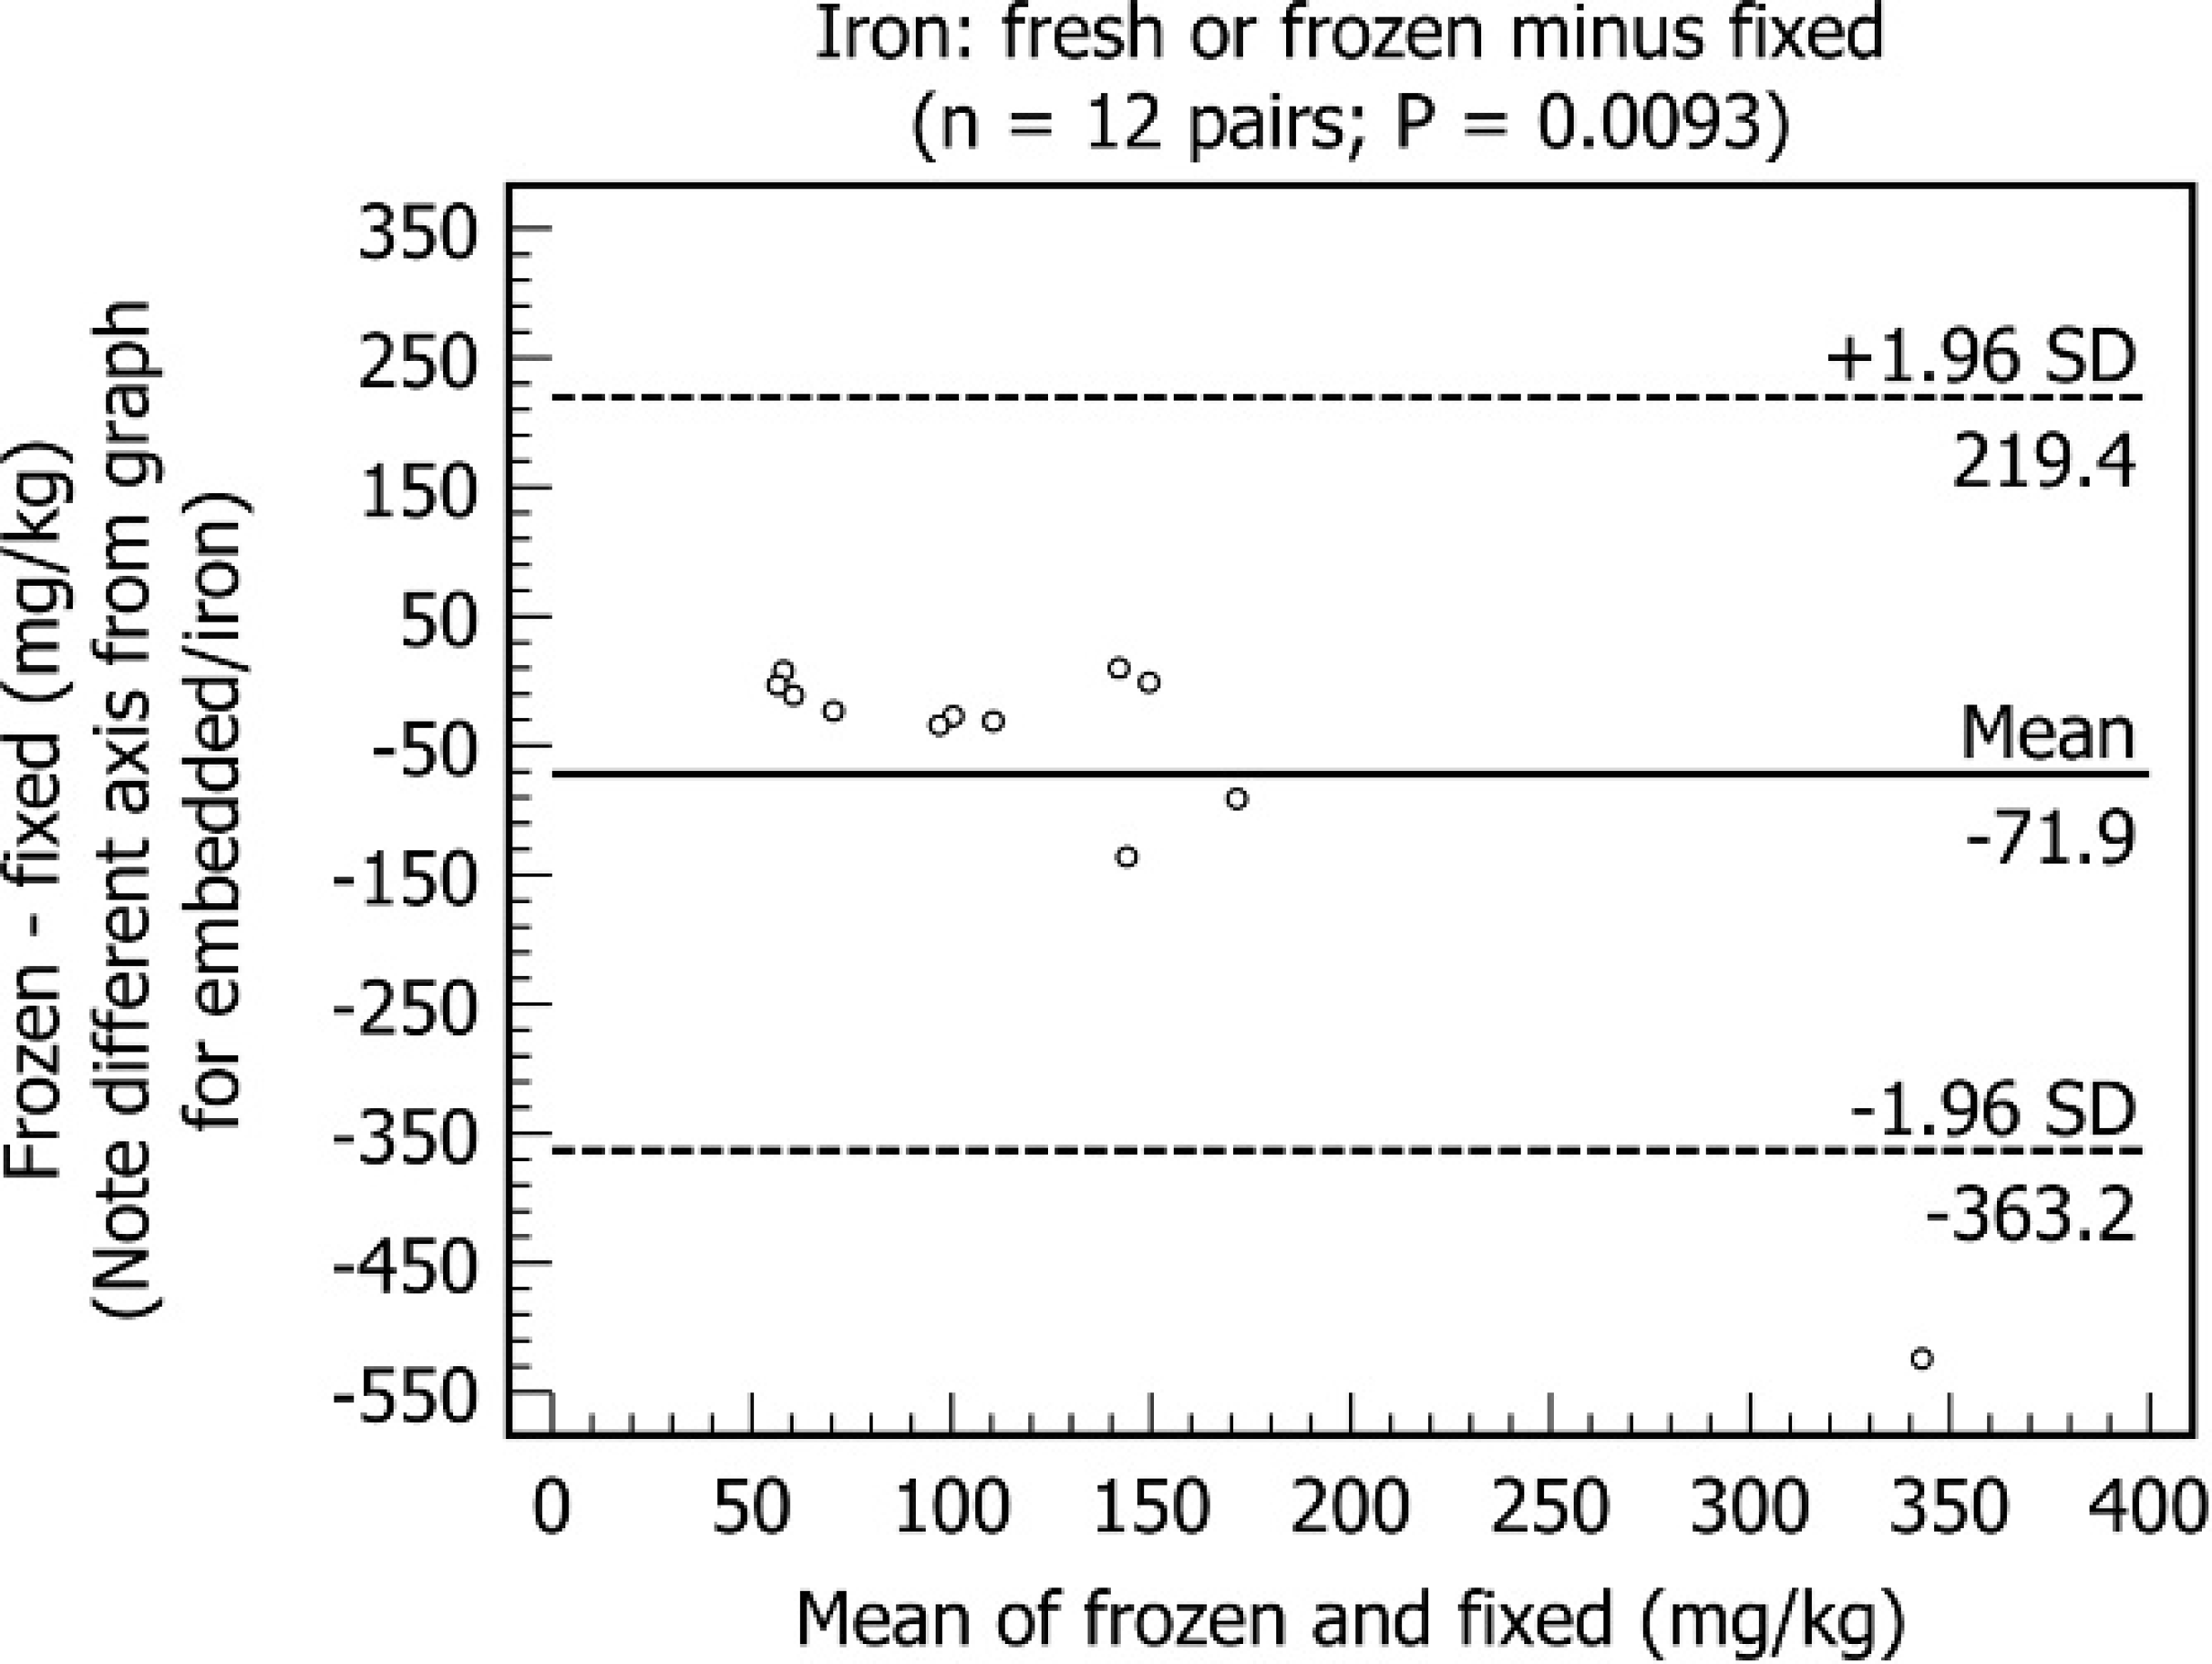
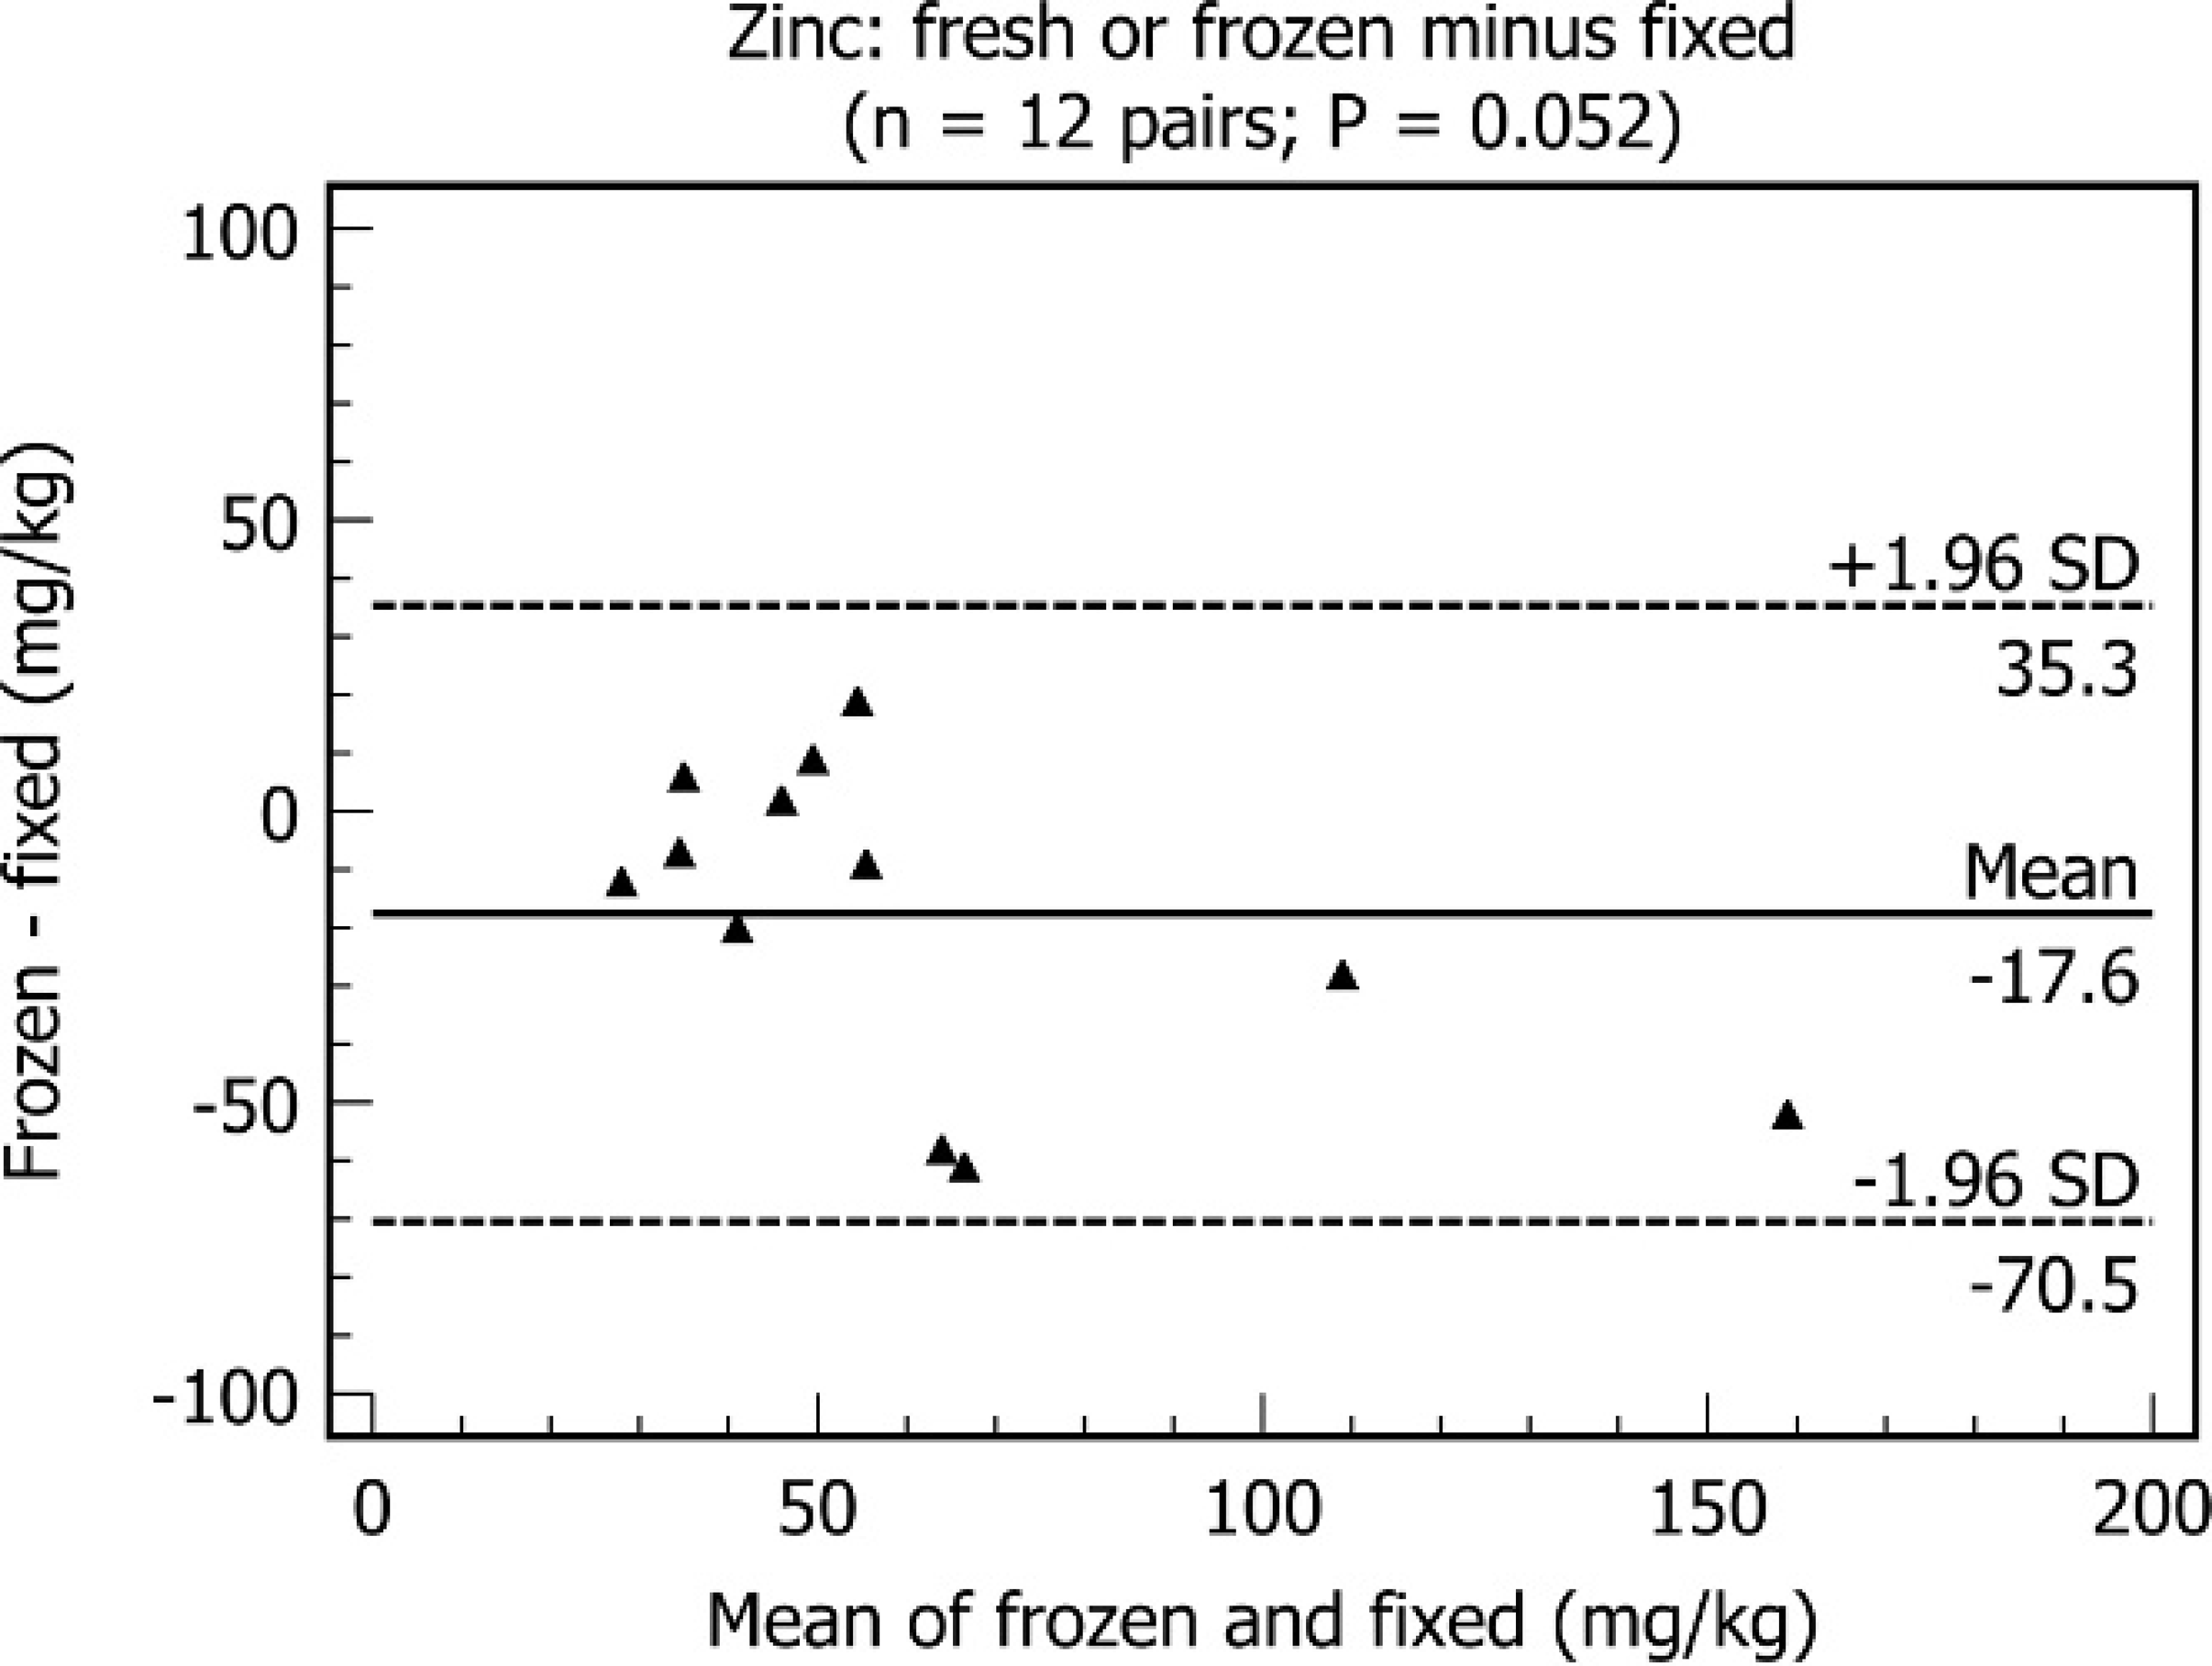
Two-sided P values for copper, iron, and zinc liver sample preparation comparisons (12 cows; Wilcoxon signed rank tests).
Liver samples were used from only 12 cows, and some data were skewed (e.g., the Shapiro-Wilk test for Fe in the fixed preparation had P < 0.0001, indicating a strongly non-Gaussian distribution); therefore, nonparametric methods were used. (This is valid even for Gaussian data and allowed all the data to be analyzed using the same statistical method.) Because the fresh or frozen sample was considered to be the “standard,” 6 Wilcoxon signed rank tests were used to compare fresh or frozen versus fixed and fresh or frozen versus paraffin-embedded Cu, Fe, and Zn liver concentrations. (Testing with a form of analysis of variance would have given power away to unwanted comparisons.) All tests were 2-sided, and statistical significance was declared for P ≤ 0.017; the threshold P values were lowered by the Bonferroni method (0.05/3 = 0.017) because of the multiple comparisons. 8 P values are listed in Table 1. The differences were displayed in Bland-Altman graphs, which plot the mean value for each pair of sample results (X-axis) against the within-pair difference (Y-axis). 3 In a Bland-Altman graph, highly repeatable data will lie close to a horizontal line that intercepts the Y-axis at zero. If there instead is a systematic bias between methods, but the bias is consistent across the ranges of observed values, then the differences will lie around a horizontal line that intercepts the Y-axis at a value that indicates the “mean bias.” In the first but not the second case, a nonsignificant Wilcoxon signed rank test would be expected. All analyses and graphs were done by using a commercial software package. 8
The mathematical differences between Cu, Fe, and Zn in fresh or frozen and formalin-fixed liver samples are presented in Figs. 1, 2, and 3, respectively. There was no significant difference between fresh or frozen and formalin-fixed liver Cu and Zn concentrations (Table 1). The differences between fresh or frozen and formalin-fixed liver Fe concentrations were significant (Table 1) but were not predictably higher or lower after fixation (Fig. 2). There is nothing in the study records to suggest a “mistake” or other explanation leading to the very high fixed-sample Fe measurement (605 mg/kg) that resulted in the data point in the bottom right of the graph (Fig. 2). This provided a warning of the drastic changes (in Fe measurement) that fixation might create. The mathematical differences between Cu, Fe, and Zn in fresh or frozen and paraffin-embedded liver samples are presented in Figs. 4, 5, and 6, respectively. In each instance, concentration was lower in the fresh or frozen sample than in the paraffin-embedded sample (Table 1).
Bland-Altman graph comparing fresh or frozen minus fixed liver copper concentrations.
That there was no significant difference in Cu and Zn concentrations in fresh or frozen versus formalin-fixed tissue is similar to the findings of a previous study that used fresh or frozen and fixed bovine and canine liver (Braselton WE. Slanker MR, Stuart KJ, et. al: 1997, Comparison of element concentrations determined in fresh, formalin-fixed, and paraffin-embedded tissue samples. In: Proceedings of the American Association of Veterinary Laboratory Diagnosticians 40th Annual Conference, Louisville, KY). However, the present study found significant differences in Fe concentrations in fresh or frozen versus formalin-fixed bovine liver. Another study found no change in Cu or Fe concentrations in bovine liver samples after storage in formalin for 22 days, 6 weeks, and 6 months, although Zn concentrations were significantly lower after 6 months of storage. 7
Bland-Altman graph comparing fresh or frozen minus embedded liver iron concentrations.
Bland-Altman graph comparing fresh or frozen minus fixed liver zinc concentrations.
Reporting mineral results on a dry-matter basis, rather than an as-received basis, would have eliminated changes because of fluid loss or imbibition during fixation. A study investigating trace mineral concentrations in caprine livers found a progressive decrease in hepatic Cu concentrations of liver samples stored in formalin. The decrease corresponded to increased sample weight. Sample weight increased 14% after 1 week in formalin and Cu decreased 9%. After 2 weeks, sample weight increased 18% and Cu concentration declined 19%. It was theorized that the increased tissue weight was because of fluid imbibition during fixation; however, the study of bovine liver found no significant difference in the moisture content of formalin-fixed liver stored for 2 years. 7 There was no evidence that the formalin was contaminated with Cu, Fe, or Zn, and leaching of minerals into the formalin during fixation was not evident or was minimal. All samples of formalin contained < 1 mg/liter Cu and Zn. One formalin sample from a tissue jar contained 1.4 mg/liters Fe (the authors speculate that this was because of blood that had exuded from the tissues based on discoloration of the formalin), but Fe concentrations were <1 mg/liters in the 4 remaining samples.
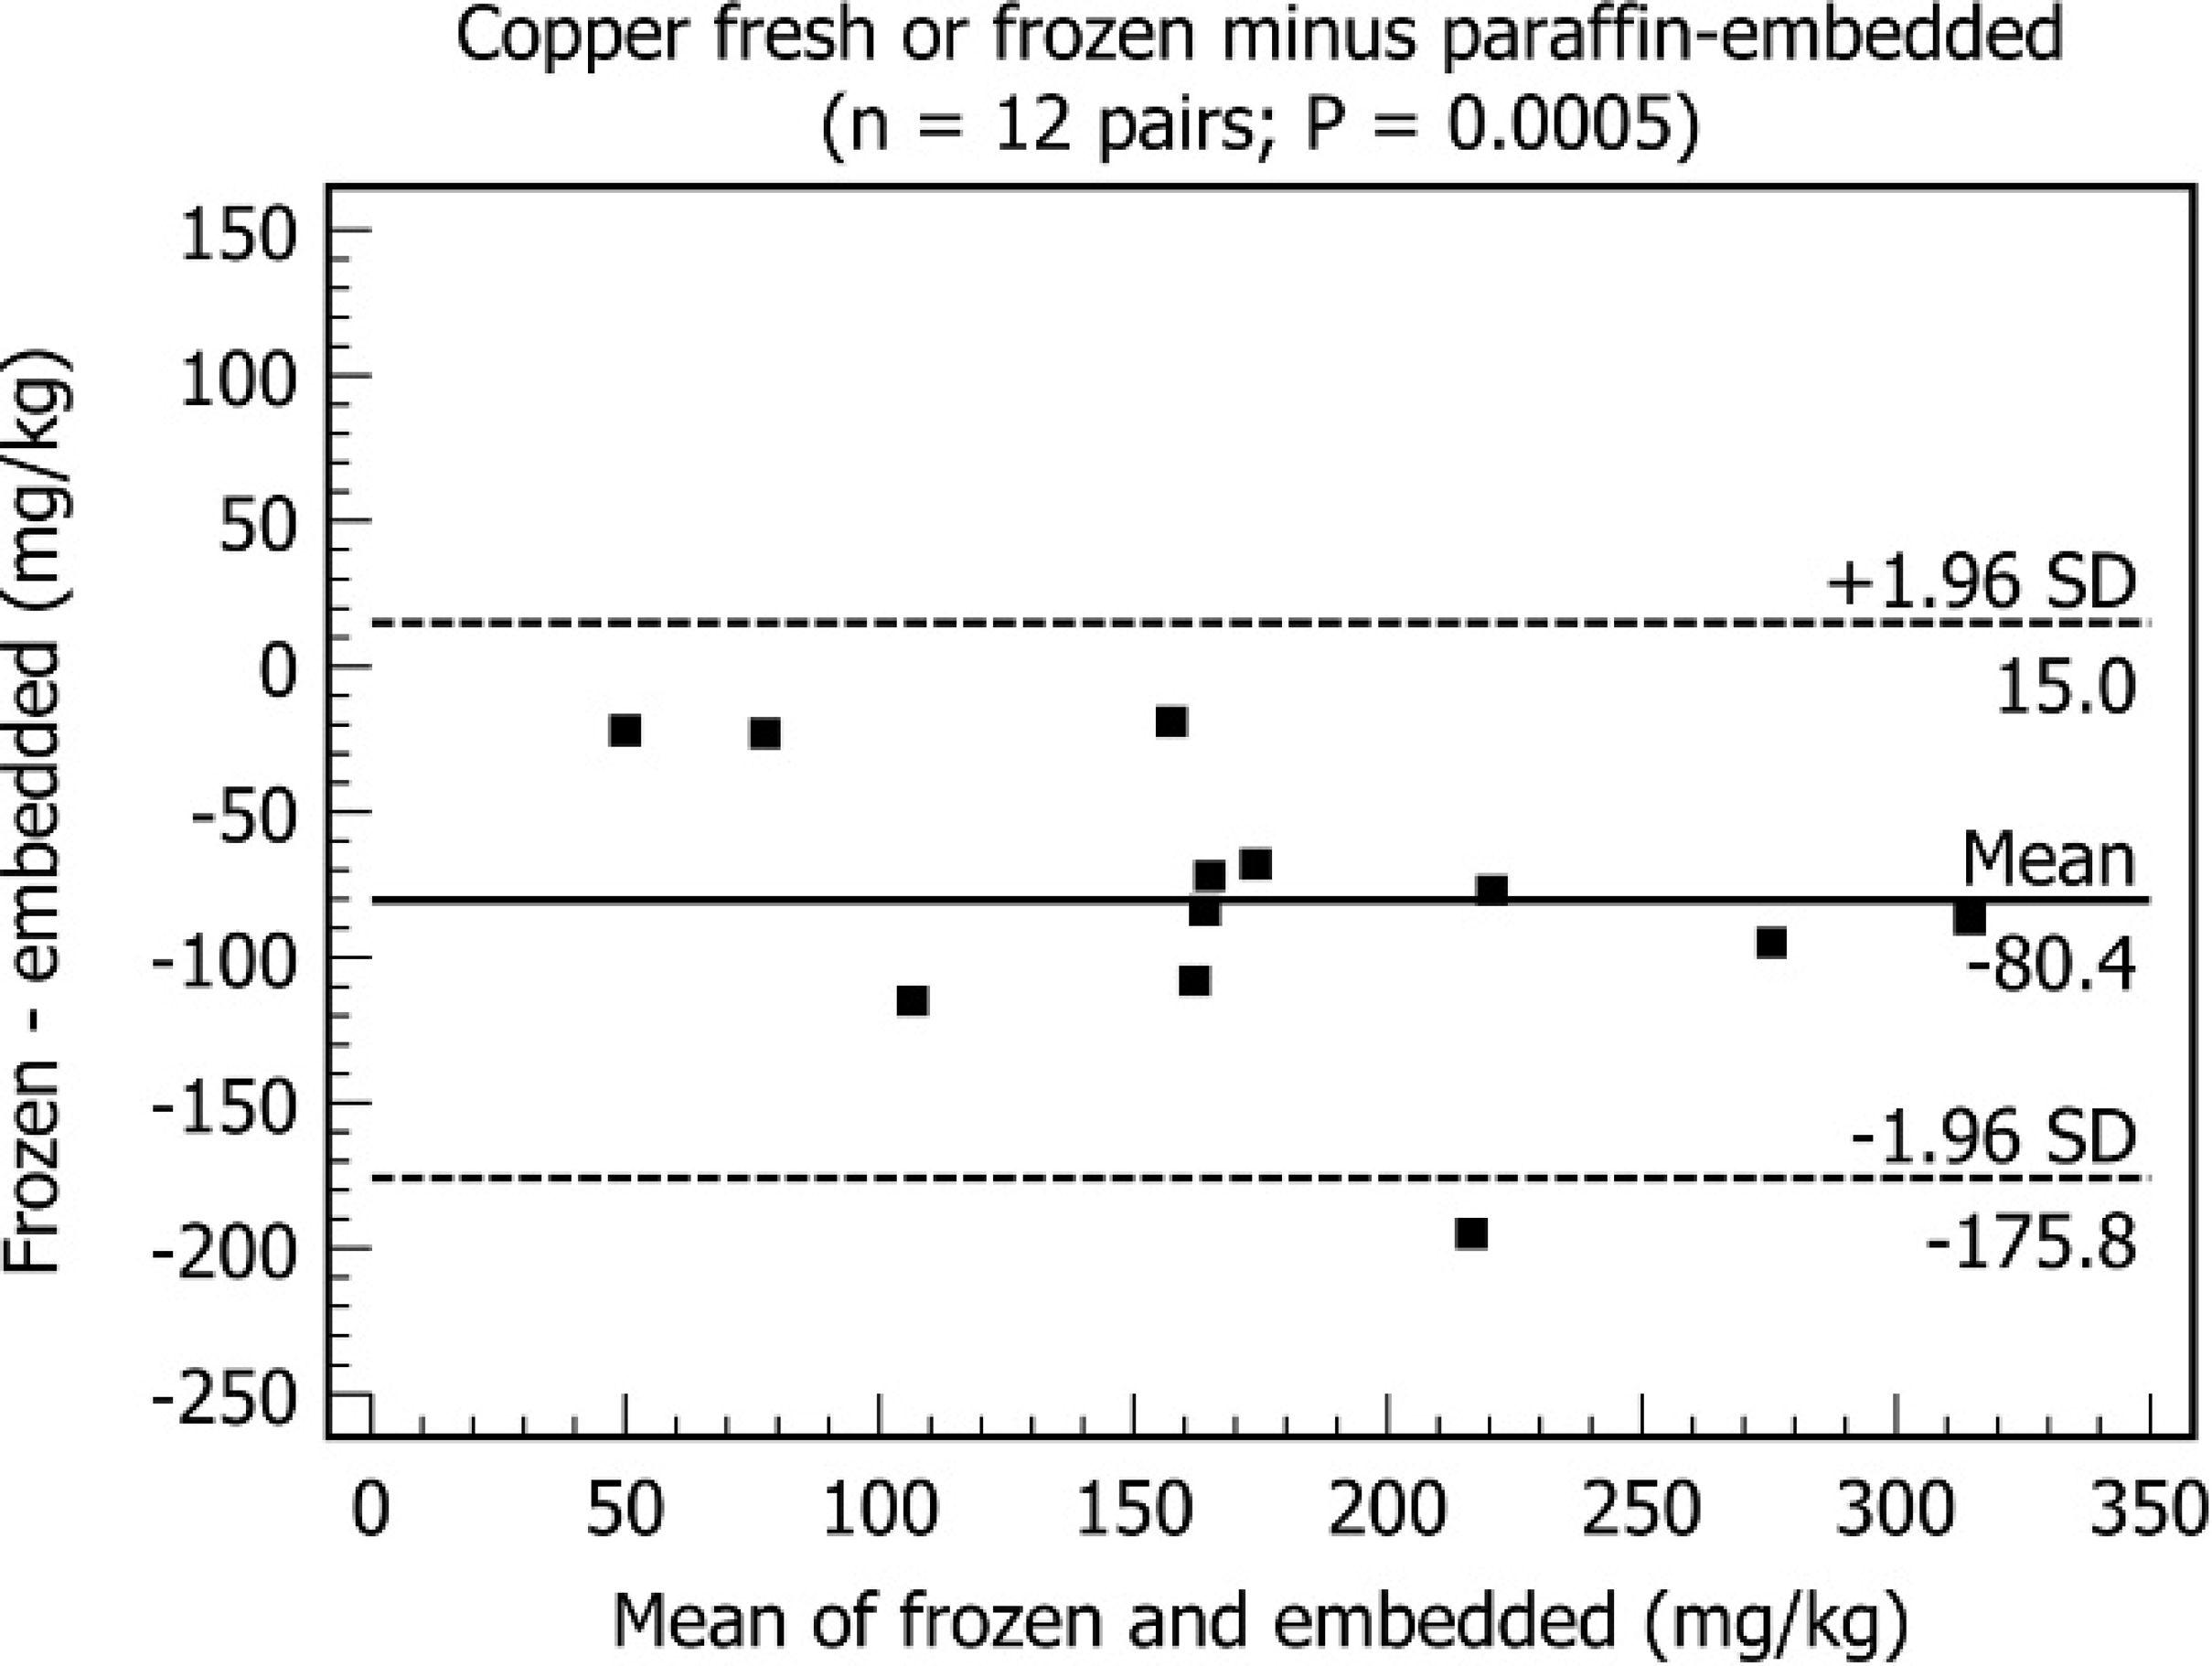
Bland-Altman graph comparing fresh or frozen minus embedded liver copper concentrations.
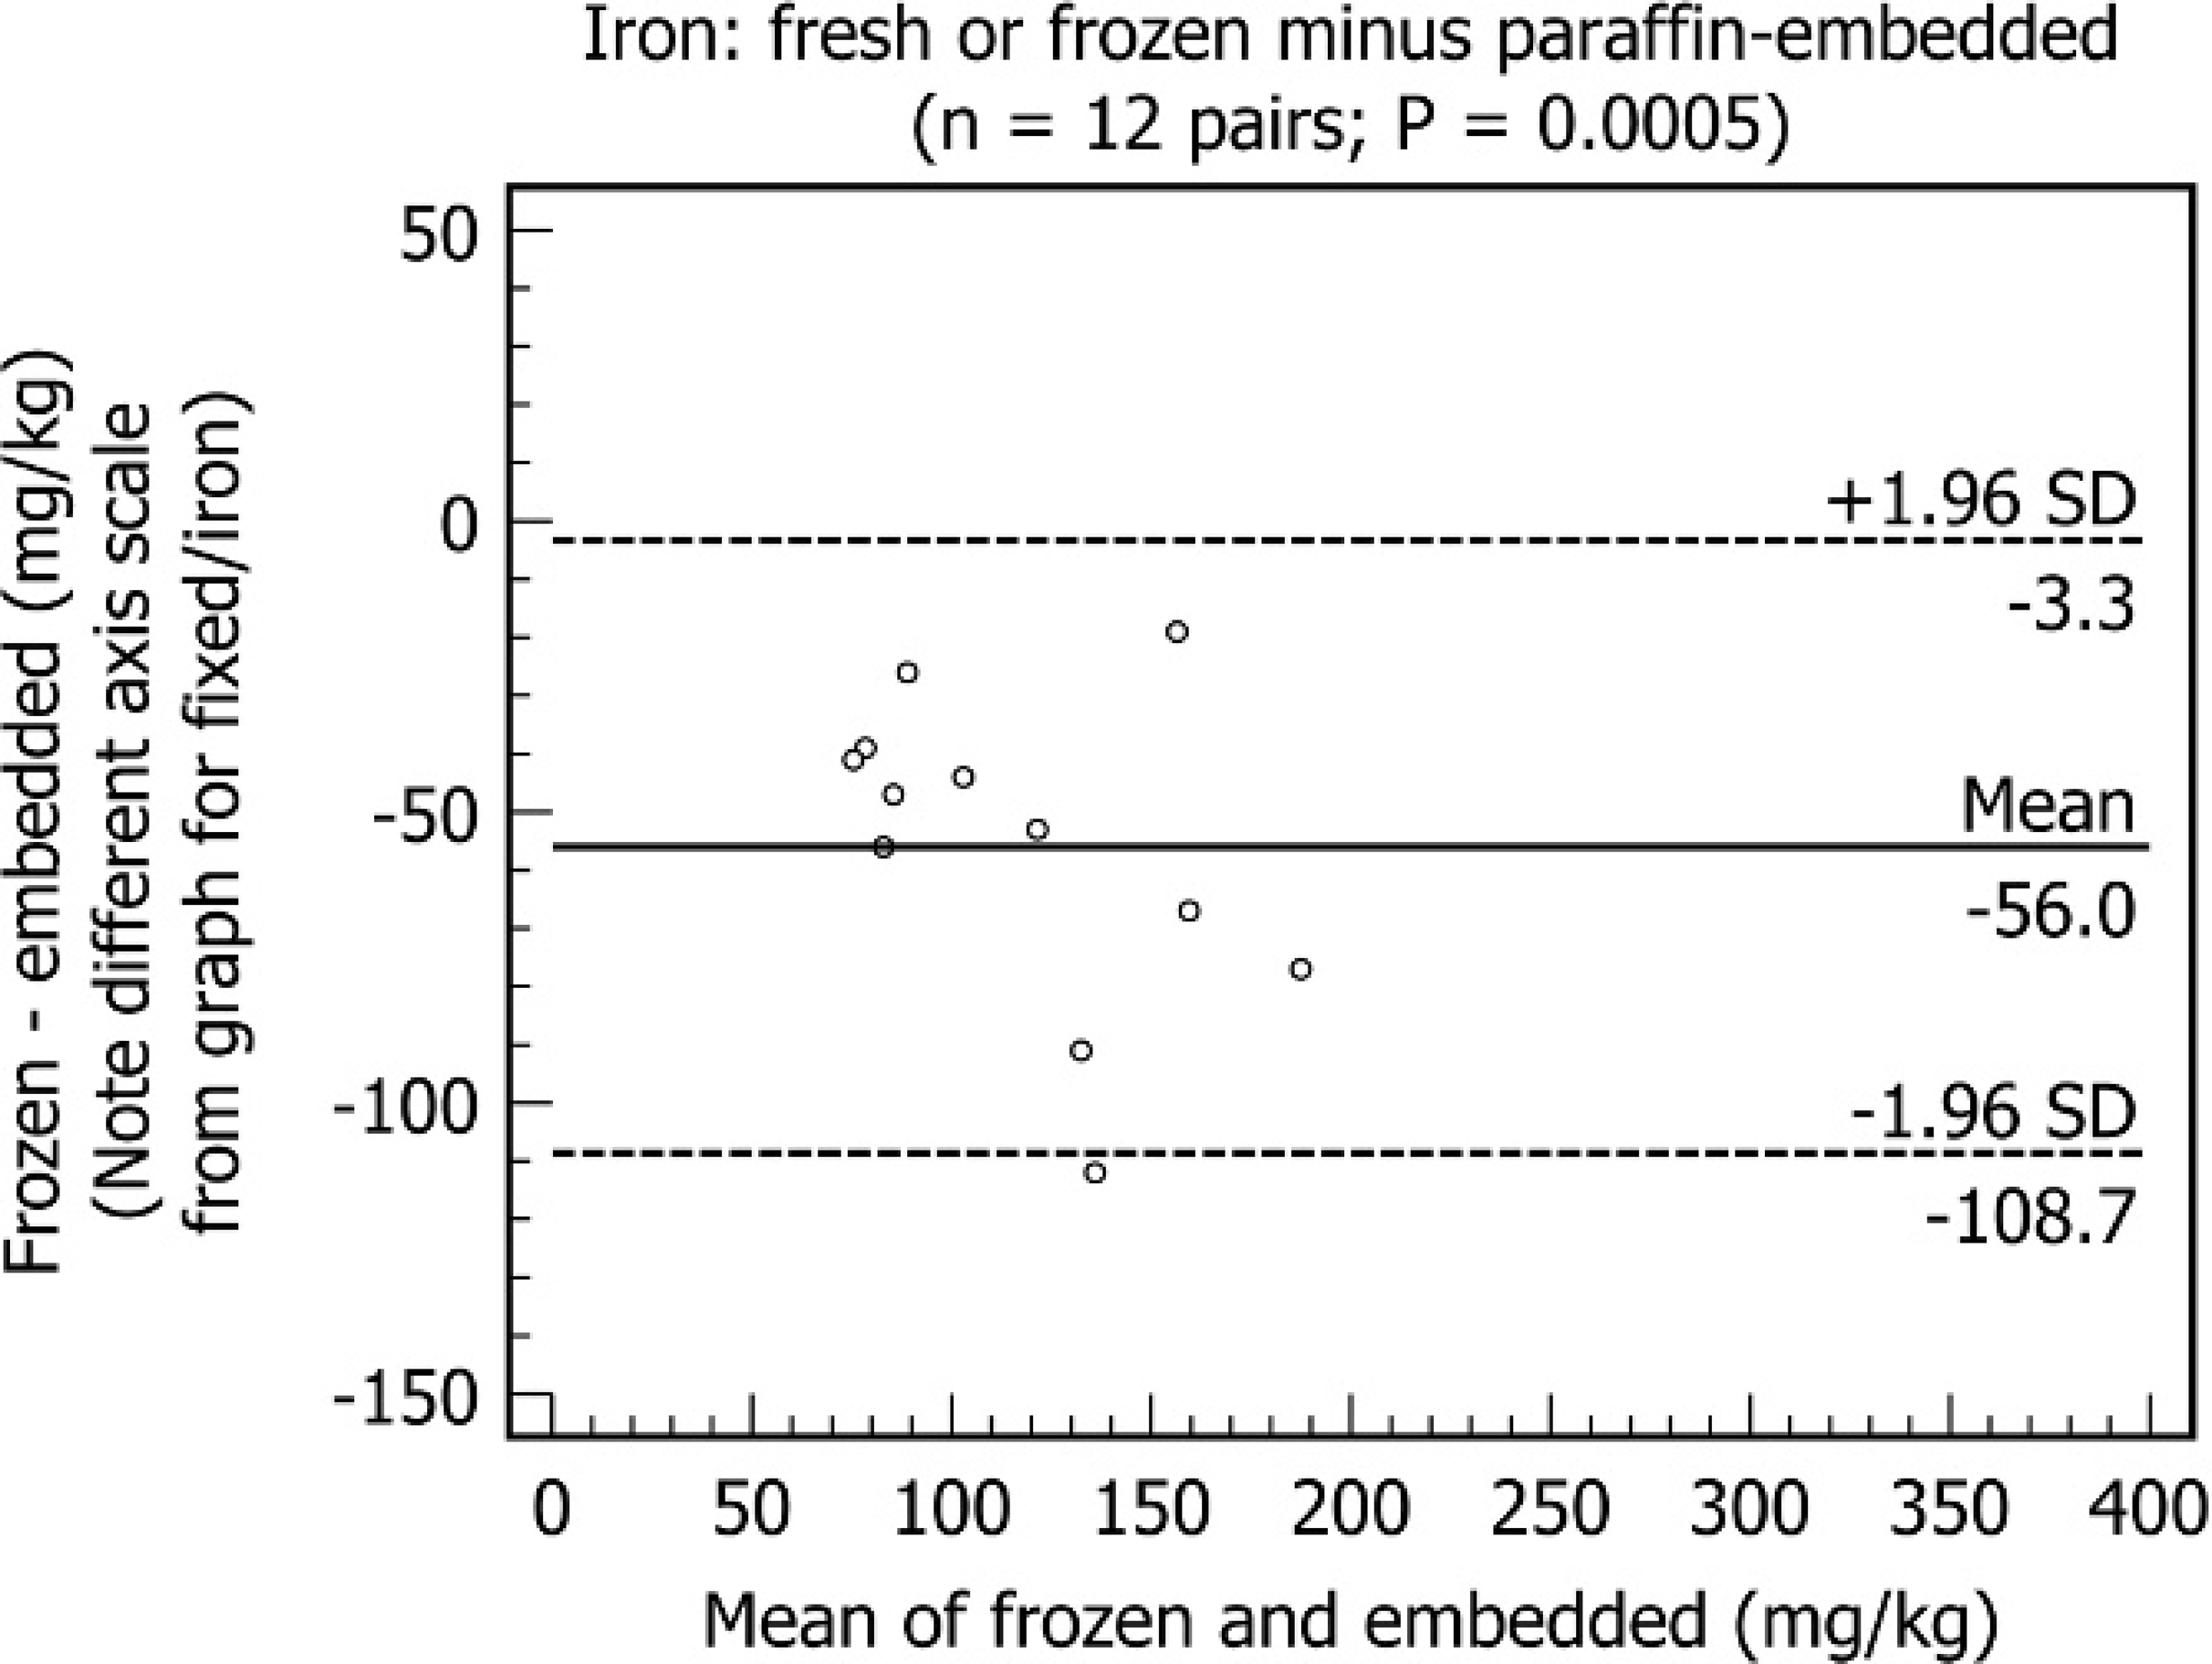
Bland-Altman graph comparing fresh or frozen minus fixed liver iron concentrations. Note different axis scale from Figure 2.
The consistent increase in measured Cu, Fe, and Zn concentrations in paraffin-embedded tissues was striking, variable, and difficult to explain. The variability (the “vertical scatter” on the graphs; the wide prediction interval formed by the mean ± 1.96 SD) seems large. It is so large that the authors hesitate at this point to suggest a simple “correction factor” to use to calculate the equivalent fresh or frozen value for any sample from its fixed or paraffin-embedded sample.
Differences were greater than could be expected because of variability in the testing method or replacement of water by paraffin. 2 (Paraffin has a lower density than water. 0.90 mg/cm3 and 1.00 mg/cm3, respectively. 4 Most soft tissues from mature mammals contain 75%-80% water; if an equal volume of paraffin replaces the water, the weight of the sample would be expected to decrease by only 7.5%-8.0%, with a corresponding increase in magnitude of the concentration by weight of trace minerals.) There was no evidence of mineral contamination of fluids in the embedding machine to account for the fluctuation in liver metal concentrations with paraffin embedding; all samples from the processor contained <1 mg/liter of Cu, Fe, and Zn.
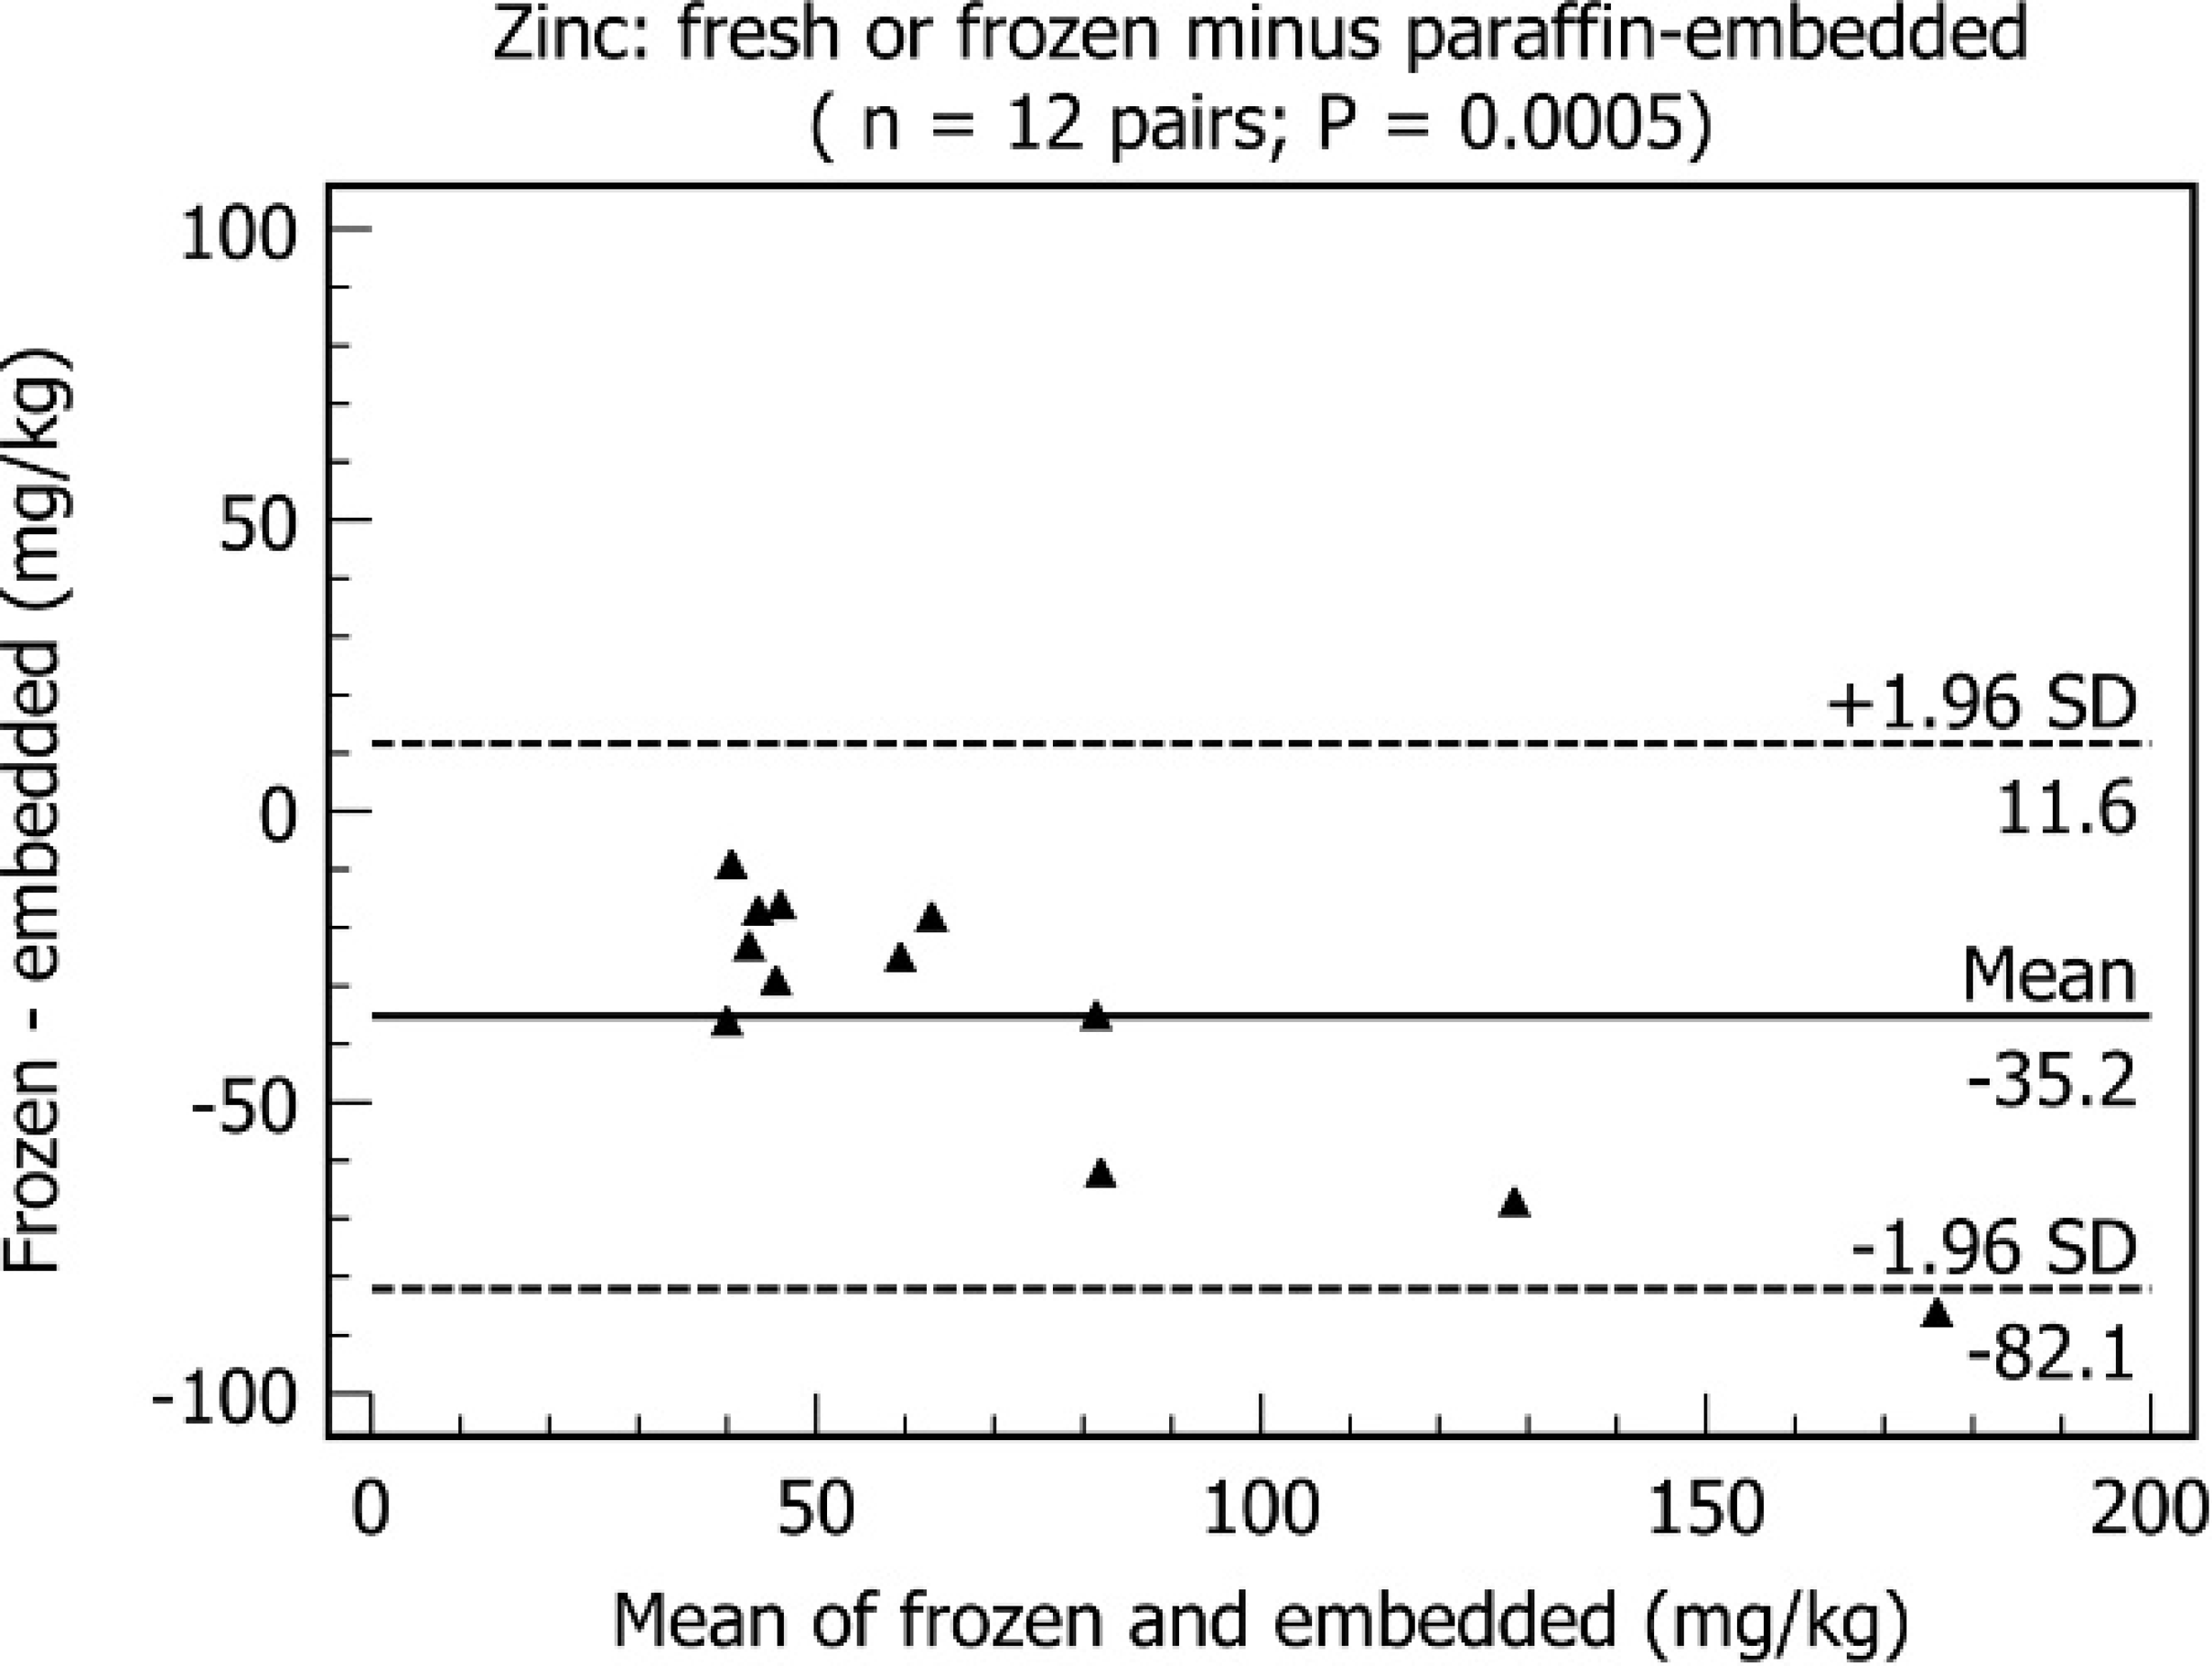
Bland-Altman graph comparing fresh or frozen minus embedded liver zinc concentrations.
The finding of consistently increased Cu, Fe, and Zn in paraffin-embedded samples in this study is in agreement with the study of bovine and canine liver samples noted above. Unlike the current study, the canine and bovine liver study attempted to remove paraffin by “soaking in 100% ethanol and drying to a constant weight.”
A reference range given for Cu and Zn in bovine liver is 25–100 mg/kg wet-weight for both elements. 5 Cu liver concentrations in this study would have been classified differently (either within or outside of the reference range) in 1 case, depending on whether it was submitted either fresh or frozen or formalin fixed (1/12 [8%]), thus, use of this Cu reference range was appropriate in most instances. The Zn liver concentration would have been erroneously classified in 2 cases (2/12 [17%]). The range given for liver Fe is relatively broad: 45–300 ppm, wet-weight. 5 All samples analyzed for Fe fell within this range, regardless of the tissue-preparation method.
The Cu, Fe, and Zn concentrations in paraffin-embedded samples consistently measured higher than concentrations in fresh liver samples. Differences in measured trace mineral concentrations affected the interpretation of the results in a few cases (1/12 or 8% for Cu, 0/12 or 0% for Fe. and 3/12 or 25% for Zn).
Fresh or frozen tissue, when available, is always preferred for mineral analysis over tissue that has been processed by formalin fixation, with or without paraffin embedding. When fresh or frozen tissue is not available for analysis, Cu, Fe, and Zn concentrations attained from processed tissue are useful in most cases but must be evaluated with caution.
Footnotes
a.
Hengar Carborundum no. 12 Granules, Hengar Co., Philadelphia, PA.
b.
Trace mineral grade nitric acid, EMD Chemicals, Inc., Gibbstown, NJ.
c.
Trace mineral grade hydrochloric acid, EMD Chemicals, Inc., Gibbstown, NJ.
d.
Spectroflame ICP, Spectro Analytical Instruments, Inc., Marlborough, MA.
e.
Nitric acid, Ricca Chemical Co., Arlington, TX.
f.
Tissue Teck VIP E300 Model 4894, Sakura Finetek USA, Inc., Torrence, CA.
g.
MedCalc 9.3.2.0, 2007, F Schoonjans, Belgium.