
Abstract
For reported primer sets used to detect influenza A viruses (IAVs), we verified the nucleotide identities with 9,103 complete sequences of matrix (M) genes. At best, only 93.2% and 85.3% of the sequences had a 100% match with reported forward and reverse primers, respectively. Therefore, we designed new degenerate forward and reverse primers with 100% identity to 94.4% and 96.2% of compared genes, respectively, and the primer set was used with SYBR-based reverse-transcription real-time PCR (SYBR-RT-rtPCR) for lower detection limits. The sensitivity of SYBR-RT-rtPCR with the new primers was 10-fold higher than that with a conventional method in ~2.37% of all M genes in the database used in our study. We successfully increased the sensitivity of SYBR-RT-rtPCR by concentrating the viral ribonucleoprotein (RNP) using immunomagnetic beads and Triton X-100. The improved generic primer set and RNP concentration method may be useful for sensitive detection of IAVs.
Introduction
Influenza A viruses (IAVs, family Orthomyxoviridae) are enveloped, segmented, single-stranded, negative-sense RNA viruses that can be divided into types A–D. Avian IAVs (AIVs) are further divided into 16 hemagglutinin (HA) and 9 neuraminidase (NA) subtypes. Wild aquatic birds serve as reservoirs of all known subtypes, and direct transmission from birds to humans has necessitated monitoring of AIVs among wild and domestic birds, and environmental samples.2,9,34 Virus isolation using embryonated chicken eggs (ECEs) and Madin–Darby canine kidney (MDCK) cells has been the gold standard for monitoring avian and mammalian IAVs; however, these methods are time consuming and require special facilities to control biohazards. Reverse-transcription PCR (RT-PCR), nucleic acid sequence–based amplification, and real-time RT-PCR (RT-rtPCR) have been developed as alternative methods for the detection of IAVs.5,7,8,15,25,28,30,33 Although matrix (M) genes are often targets in molecular tests because of their conservation among IAVs, the matching rate of reported primer sets with M genes has not been evaluated extensively. A mismatch between primer and template may decrease the sensitivity of molecular detection.
AIVs are shed in saliva, nasal secretions, and feces of infected birds. Among these samples, feces are easily collected. Wild birds and domestic ducks infected by highly pathogenic AIVs and chickens infected by weakly pathogenic AIVs may release virus particles into feces without any clinical manifestations.14,35 During the early and convalescent periods of infection, the titers of shed virions are relatively low, and pooling of samples to reduce testing numbers may further dilute virions. 27 Therefore, increasing the detection efficiency in a small amount of specimen is crucial for fast and accurate molecular detection. Although various concentration methods have been reported, these methods cannot be applied for rapid molecular detection because of the requirement for ultracentrifugation or multiple steps and low purification efficiency.1,11,12 In 2011, a simple method to purify virions using anti-nucleoprotein (NP) antibody-bound magnetic beads was developed, and the purified virions could be used directly for RT-rtPCR without RNA extraction. 4
We compared genetic matching rates of previously reported primers with corresponding nucleotide sequences in the GISAID database (http://www.gisaid.org). We developed a degenerate primer set that showed high nucleotide matching rates with diverse M genes in the database. We applied the improved primer set to SYBR Green–based RT-rtPCR (SYBR-RT-rtPCR), and compared this technique with the conventional method using TaqMan probe–based RT-rtPCR (TaqMan-RT-rtPCR) employing Spackman (SP) primers for detection of natural IAVs and A/Puerto Rico/8/1934 (PR8)-derived recombinant viruses with different mismatches to SP primers.25,28 In addition, we developed a viral ribonucleoprotein (RNP) concentration technique using anti-NP mouse monoclonal antibody (mAb), immunomagnetic beads, and Triton-X100.
Materials and methods
Virus, eggs, and cells
Various subtypes of IAV panels [recombinant A/Puerto Rico/8/1934 (H1N1; rPR8), A/Singapore/1/57 (H2N2), A/duck/Ukraine/1/63 (H3N8), A/duck/Czechoslovakia/56 (H4N6), A/duck/Hong Kong/820/80 (H5N3), A/shearwater/Australia/1/72 (H6N5), A/duck/Hong Kong/301/78 (H7N1), A/turkey/Ontario/6118/68 (H8N4), A/turkey/Wisconsin/1/66 (H9N2), A/Chicken/Germany/N49 (H10N7), A/duck/England/56 (H11N6), A/duck/Memphis/546/74 (H11N9), and A/duck/Alberta/60/76 (H12N5)], a vaccine strain of Newcastle disease virus (NDV; La Sota), and an infectious bronchitis virus (IBV; SNU-11045) were propagated in 10-d-old specific pathogen–free (SPF) ECEs (Charles River Lab, Wilmington, MA) by incubation for 3 d at 37°C. Field isolates of infectious bursal disease virus (IBDV; SNU16001) and reticuloendotheliosis virus (REV; SNU16008) detected by our laboratory were homogenized and kept at −70°C until use. Chicken embryo kidney (CEK) cells were cultured using Eagle minimum essential medium (MEM; Life Technologies, Carlsbad, CA) supplemented with 5% fetal bovine serum (FBS; Life Technologies). Human embryonic kidney (293T) cells were purchased (American Type Culture Collection, Manassas, VA) and maintained in Dulbecco modified Eagle medium (Life Technologies) supplemented with 5% FBS. The 293T cells were used for generation of recombinant viruses by reverse genetics.
Titration of virus
The virus titer was measured as described previously. 17 Briefly, each virus was diluted serially by 10-fold with sterile phosphate-buffered saline (PBS), and 100 μL of diluted viruses were inoculated into four 10-d-old SPF ECEs via the allantoic cavity route. The allantoic fluid was harvested and tested for hemagglutination with 1% chicken red blood cells (RBCs) after 3 d of incubation at 37°C. The 50% embryo infectious dose (EID50) was calculated by the Spearman–Kärber method. 10
Matching rates of nucleotide sequences of primers with M genes in database
We collected 9,103 M gene sequences containing complete genome region from IAVs from the GISAID database (Supplementary Data 1). The nucleotide sequences of reported primers were queried to find and count 100% matched identical sequences using the “Filter” option in Excel 2016 (Microsoft, Redmond, WA).5,7,8,16,26,28,30,32,33 Mismatched sequences were counted manually, and the identity rate of a given primer was represented as a percentage by calculation of the number of 100% identical sequences out of the total of 9,103 compared sequences.
Design of a new primer set for SYBR-RT-rtPCR
For a pilot study, we randomly selected 113 M genes from unrelated influenza viruses with different isolation years and subtypes in the IVDB (Influenza Virus Database, http://influenza.psych.ac.cn/; Supplementary Table 1), and compared the nucleotide sequences. We selected the 2 most conserved regions, 32-54 (upstream nucleotides were numbered as negatives; the same region as the FO forward primer) and 250-232. 8 The nucleotide sequences of the 2 regions were compared with M genes of the database as described above, and mismatched sequences were classified into groups. Degenerate primers (MFN1 and MRON1) reflecting sequence variations are listed in Table 1.
Evaluation of generic primer quality based on nucleotide sequence identity with M genes in the GISAID database (http://www.gisaid.org).
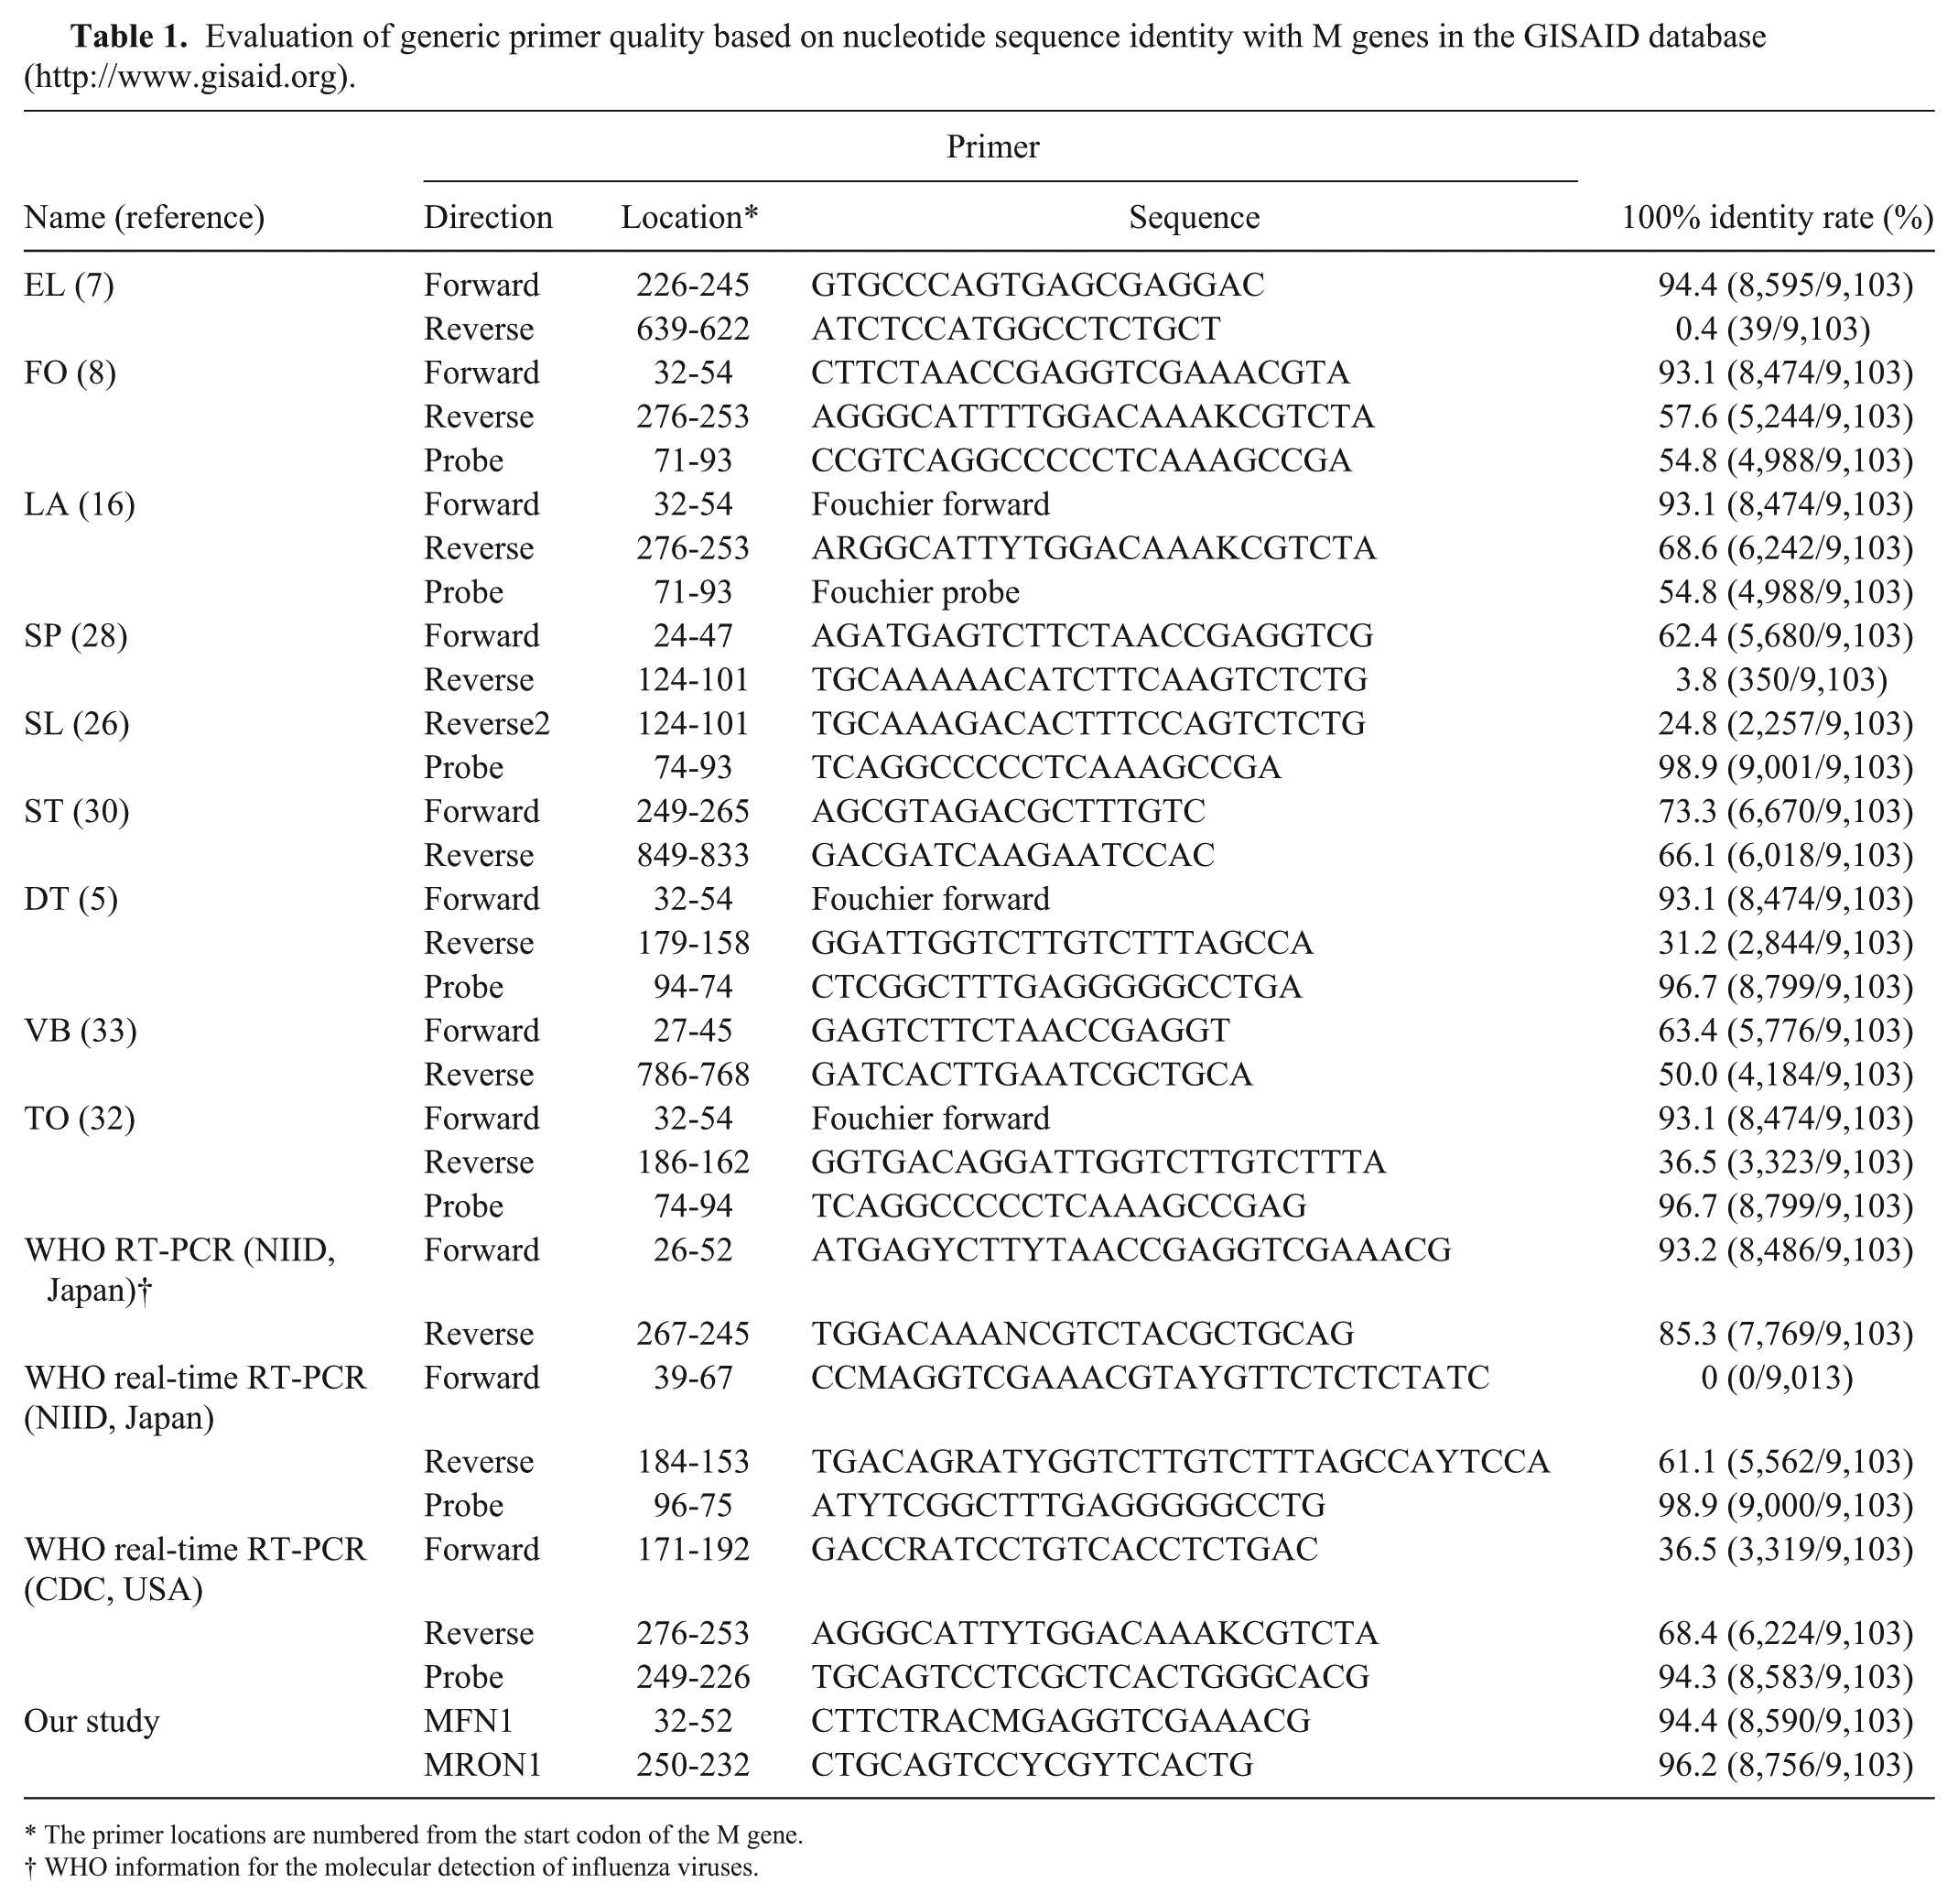
The primer locations are numbered from the start codon of the M gene.
WHO information for the molecular detection of influenza viruses.
RNA extraction and RT-rtPCR
Viral RNA was extracted (Viral gene-spin kit, iNtRON Biotechnology, Seongnamsi, Korea; or RNeasy kit, Qiagen, Hilden, Germany), according to the manufacturer’s instructions. RNA was eluted from the spin column using 50 μL of sterilized diethylpyrocarbonate-treated distilled deionized water (DEPC-DDW). RT-rtPCR was performed (StepOne instrument, Applied Biosystems, Foster City, CA; QuantiTect SYBR Green RT-PCR kit and QuantiTect TaqMan probe RT-PCR kit, Qiagen) according to the manufacturers’ protocols. For SYBR-RT-rtPCR, the 10-µL reaction mixture consisted of 5 µL of SYBR reaction mix, 0.2 µL of RT mix, 0.2 µL (10 pmol) of each primer, 3.4 µL of DEPC-DDW, and 1 µL of diluted RNA template. For TaqMan-RT-rtPCR, the 10-μL reaction mixture consisted of 5 µL of reaction mix, 0.2 µL of RT mix, 0.2 µL (10 pmol) of each primer, 0.2 μL of specific probe (10 pmol), 3.4 µL of DEPC-DDW, and 1 µL of diluted RNA template. The reaction conditions were as follows: for SYBR-RT-rtPCR, 46°C for 30 min and 95°C for 15 min, followed by 40 cycles of 95°C for 15 s, 46°C for 20 s, and 68°C for 25 s, and a melt curve was generated from 60°C to 95°C; for TaqMan-RT-rtPCR, 50°C for 30 min and 95°C for 15 min, followed by 40 cycles of 94°C for 10 s, 55°C for 30 s, and 72°C for 10 s. The threshold was adjusted using the default settings (StepOne software v.2.3, Applied Biosystems).
Site-directed mutagenesis and reverse genetics
In order to generate 2 recombinant viruses with mismatches at the eighth nucleotide (from the 3′-end) of the SP forward primer (mPR8-F-C83A) and nucleotides 5 and 18 (from the 3′-end) of the SP reverse primer (mPR8-R-A183G-C53T), site-directed mutagenesis was carried out (Muta-Direct site directed mutagenesis kit, iNtRON Biotechnology), according to the manufacturer’s protocol, using the following primers: 5′-
Two mutant rPR8 viruses (mPR8-F-C83A and mPR8-R-A183G-C53T) were generated by the Hoffmann reverse genetics system, as described previously.
13
Each mutated M gene plasmid was mixed with 7 internal gene plasmids for rPR8 (300 ng of each plasmid along with Lipofectamine 2000 with Plus reagent, Life Technologies) and transfected into 293T cells as described previously, with some modifications.
15
After overnight incubation, 1 mL of Opti-MEM (Life Technologies) and 0.5 mg/mL of
Sensitivity and specificity of SYBR- and TaqMan-RT-rtPCR
To compare the sensitivity of SYBR- and TaqMan-RT-rtPCR, extracted viral RNA was diluted 10-fold (10-1–10-10), and the detection limit was calculated by dividing the titer (EID50) of each virus by the dilution factor. To verify the specificity of the SYBR-RT-rtPCR method, we ran RNA samples prepared from IAV panels and from other avian RNA viruses. If necessary, the presence and absence of the correctly sized amplicon at the end-point of positive and negative controls were confirmed by gel electrophoresis on 2% agarose gels and visualization using an ultraviolet transilluminator.
Anti–influenza virus effect of Triton X-100
To test anti–influenza virus activity, 1 mL each of 0.3% and 0.5% Triton X-100 (Sigma-Aldrich) solutions were prepared in PBS containing 0028 strain–infected allantoic fluid (7.25 × 10⁵ EID50/100 µL). After incubation at room temperature for 30 min, samples were diluted 10-fold to 10-7, and 10 µL of each diluted solution was added to CEK cells cultured in 96-well plates. Four wells for each diluted solution were tested for virus replication using the plate agglutination test with 0.5% RBCs and culture medium. The same volumes of RBCs and culture medium were mixed for hemagglutination.
Concentration of viral genomes by using immunomagnetic separation
To concentrate diluted virus, 0.3%, 0.5%, 0.7%, 0.9%, and 1.3% of Triton X-100 solutions (10 mL of each concentration) were prepared in PBS containing the 0028 strain (7.25 × 10⁵ EID50/100 µL). Then, anti-NP mouse mAbs (anti-NP-mAbs; Bionote, Suwon, Korea) and anti-mouse immunoglobulin G goat antibody-conjugated magnetic beads (aMBs; Dynabeads, Thermo Fisher Scientific, Waltham, MA) were added, and incubated for 30 min at room temperature with mild mixing. The RNP-anti-NP-mAb-aMB complex was separated with a magnet, and the solution was removed. Next, 150 µL of RNA lysis buffer (RNeasy kit, Qiagen) was added to the separated complex, and RNA was purified according to the manufacturer’s protocol. To prepare a fecal suspension, 0028 strain (7.25 × 10⁵ EID50/100 µL) was added to 25 g of SPF chicken feces (Charles River Lab), and mixed well with 25 mL of PBS. After centrifugation at 17,500 × g for 15 min, the supernatant was harvested and mixed well with a 10-fold volume of PBS. We divided the diluted supernatant into a 1.5-mL microcentrifuge tube (100 µL) and six 50-mL conical tubes (10 mL/tube) and added 1 (0.9%), 2 (1.7%), 4 (2.9%), 6 (3.8%), 8 (4.4%), and 10 (5.0%) mL of 10% Triton X-100 solution to the conical tubes (experiment 1). Independently, we prepared a diluted fecal solution again as above and added 5 mL (3.3%) of 10% Triton X-100 solution (experiment 2). Then, the RNP concentration and RNA extraction were performed as above. In the case of unconcentrated samples, 100 µL from 10 mL of 0028 strain–spiked PBS or feces suspension was used for RNA purification.
Effect of RNP concentration on the sensitivity of SYBR-RT-rtPCR
Allantoic fluid containing rPR8 strain was diluted in 5 mL of PBS to final dilutions of 10-6 and 10-7. In each dilution, conventional methods for RNA extraction and RNP concentration were performed as above. The extracted RNA were examined by SYBR-RT-rtPCR.
Results
Comparison of nucleotide sequence identities of reported and new generic primer sets to target M genes in the database
Of the compared primer sets, NIID (National Institute of Infectious Diseases, Japan), ST and LA primer sets showed relatively high 100% identity rates for both primers (i.e., 93.2 %/85.3%, 73.3%/66.1%, and 93.1%/68.6%, respectively; Table 1).16,30 The other primer sets showed relatively low identity rates, which may reduce the efficiency of PCR-based detection.5,7,8,26,28,32,33 In addition, the 100% identity rates of probes were 54.8–98.9%. Therefore, we designed improved forward and reverse degenerate primers for SYBR-RT-rtPCR (Table 1). The forward primer (MFN1) was located in the same position as the FO forward primer (32-54) but contained 2 degenerate nucleotides at positions 6 and 9 from the 5′-end. The reverse primer (MRON1) was located at 250-232 and contained 2 degenerate nucleotides at positions 10 and 13 from the 5′-end. Therefore, the 100% identity rates of MFN1 and MRON1 were expected to be 94.4% and 96.2%, respectively (Table 1). The high identity rate of the new generic primer set was expected to increase the sensitivity of the RT-rtPCR assay.
Comparison of the sensitivity and specificity of SYBR- and TaqMan-RT-rtPCR
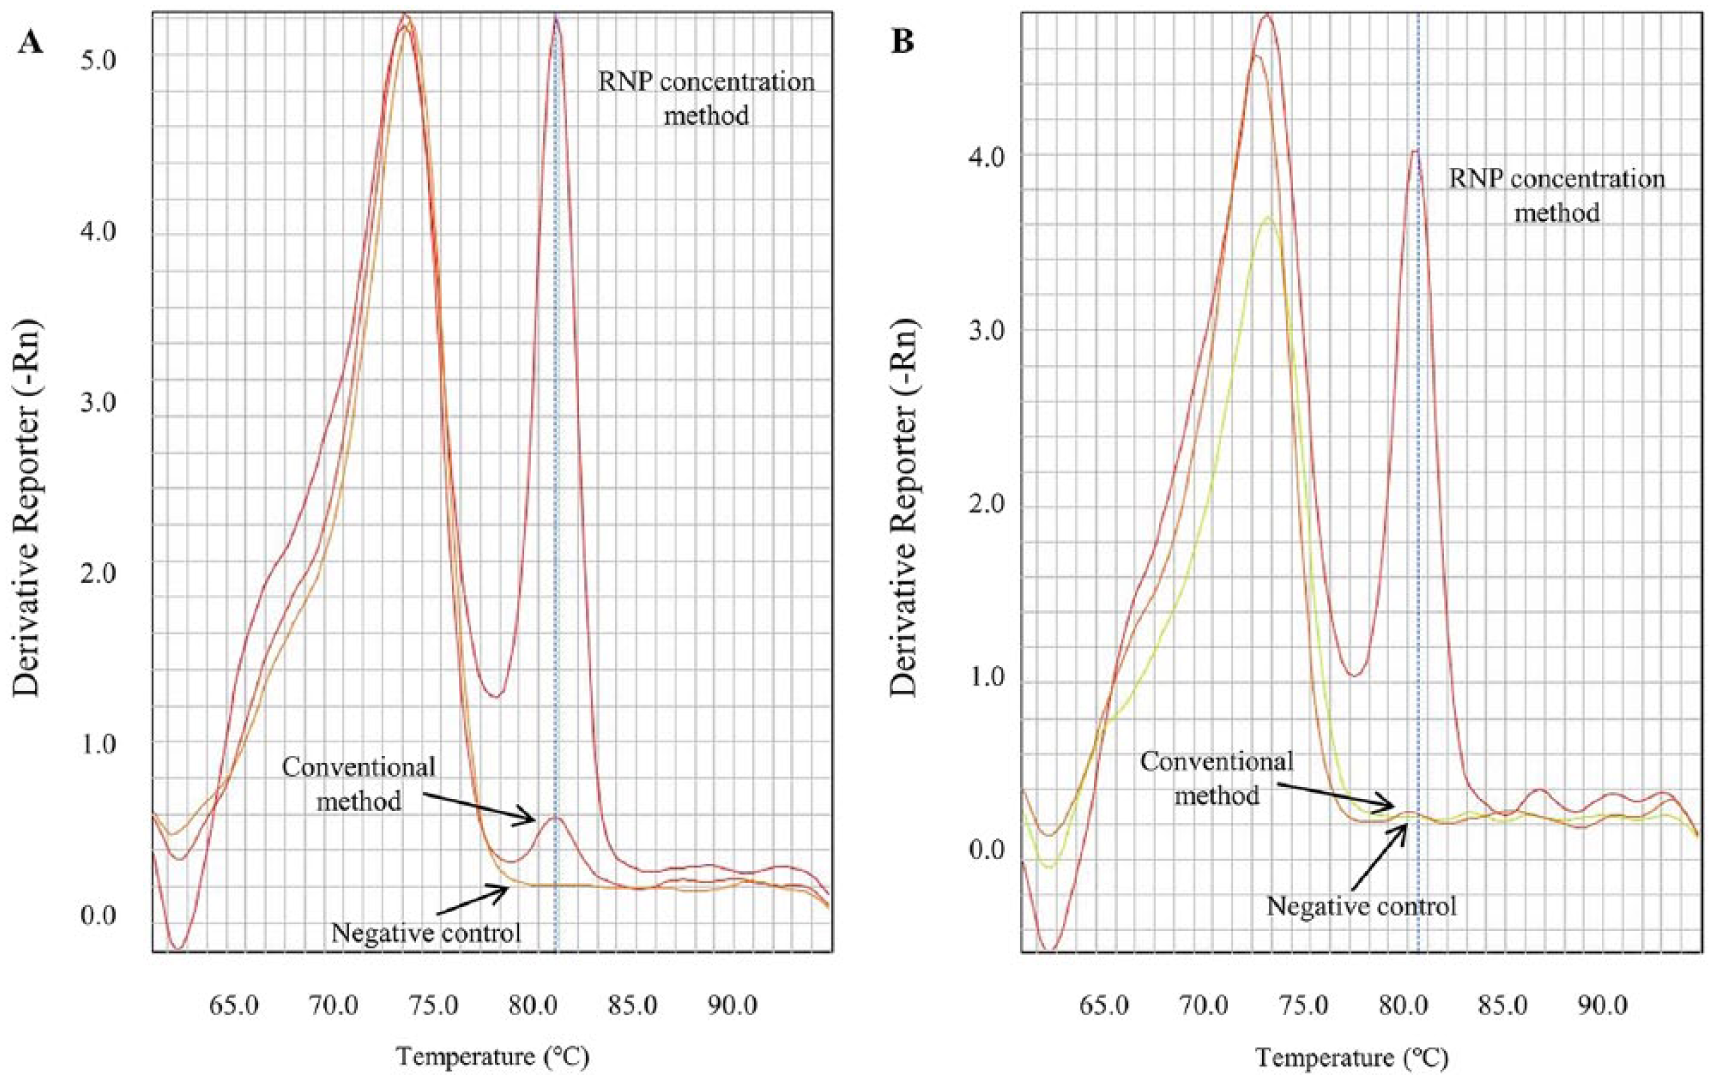
The specificity of SYBR-RT-rtPCR was assessed using all IAV panels and avian RNA viruses, such as NDV, IBV, IBDV, and REV. All IAVs showed a peak at the specific melting temperature (Fig. 1A), whereas other avian RNA viruses did not show this specific peak (Fig. 1B).
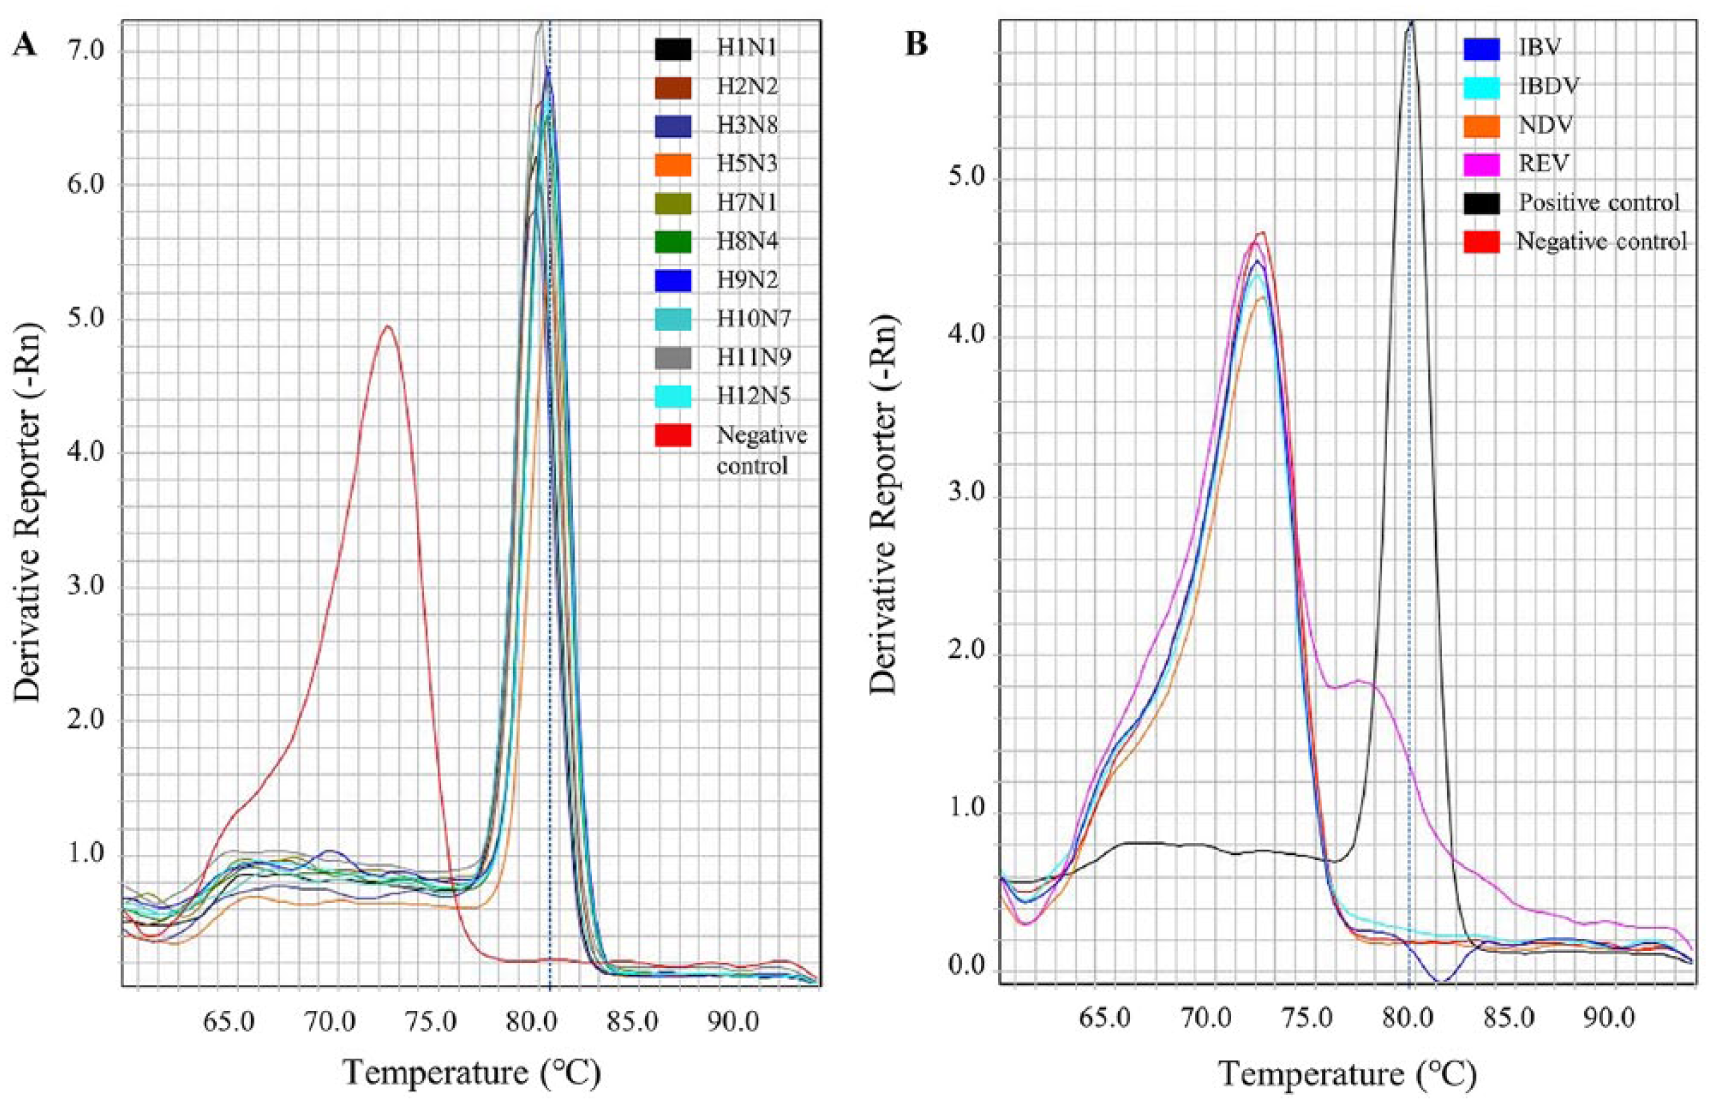
Positive response to various subtypes of influenza A viruses and negative response to other avian RNA viruses.
The sensitivity of SYBR-RT-rtPCR was compared with that of TaqMan-RT-rtPCR (Table 2). The detection limit of each RT-rtPCR assay was defined as the highest dilution of RNA that provided a distinguishable amplification signal or melt curve over the negative control. In order to verify the effect of primer mismatch with template on the detection limit of RT-rtPCR, we generated single or double mismatch mutants (mPR8-F-C83A and mPR8-R-A183G-C53T, respectively). We measured the virus titers of rPR8, mPR8-F-C83A, and mPR8-R-A183G-C53T, and extracted RNA from each virus and made 10-fold serial dilutions (10-1–10-10). Each diluted RNA sample was examined by both SYBR-RT-rtPCR and TaqMan-RT-rtPCR. The detection limits of SYBR-RT-rtPCR were 1.37, 1.69, and 7.89 EID50, whereas those of TaqMan-RT-rtPCR were 1.37, 1.69, and 78.9 for rPR8, mPR8-F-C83A, and mPR8-R-A183G-C53T, respectively (Table 2). The detection limits of rPR8 and mPR8-F-C83A were the same in both SYBR-RT-rtPCR and TaqMan-RT-rtPCR. However, mPR8-R-A183G-C53T was detected more sensitively by SYBR-RT-rtPCR than TaqMan-RT-rtPCR.
Detection limit of 2 reverse-transcription real-time PCR assays.
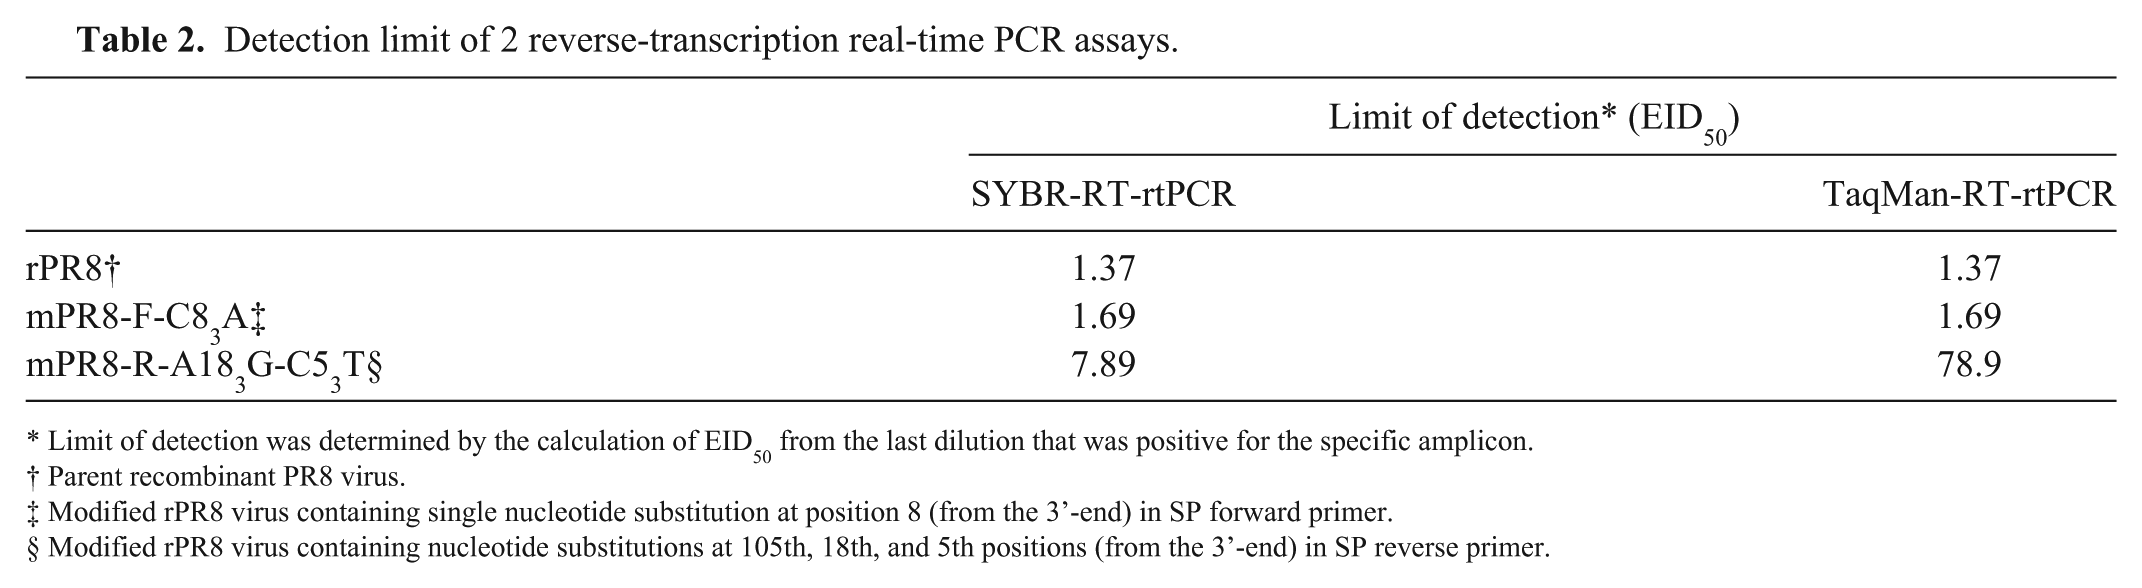
Limit of detection was determined by the calculation of EID50 from the last dilution that was positive for the specific amplicon.
Parent recombinant PR8 virus.
Modified rPR8 virus containing single nucleotide substitution at position 8 (from the 3’-end) in SP forward primer.
Modified rPR8 virus containing nucleotide substitutions at 105th, 18th, and 5th positions (from the 3’-end) in SP reverse primer.
Anti–influenza virus effects of Triton X-100
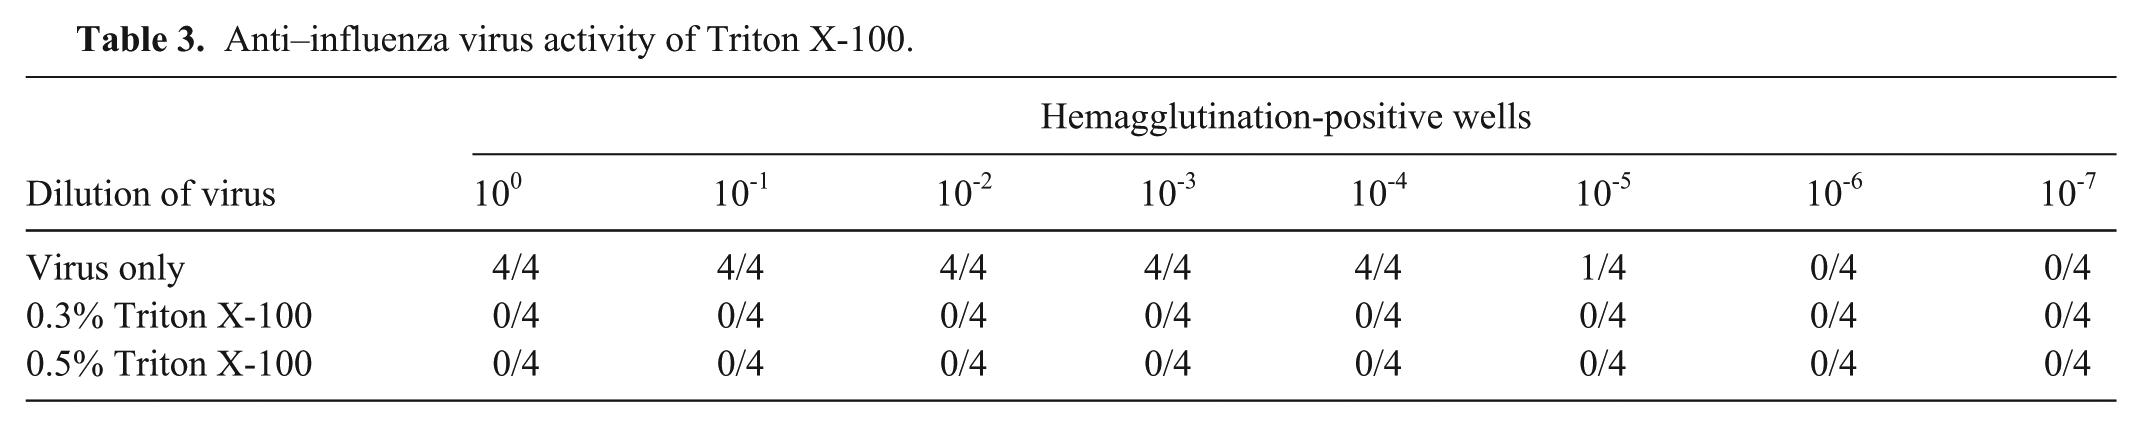
Intact 0028 strain retained infectivity until 10-5 dilution, whereas all Triton X-100–treated 0028 strain dilutions showed no infectivity (Table 3). Therefore, 0.3% Triton X-100 was considered effective for inactivation of IAV.
Anti–influenza virus activity of Triton X-100.
Concentration of RNP in samples
The cycle threshold (Ct) of the unconcentrated sample was 25.0, whereas those of purified RNPs from 0.3%, 0.5%, 0.7%, 0.9%, and 1.3% Triton X-100–treated allantoic fluid were 21.9, 20.9, 20.0, 19.0, and 19.0, respectively (Table 4). Thus, RNP purified by treatment with 0.9% or 1.3% Triton X-100 reduced the Ct by ~6 cycles compared with the unconcentrated sample. These results indicate that the amount of purified RNA was ~64-fold greater than that of the unconcentrated sample. In addition, we compared the amount of RNA in unconcentrated and concentrated 0028 strain–spiked fecal suspension samples by SYBR-RT-rtPCR (Table 5). In experiment 1, the Ct value of unconcentrated sample was 27.3 but those of concentrated samples treated with 0.9%, 1.7%, 2.9%, 3.8%, 4.4%, and 5.0% of Triton X-100 were 25.6, 24.3, 24.1, 24.6, 25.9, and 26.1, respectively. In experiment 2, the Ct value of unconcentrated sample was 23.0 but that of concentrated sample treated with 3.3% of Triton X-100 was 18.7. The differences in Ct values between the unconcentrated and concentrated samples were 3.26 (experiment 1, 2.9% Triton X-100 solution treatment) and 4.17 (experiment 2). Therefore, the concentrated samples from both experiments were estimated theoretically to contain ~8- and 16-times more RNA, respectively, than the unconcentrated samples. Furthermore, our RNP concentration method could detect the virus below the detection limit of the conventional RNA extraction method (Fig. 2).
Comparison of viral RNA amounts before and after concentration of RNP in allantoic fluid by SYBR-RT-rtPCR.
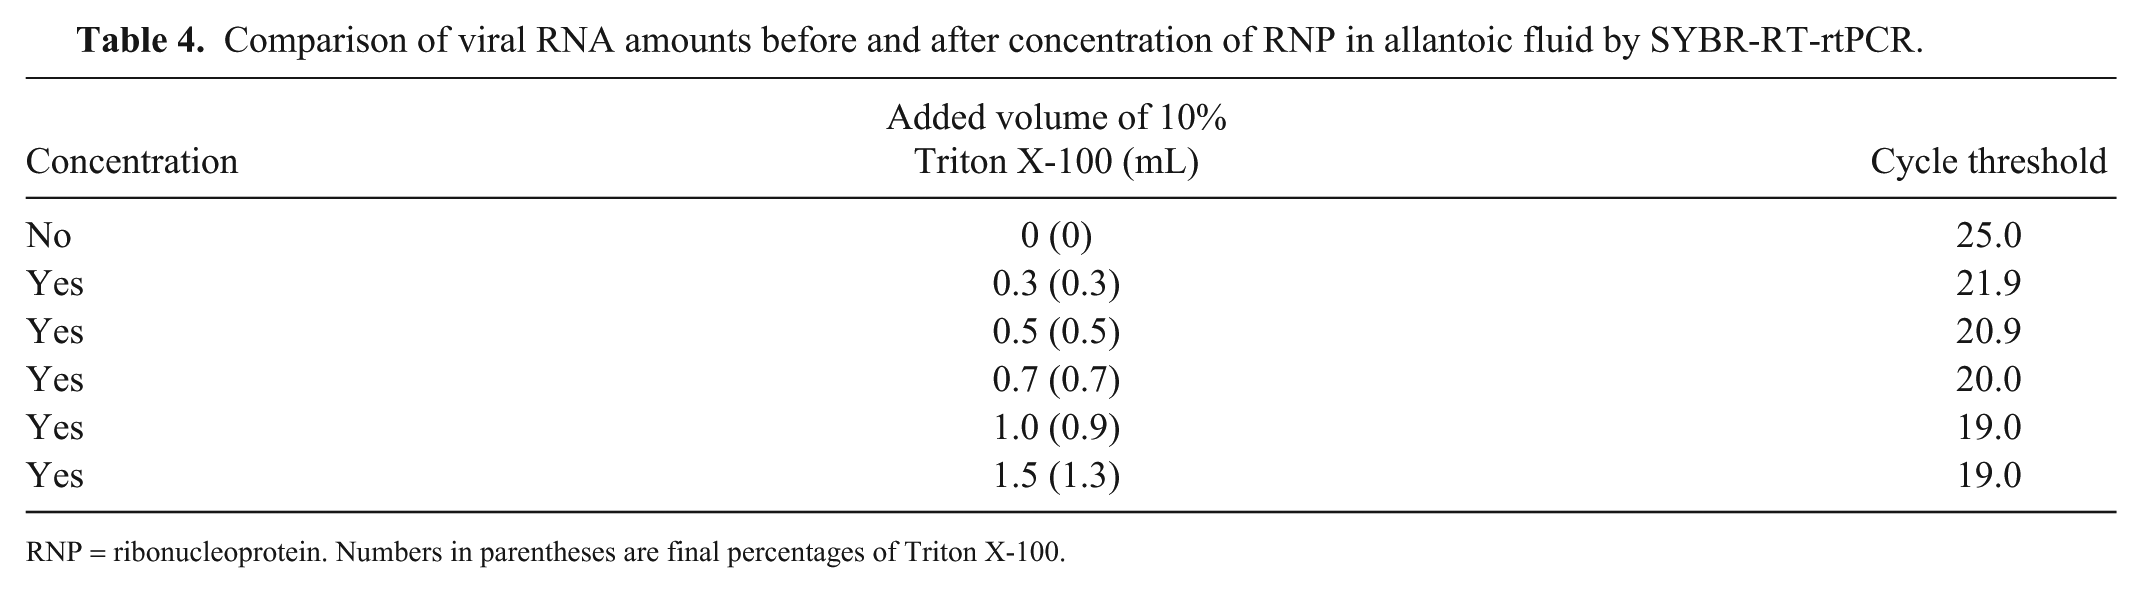
RNP = ribonucleoprotein. Numbers in parentheses are final percentages of Triton X-100.
Comparison of viral RNA amounts before and after concentration of RNP in feces by SYBR-RT-rtPCR.
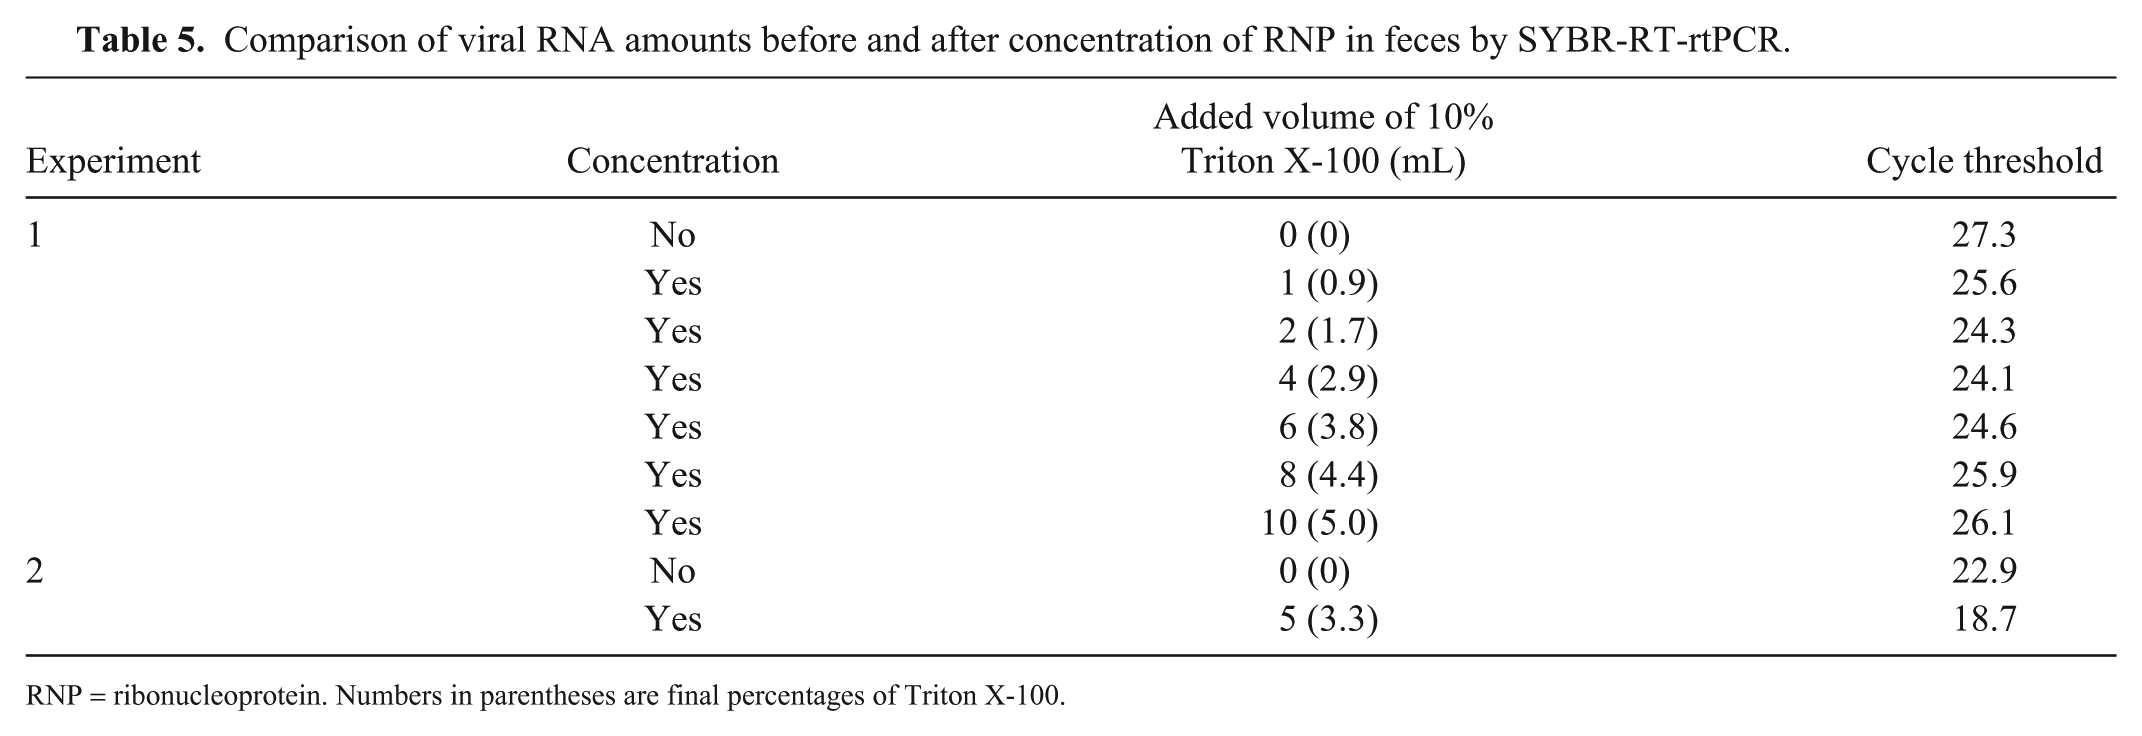
RNP = ribonucleoprotein. Numbers in parentheses are final percentages of Triton X-100.
Comparison of the detection limits of RNP concentration and conventional RNA extraction methods. rPR8 virus was diluted 10-fold, and RNA from
Discussion
M genes are the frequent targets of molecular detection given the relatively high conservation of target regions among IAVs; however, the conserved region can change abruptly, causing false-negative results. 36 The effects of mismatches between primers and probes and templates depend on the types and positions of mismatches.6,29,37 Although we checked the types and positions of primer mismatches, we only described the 100% identity rate of each primer for simplicity. Considering the comparable mutation rates of the M gene and the highly variable HA gene, the presence of highly conserved regions in the M gene is interesting. 24 Thus, conserved regions with a relatively high 100% identity rate, as shown in our study, may have less possibility of mutations than other regions.
Advancements have enabled specific amplicon to be detected by TaqMan probes, and small amplicons are preferred to reduce nonspecific signal. The ST primer set with a high 100% identity rate was expected to produce a relatively large amplicon to be used as RT-rtPCR primer (601 bp), and highly conserved sequences for TaqMan probes were absent between the forward and reverse primers. SP TaqMan-RT-rtPCR has been frequently used for detection of AIVs, but the relatively low 100% identity rates of both primers were unexpected. In addition, the target region of the TaqMan probe should be conserved for sensitive and specific fluorescence emission, although mutations are inevitably encountered. 36 Therefore, we designed improved forward and reverse degenerate primers for SYBR-RT-rtPCR that did not require additional conserved regions for probes. Degenerate primers have been used to amplify variable regions of templates without increasing the number of primers and cost.19,20 However, too high a level of primer degeneracy may induce nonspecific and inefficient amplification of template. We, therefore, restricted degeneracy to only 2 loci in each primer, and it did not give negative effects.
The similar sensitivities of SYBR-RT-rtPCR and TaqMan-RT-rtPCR for rPR8 and mPR8-F-C83A may reflect the lack of effects of primer mismatches at this position. However, in comparison with SYBR-RT-rtPCR, 2-nucleotide mismatches in the reverse primer clearly reduced the sensitivity of TaqMan-RT-rtPCR. Considering the single nucleotide mismatch of SP forward and reverse primers to corresponding regions of rPR8 and mPR8-F-C83A, respectively, such mismatches may not affect the sensitivity of TaqMan-RT-rtPCR. However, the different sensitivity may be attributed to the 2-nucleotide mismatches between SP reverse primer and the corresponding region of mPR8-R-A75G-C53T. The frequency of wild IAVs with the same mismatches in our database was 2.37% (216 of 9,103), and the sensitivity of TaqMan-RT-rtPCR may decrease in specimens from randomly collected pooled samples.
Although TaqMan-RT-rtPCR is highly sensitive and specific, we encountered an unexpected problem. The fluorescence signals were occasionally amplified even in negative controls and in some samples containing high concentrations of non–IAV-related RNA. Even though the signals increased during later rounds of the thermocycles, misleading false-positive results were observed (data not shown). To verify the false-positive results, we visualized the amplicons using 2% agarose gel electrophoresis; however, the size of the amplicon generated by TaqMan-RT-rtPCR was only 101 bp, and specific and nonspecific amplicons were difficult to distinguish. However, our SYBR-RT-rtPCR did not cause any false-positive results, and the specific amplicon was easily distinguished from nonspecific primer dimers based on analysis of the melting temperature (data not shown). Nonspecific amplicons with different melting temperatures showed smaller sizes on electrophoresed agarose gels. Furthermore, SYBR-RT-rtPCR did not require a probe, for which mismatch may decrease the sensitivity of detection. Thus, our SYBR-RT-rtPCR, with high sensitivity and specificity, may be useful for the molecular detection of IAVs.
The application of anti-NP antibody-bound magnetic beads to fecal samples for RNP purification was previously reported and the yield of RNP purification was similar to that of a conventional RNA extraction step. 4 We complemented the method by applying both the RNP purification with additional Triton X-100 treatment and RNA extraction steps; this method improved the detection limits of SYBR-RT-rtPCR. Therefore, both optimized RNP purification with additional Triton X-100 treatment and RNA extraction steps may yield very different results. Triton X-100 treatment may also improve biosecurity during specimen preparation for recently developed rapid RNP extraction protocols.3,18,31 Additionally, combination of our optimized primer set and RNP purification method with real-time molecular point-of-care testing may be helpful for more sensitive, specific, and rapid detection of IAVs.21–23
Supplemental Material
DS1_JVDI_10.1177_1040638719830760 – Supplemental material for An optimized molecular method for detection of influenza A virus using improved generic primers and concentration of the viral genomic RNA and nucleoprotein complex
Supplemental material, DS1_JVDI_10.1177_1040638719830760 for An optimized molecular method for detection of influenza A virus using improved generic primers and concentration of the viral genomic RNA and nucleoprotein complex by Ji-Woon Kim, Chung-Young Lee, Thanh Trung Nguyen, Il-Hwan Kim, Hyuk-Joon Kwon and Jae-Hong Kim in Journal of Veterinary Diagnostic Investigation
Footnotes
Acknowledgements
We thank Dr. Robert Webster and Erich Hoffmann of St. Jude Children’s Research Hospital Inc., USA, for supplying the reverse genetics plasmids.
Declaration of conflicting interests
The authors declared no potential conflicts of interest with respect to the research, authorship, and/or publication of this article.
Funding
This work was supported by grants from the Korea Institute of Planning and Evaluation for Technology in Food, Agriculture, Forestry and Fisheries (IPET); by the Animal Disease Management Technology Development Program, funded by Ministry of Agriculture, Food and Rural Affairs (MAFRA); and the BK21 PLUS Program for Creative Veterinary Science Research.
Supplementary material
Supplementary material for this article is available online.
References
Supplementary Material
Please find the following supplemental material available below.
For Open Access articles published under a Creative Commons License, all supplemental material carries the same license as the article it is associated with.
For non-Open Access articles published, all supplemental material carries a non-exclusive license, and permission requests for re-use of supplemental material or any part of supplemental material shall be sent directly to the copyright owner as specified in the copyright notice associated with the article.