
Abstract
Method validation studies characterize the performance of new laboratory methods relative to established methods using quality guidelines in order to define the new method’s performance characteristics and to identify differences that could influence data interpretation. We investigated the performance of an in-clinic dry chemistry analyzer (Catalyst One, IDEXX) for measuring 19 routine plasma biochemistry analytes in dogs, cats, and horses. We analyzed 2 levels of quality control material (QCM) in duplicate twice daily for 5 d to determine the coefficient of variation (CV), percent bias, observed total error (TEobs), and sigma metric (σ) for each analyte at each level of QCM. We analyzed 82 canine, equine, and feline plasma samples with the in-clinic dry chemistry analyzer and a reference wet chemistry analyzer, and results were compared using correlation coefficients, Deming regression, and Bland–Altman analyses. CVs were <5% for 16 analytes and ⩾5% for 3 analytes. TEobs was less than allowable total error (TEa) for 9 analytes, and exceeded TEa for 10 analytes. Sigma metrics were >4 at both levels of QCM for 5 analytes, and at one level of QCM for 5 analytes; sigma metrics were <3 or could not be calculated at the remaining analyte concentrations. All analytes, except glucose, showed various magnitudes of bias compared to the wet chemistry analyzer. Based on these results, we recommend statistical (5 analytes) and non-statistical (14 analytes) QC measures and analyzer-specific reference intervals.
Introduction
The Catalyst One (IDEXX Laboratories, Westbrook, ME) is an in-clinic chemistry analyzer that utilizes dry slide technology. Compared to wet chemistry analyzers, dry chemistry methods tend to require less maintenance, which makes them ideal for point-of-care testing in general veterinary practice. This in-clinic dry chemistry analyzer also contains an internal centrifuge, which allows loading of whole blood directly into the analyzer, further reducing sample processing time. Results for a general chemistry panel, including electrolytes and total thyroxine, can be obtained in as few as 15 min. The minimum sample volume requirement varies depending on the number of analytes being measured, but either 700 µL of whole blood or 300 µL of serum or plasma is recommended for running a Chem 17 CLIP (14 directly measured analytes) and Lyte 4 CLIP (3 directly measured analytes). The manufacturer’s recommended maintenance includes automatic software updates, cleaning, and monthly quality control (QC) procedures.
Point-of-care analyzers are heavily utilized in veterinary medicine. Although their use has many potential advantages, including rapid turnaround time, small sample volume requirements, and unlimited availability, there are numerous disadvantages, some of which are inconsistently available method comparison studies and poor quality assurance measures. 2 Prior to use, such instruments should have their results compared to established methods to identify discrepancies in results that may influence clinical interpretation and decision making. This is typically accomplished through method comparison studies that utilize Deming regression and Bland–Altman statistics and plots. 5
Point-of-care analyzers should undergo QC validation, which is the process of selecting QC rules based on the instrument’s analytical performance and desired quality requirements. 2 Analytical performance studies quantify the error in the laboratory method: precision measures the closeness of agreement between repeat results on the same sample; bias quantifies the difference between the measured result and the “true” result obtained from a known standard or reference method; and observed total error (TEobs) is a calculated value derived from the precision and bias results. To determine result acceptability, TEobs is then compared with predefined allowable total error (TEa) limits, as published in 2013 for commonly measured analytes in veterinary medicine. 4 TEobs must be calculated for each analyte, is unique to each instrument, and may vary with analyte concentration or activity. 2
Sigma metric (σ) is another quality performance measure that is calculated using TEa and the analyzer’s analytical performance characteristics, precision and bias. 1 This metric has been used in human and veterinary reference laboratories to help optimize QC rules to maximize true error detection while minimizing false rejection of QC runs, thereby reducing wasted operating costs. 1 Higher σ values indicate better performance and the need for less stringent QC, whereas lower σ values indicate suboptimal performance and the need for more stringent QC. 1 Sigma values represent the amount of errors in a method with known quality requirements. 3 A method with a σ value of 6 (6σ) is considered to have world-class performance, and is expected to produce 3.4 erroneous results per 1 million iterations of the method (i.e., 3.4 defects per million opportunities [DPMO]). 3 Lower sigma values are generally interpreted as excellent (σ > 5), good (σ > 4), marginal (σ > 3), poor (σ > 2), or unacceptable (σ > 1), and the expected error rates are 233 DPMO, 6,210 DPMO, 66,807 DPMO, 308,538 DPMO, and 691,462 DPMO, respectively. 3 In general, σ > 3 is desired in most quality systems. 1
For 19 plasma biochemical analytes, the goals of our study were 1) to determine the precision, bias, TEobs, and σ of the Catalyst One in-clinic dry chemistry analyzer, and 2) to compare clinical sample results from an in-clinic dry chemistry analyzer to a reference wet chemistry analyzer.
Materials and methods
Analytes
The following analytes were evaluated: alanine aminotransferase (ALT), albumin (Alb), alkaline phosphatase (ALP), ammonia (NH3), blood urea nitrogen (BUN; urea), calcium (Ca), cholesterol (Chol), creatine kinase (CK), creatinine (Crea), gamma-glutamyl transferase (GGT), glucose (Glu), inorganic phosphorus (P; phosphate), magnesium (Mg), total bilirubin (TBili), total protein (TP), and triglyceride (Trig).
Analyzers and quality control
Two analyzers were used: an in-clinic dry chemistry analyzer (Catalyst One, IDEXX Laboratories) and a reference wet chemistry analyzer (AU480, Beckman Coulter, Brea, CA; Table 1). Analyzers were maintained per the manufacturers’ instructions, except for the in-clinic dry chemistry analyzer, which received more frequent QC checks than recommended by the manufacturer. The latter consisted of weekly QC checks using the Lyte 4 CLIP (chloride [Cl], potassium [K], and sodium [Na]) and QC CLIP (Alb, ALP, ALT, Ca, Glu, and NH3) to analyze one level of the manufacturer’s QC material (QCM; VetTrol control plus diluent, IDEXX Laboratories).
Methods employed by the in-clinic and reference analyzers for biochemical assays.
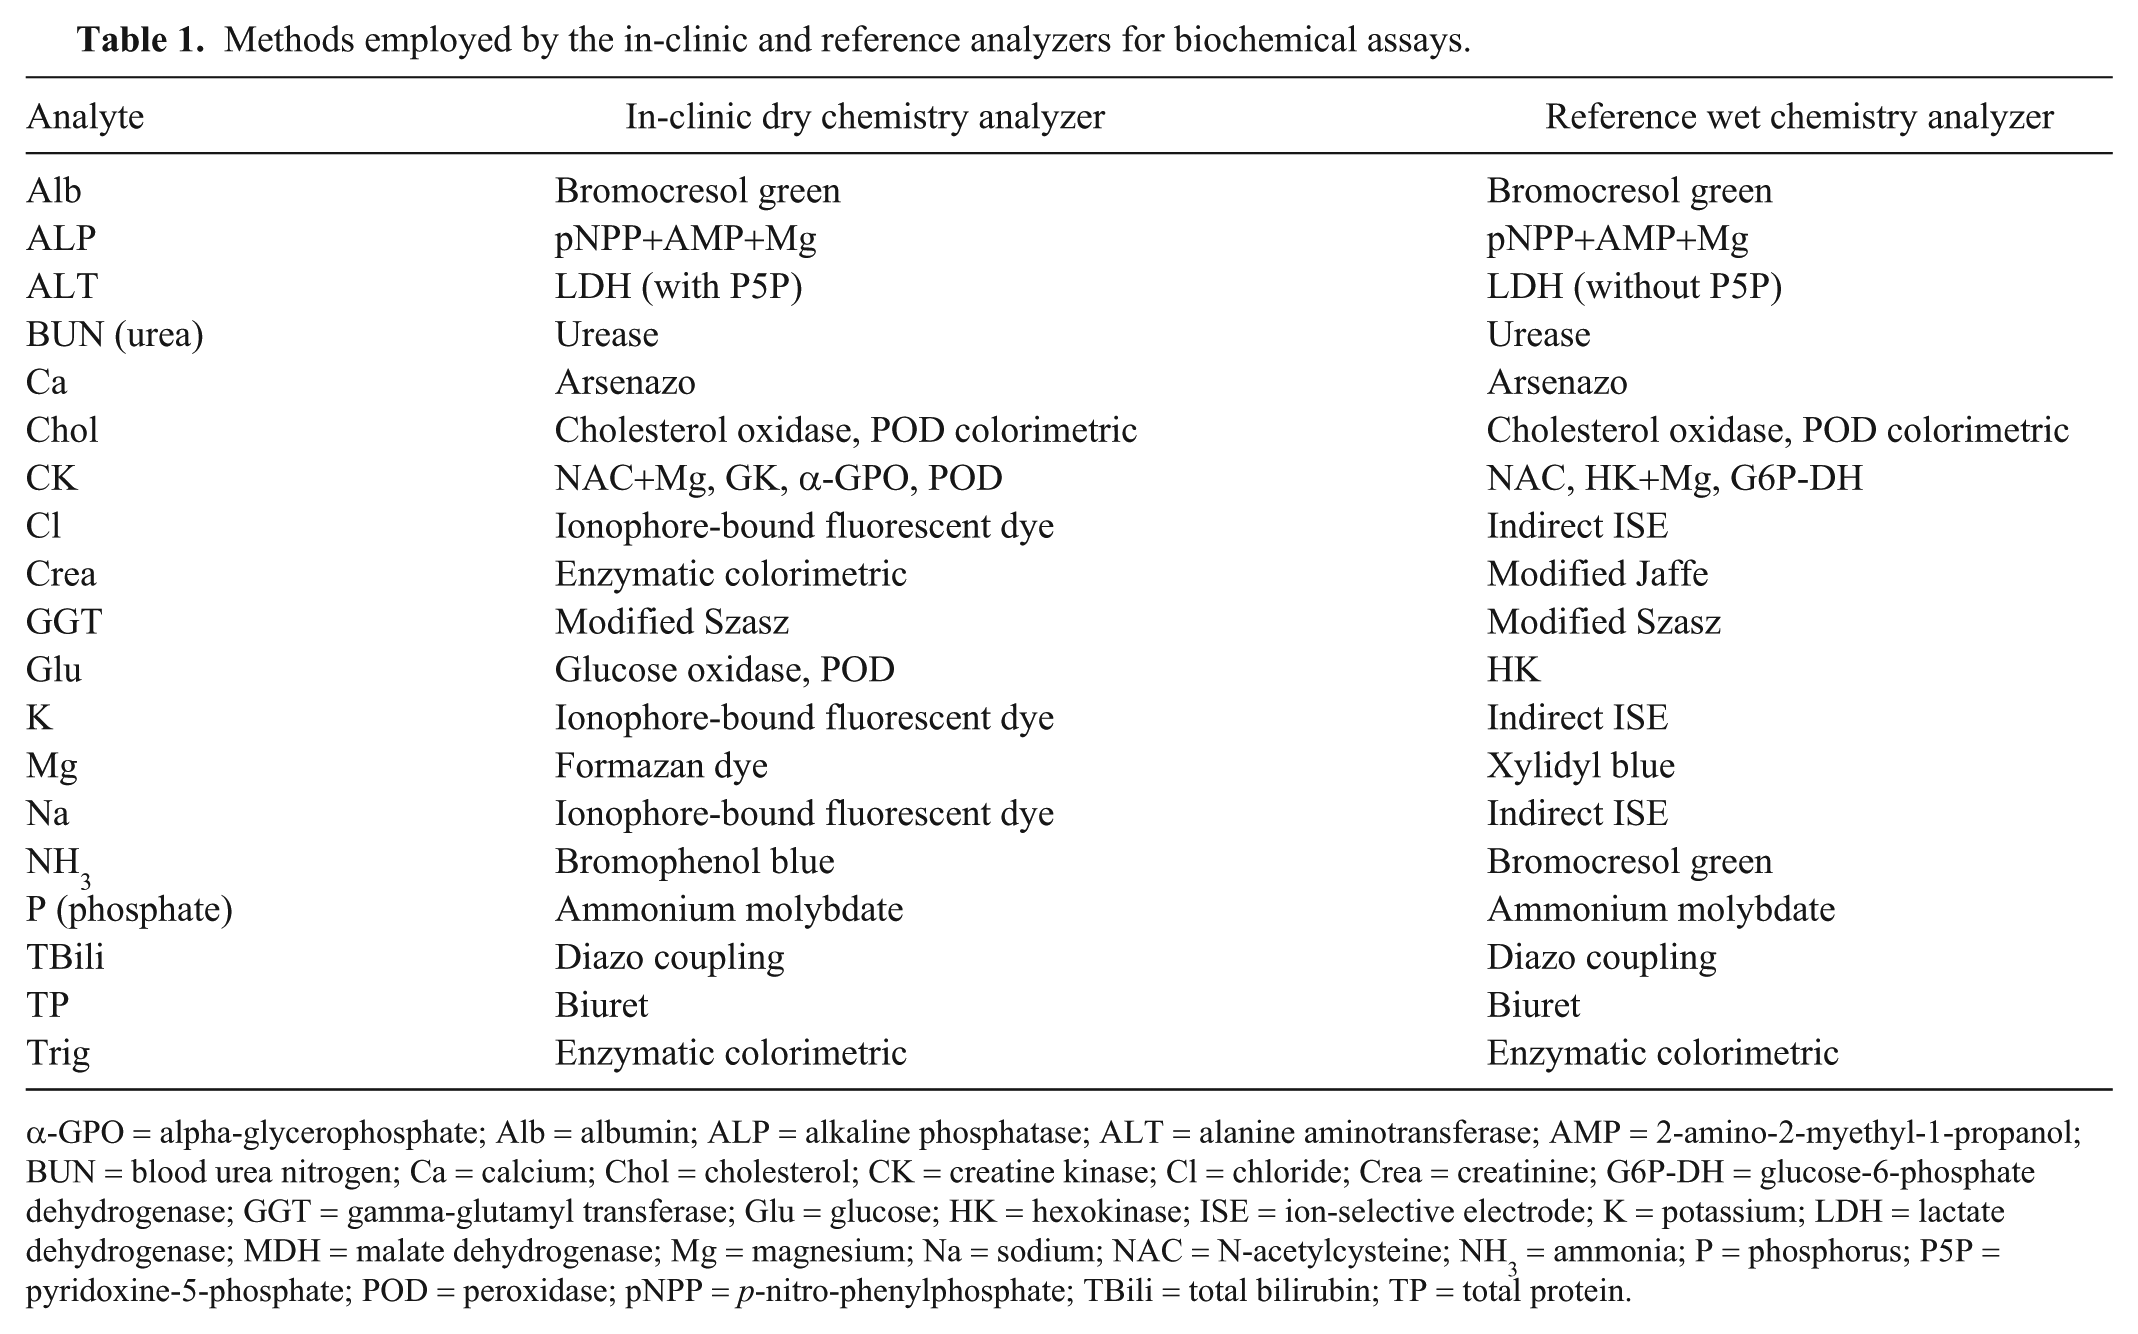
α-GPO = alpha-glycerophosphate; Alb = albumin; ALP = alkaline phosphatase; ALT = alanine aminotransferase; AMP = 2-amino-2-myethyl-1-propanol; BUN = blood urea nitrogen; Ca = calcium; Chol = cholesterol; CK = creatine kinase; Cl = chloride; Crea = creatinine; G6P-DH = glucose-6-phosphate dehydrogenase; GGT = gamma-glutamyl transferase; Glu = glucose; HK = hexokinase; ISE = ion-selective electrode; K = potassium; LDH = lactate dehydrogenase; MDH = malate dehydrogenase; Mg = magnesium; Na = sodium; NAC = N-acetylcysteine; NH3 = ammonia; P = phosphorus; P5P = pyridoxine-5-phosphate; POD = peroxidase; pNPP = p-nitro-phenylphosphate; TBili = total bilirubin; TP = total protein.
For general chemistry tests, the reference wet chemistry analyzer analyzed 2 levels of unassayed QCM (Liquid unassayed multiqual, levels 1 and 3, Bio-Rad Laboratories, Hercules, CA) daily. Two levels of assayed QCM (Liquid QC alcohol/ammonia control, levels 1 and 2, Cliniqa, San Marcos, CA) were analyzed daily for monitoring NH3 performance. QCM lot numbers were the same for the duration of the study. For all reference tests, means and standard deviations were derived from at least 40 data points over at least 40 d. QC rules were derived for each analyte using QC design software (EZ Rules 3 QC design software, Westgard QC, Madison, WI) and published TEa guidelines. 4
All analyses were performed according to the manufacturer’s instructions. Throughout the duration of our study, the reference wet chemistry analyzer was calibrated 3–26 times per analyte, and the reagent lot number changed once for each of the following methods: Alb, ALP, ALT, Crea, GGT, P, Mg, and Trig. Reagent lot numbers remained the same for all other analytes. The accuracy of the reference methods was assessed by monthly participation in peer group testing of unassayed QCM (Bio-Rad Unity, Bio-Rad Laboratories), and quarterly participation in an external quality assurance program (College of American Pathologists, Chemistry and Therapeutic Drug Survey, Northfield, IL) for all analytes.
Statistical analysis
Analyses were performed (JMP Pro 13, SAS Institute, Cary, NC).
Imprecision
Imprecision of the in-clinic dry chemistry analyzer was assessed by analyzing the same lot numbers of QCM in duplicate twice daily with a minimum of 2 hr between runs for 5 d (i.e., 20 measurements total for each analyte within each level of QCM). Two levels of QCM were evaluated for general chemistry tests (Liquid unassayed multiqual, levels 1 and 3, Bio-Rad Laboratories) and NH3 measurements (Liquid QC alcohol/ammonia control, levels 1 and 2, Cliniqa). Within-run and between-run imprecision were estimated by determining the coefficients of variation (CVs) for each QCM: CV(%) = SD/mean × 100%.
Imprecision of the reference wet chemistry analyzer was assessed by analyzing the same lot number of QCM daily for 40 d. QCM for each analyte was the same as those specified for the in-clinic dry chemistry analyzer.
Observed total error and sigma metrics
TEobs was calculated for each analyte at each level of control using the formula: TEobs(%) = 1.65CV(%) + bias(%). For each analyte, between-run CV results were used for these calculations, and bias(%) was determined using the formula: bias(%) = (target mean – measured mean)/target mean. The “target means” used for bias calculations were the manufactures’ means for assayed QCMs (Liquid QC alcohol/ammonia control, levels 1 and 2, Cliniqa), or the means calculated from peer laboratories analyzing the same lot number of unassayed QCM (Liquid unassayed multiqual, levels 1 and 3, Bio-Rad Laboratories; distribution of participating peer laboratories per analyte: median, 164, range, 17–293). The TEobs was considered acceptable if TEobs was less than published TEa guidelines. 4
Sigma metric values were calculated for each level of QCM using the formula: σ = (Tea(%) – bias(%))/CV(%). 1 TEa values were obtained from the American Society for Veterinary Clinical Pathology guidelines. 4 Sigma values were interpreted as poor (σ > 2), marginal (σ > 3), good (σ > 4), excellent (σ > 5), or world-class (σ > 6). 5
Method comparison
Samples submitted to the Virginia Tech Animal Laboratory Services (ViTALS, Blacksburg, VA) between August 2016 and January 2017 were included in the study. The samples were obtained from both ill and clinically healthy animals. The following analytes were assessed using canine, equine, and feline samples: Alb, BUN, Ca, CK, Crea, GGT, Glu, NH3, TBili, and TP. Only canine and feline samples were analyzed for ALP, ALT, Chol, P, and Trig measurements. Only equine samples were analyzed for Mg measurements. For ease of testing, the target sample size for each analyte varied depending on availability in the in-clinic dry chemistry analyzer’s prepackaged profiles or as individual slides (Chem 15 CLIP, Equine 15 CLIP, Lyte 4 CLIP, individual slides of CK, Mg, and Trig, IDEXX Laboratories). Target sample numbers for each analyte were 20 (Mg), 40 (ALP, ALT, Ca, Chol, CK, Cl, K, Na, P, and Trig), or 60 (BUN, Ca, Crea, Glu, TBili, and TP).
Samples for method comparison were submitted in lithium heparin-anticoagulated (general chemistry tests) or EDTA-anticoagulated (ammonia) tubes. All tubes were centrifuged (5ºC; 1,500 × g; 10 min) prior to removing the plasma. Each plasma sample was divided and loaded on both analyzers within 5 min of one another and with the run sequences randomized. Samples with “abnormal” readings for lipemia, icterus, or hemolysis on the reference wet chemistry analyzer were excluded (>5.65 mmol/L [500 mg/dL] lipid, >684 µmol/L [40 mg/dL] bilirubin, or >5 g/L [500 mg/dL] hemoglobin). Dilutions were not performed when a result was outside the reportable range of the in-clinic dry chemistry analyzer, and these results were excluded from analysis.
Deming linear regression was used to determine the line of best fit between the methods for each analyte and species, including the constant error (y-intercept) with 95% confidence intervals (CIs) and proportional error (slope) with 95% CI. For each analyte, the species-specific lines of best fit with 95% confidence curves (CCs) were plotted on the same graph to visually assess the presence or absence of overlaying 95% CCs across the species. The y-intercept 95% CIs, slope 95% CIs, and 95% CCs were used to determine if results from each analyte could be combined across species. Data from different species with overlapping CIs and CCs were combined, but data with non-overlapping CIs and CCs were analyzed separately.
Data sets were assessed for normality using the Shapiro–Wilk W test, and then compared using the 2 sample 2-tailed t-test and Pearson correlation (parametric data sets), or the Wilcoxon rank-sum test and Spearman rho (nonparametric data sets). Datasets showing statistical proportional error using Deming regression analysis (see below) were excluded from t-test and Wilcoxon analyses, whereas statistical significance was set at p ⩽ 0.05 for datasets with no detectable proportional error. Correlation coefficients were interpreted as very high (0.9–1), high (0.70–0.89), moderate (0.50–0.69), low (0.30–0.49), or no (<0.30) correlation.
Deming regression was used to plot the line of best fit, and identify proportional (slope and 95% CI) and constant (y-intercept and 95% CI) biases. Bland–Altman analysis was used to create bias plots, and determine the mean bias, 95% limits of agreement, and percent within the limits of agreement.
Results
Imprecision
Most within-run and between-run CVs were <5%, with the following exceptions: within-run CVs at the lower ALP activity and NH3 concentration, between-run CVs at the lower ALP activity, ALT activity, NH3 concentration, and TBili concentration, and both within-run and between-run CVs at the higher concentration of NH3 (Supplementary Table 1). For the reference wet chemistry analyzer, most between-run CVs were <5%, except at the lower ALP activity and NH3 concentration (Supplementary Table 2).
Observed total error and sigma metrics
TEobs was less than TEa for 11 analytes at lower and 11 analytes at higher concentrations and activities. TEobs exceeded TEa for the remaining analytes at their respective concentrations (Supplementary Table 1).
Sigma metrics were good, excellent, or world-class (σ > 4) at lower concentrations or activities of 6 analytes, and at higher concentrations or activities of 9 analytes (Supplementary Table 1). The remaining σ values were <3 or could not be calculated (Supplementary Table 1). The σ of Alb at 19 g/L and Crea at 88.4 µmol/L could not be calculated because there was no detectable imprecision at these concentrations (i.e., CV = 0.0%).
Method comparison
After excluding samples with ‘abnormal’ lipemia, icterus, or hemolysis results on the reference wet chemistry analyzer, 31 canine, 26 equine, and 25 feline blood samples were included in the study. Results that were excluded for exceeding the reportable range of the in-clinic dry chemistry analyzer were 2 ALP values and 1 result of each Ca, CK, TBili, and Trig.
Based on species-specific Deming regression analysis (data not shown), data from different species were combined for most analytes (canine, equine, and feline samples = BUN, Ca, CK, Cl, Crea, Glu, K, Na, NH3, TBili, and TP; canine and feline samples = Alb, ALP, ALT, Chol, GGT, P, and Trig) and isolated for fewer analytes (equine samples = Alb, GGT, and Mg) for the method comparison study.
The distributions of paired datasets were nonparametric or a combination of parametric and nonparametric, except for P and Ca distributions, which were parametric for both methods. Because most paired datasets were not parametric, and to simplify data presentation, medians and ranges for all datasets were derived (Supplementary Table 3). Datasets from the in-clinic dry and reference wet chemistry analyzers were significantly different (p ⩽ 0.05) for Na and NH3, but datasets for other analytes could not be calculated or were not statistically different (p > 0.05) between analyzers (Supplementary Table 3). Correlation coefficients were very high or high (r = 0.70–1) for all analyte datasets, except GGT and Na (Supplementary Table 3).
Results of all analytes showed various degrees of statistical and graphical differences (Supplementary Table 4, Figs. 1–4). Positive proportional biases were observed for ALT, Crea, and equine GGT results, whereas negative proportional bases were identified for BUN, Ca, Chol, CK, Cl, TBili, TP, Trig, equine Alb, and canine and feline GGT results. Positive constant biases were observed for Alb, ALP, Ca, Chol, Cl, P, TBili, TP, and Trig. Only NH3 results showed negative constant bias. Mean bias was positive for ALP, ALT, Ca, Cl, Crea, Mg, Na, P, TBili, TP, canine and feline Alb, and equine GGT, but negative for BUN, Chol, CK, K, NH3, Trig, and canine and feline GGT. Datasets for all analytes had ⩽50% of their individual results within their respective 95% limit of agreement (95% LOA).
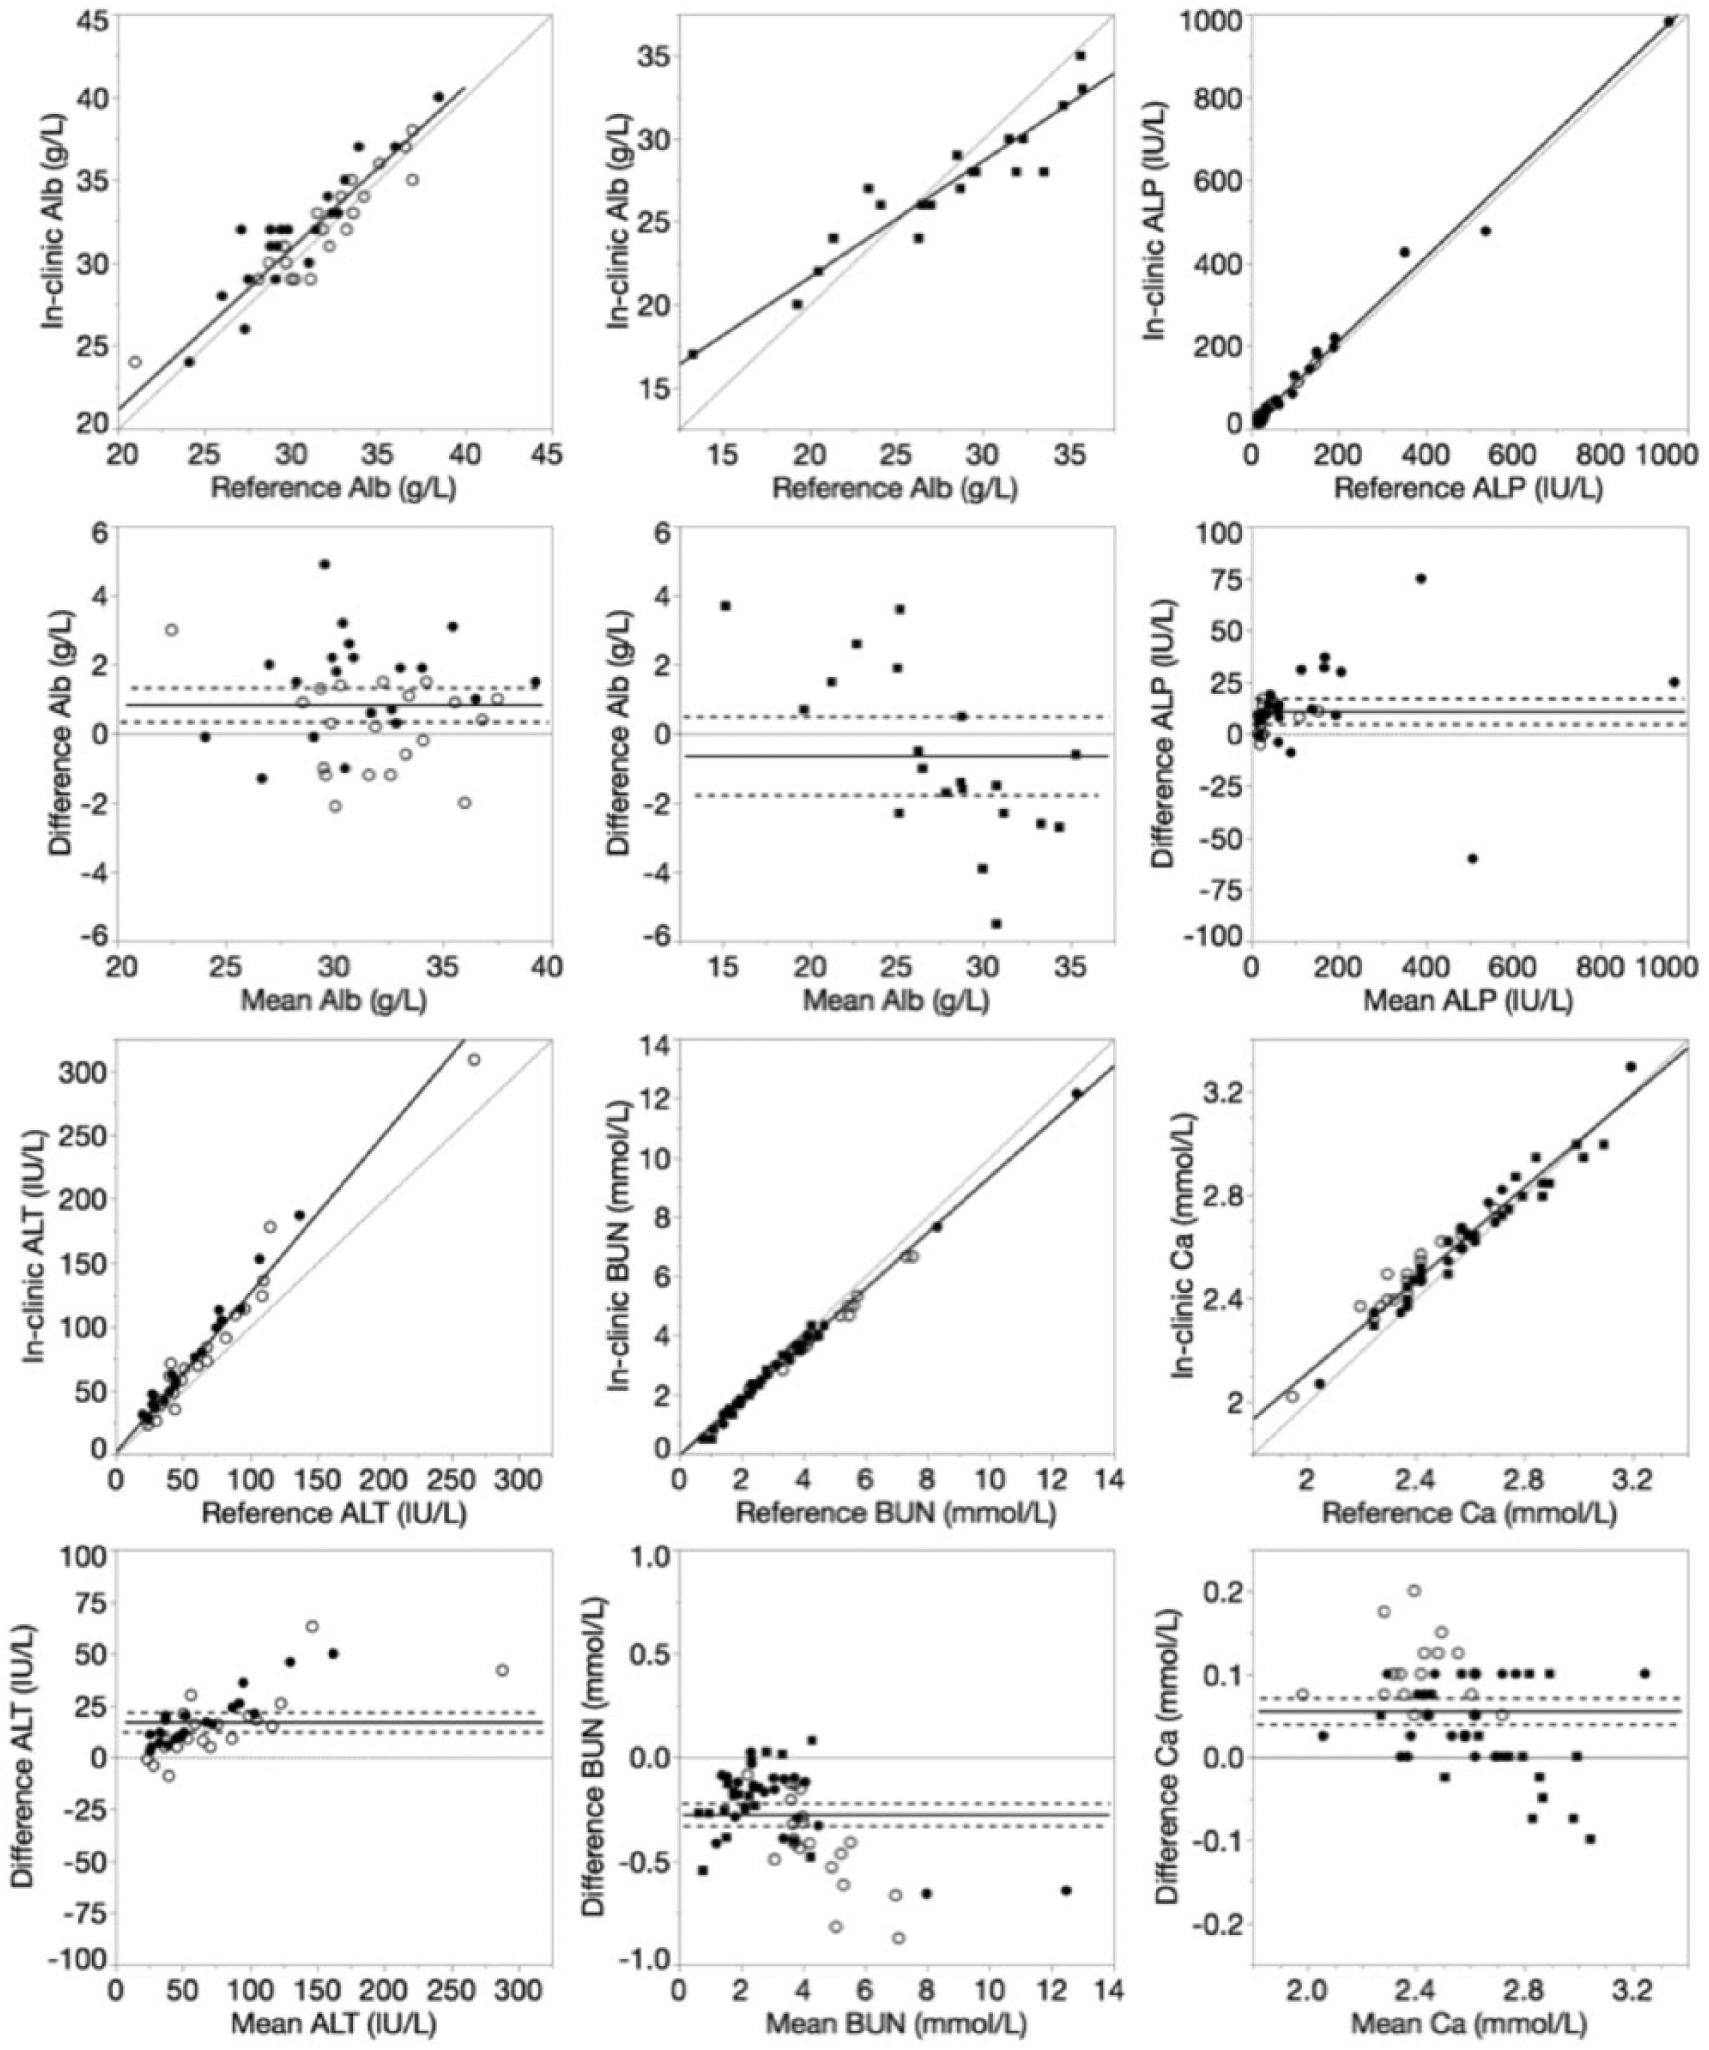
Deming regression and Bland–Altman plots of albumin (Alb), alkaline phosphatase (ALP), alanine aminotransferase (ALT), blood urea nitrogen (BUN), and calcium (Ca) for the in-clinic dry chemistry analyzer relative to the reference wet chemistry analyzer. Data points were derived from canine (closed circle), equine (closed square), or feline (open circle) plasma samples. For Deming regression plots, lines of identity (y = x, dotted) and lines of best fit (solid) are plotted. For Bland–Altman plots, lines of no bias (y = 0, dotted), mean bias (solid), and 95% limits of agreement (dashed) are plotted.
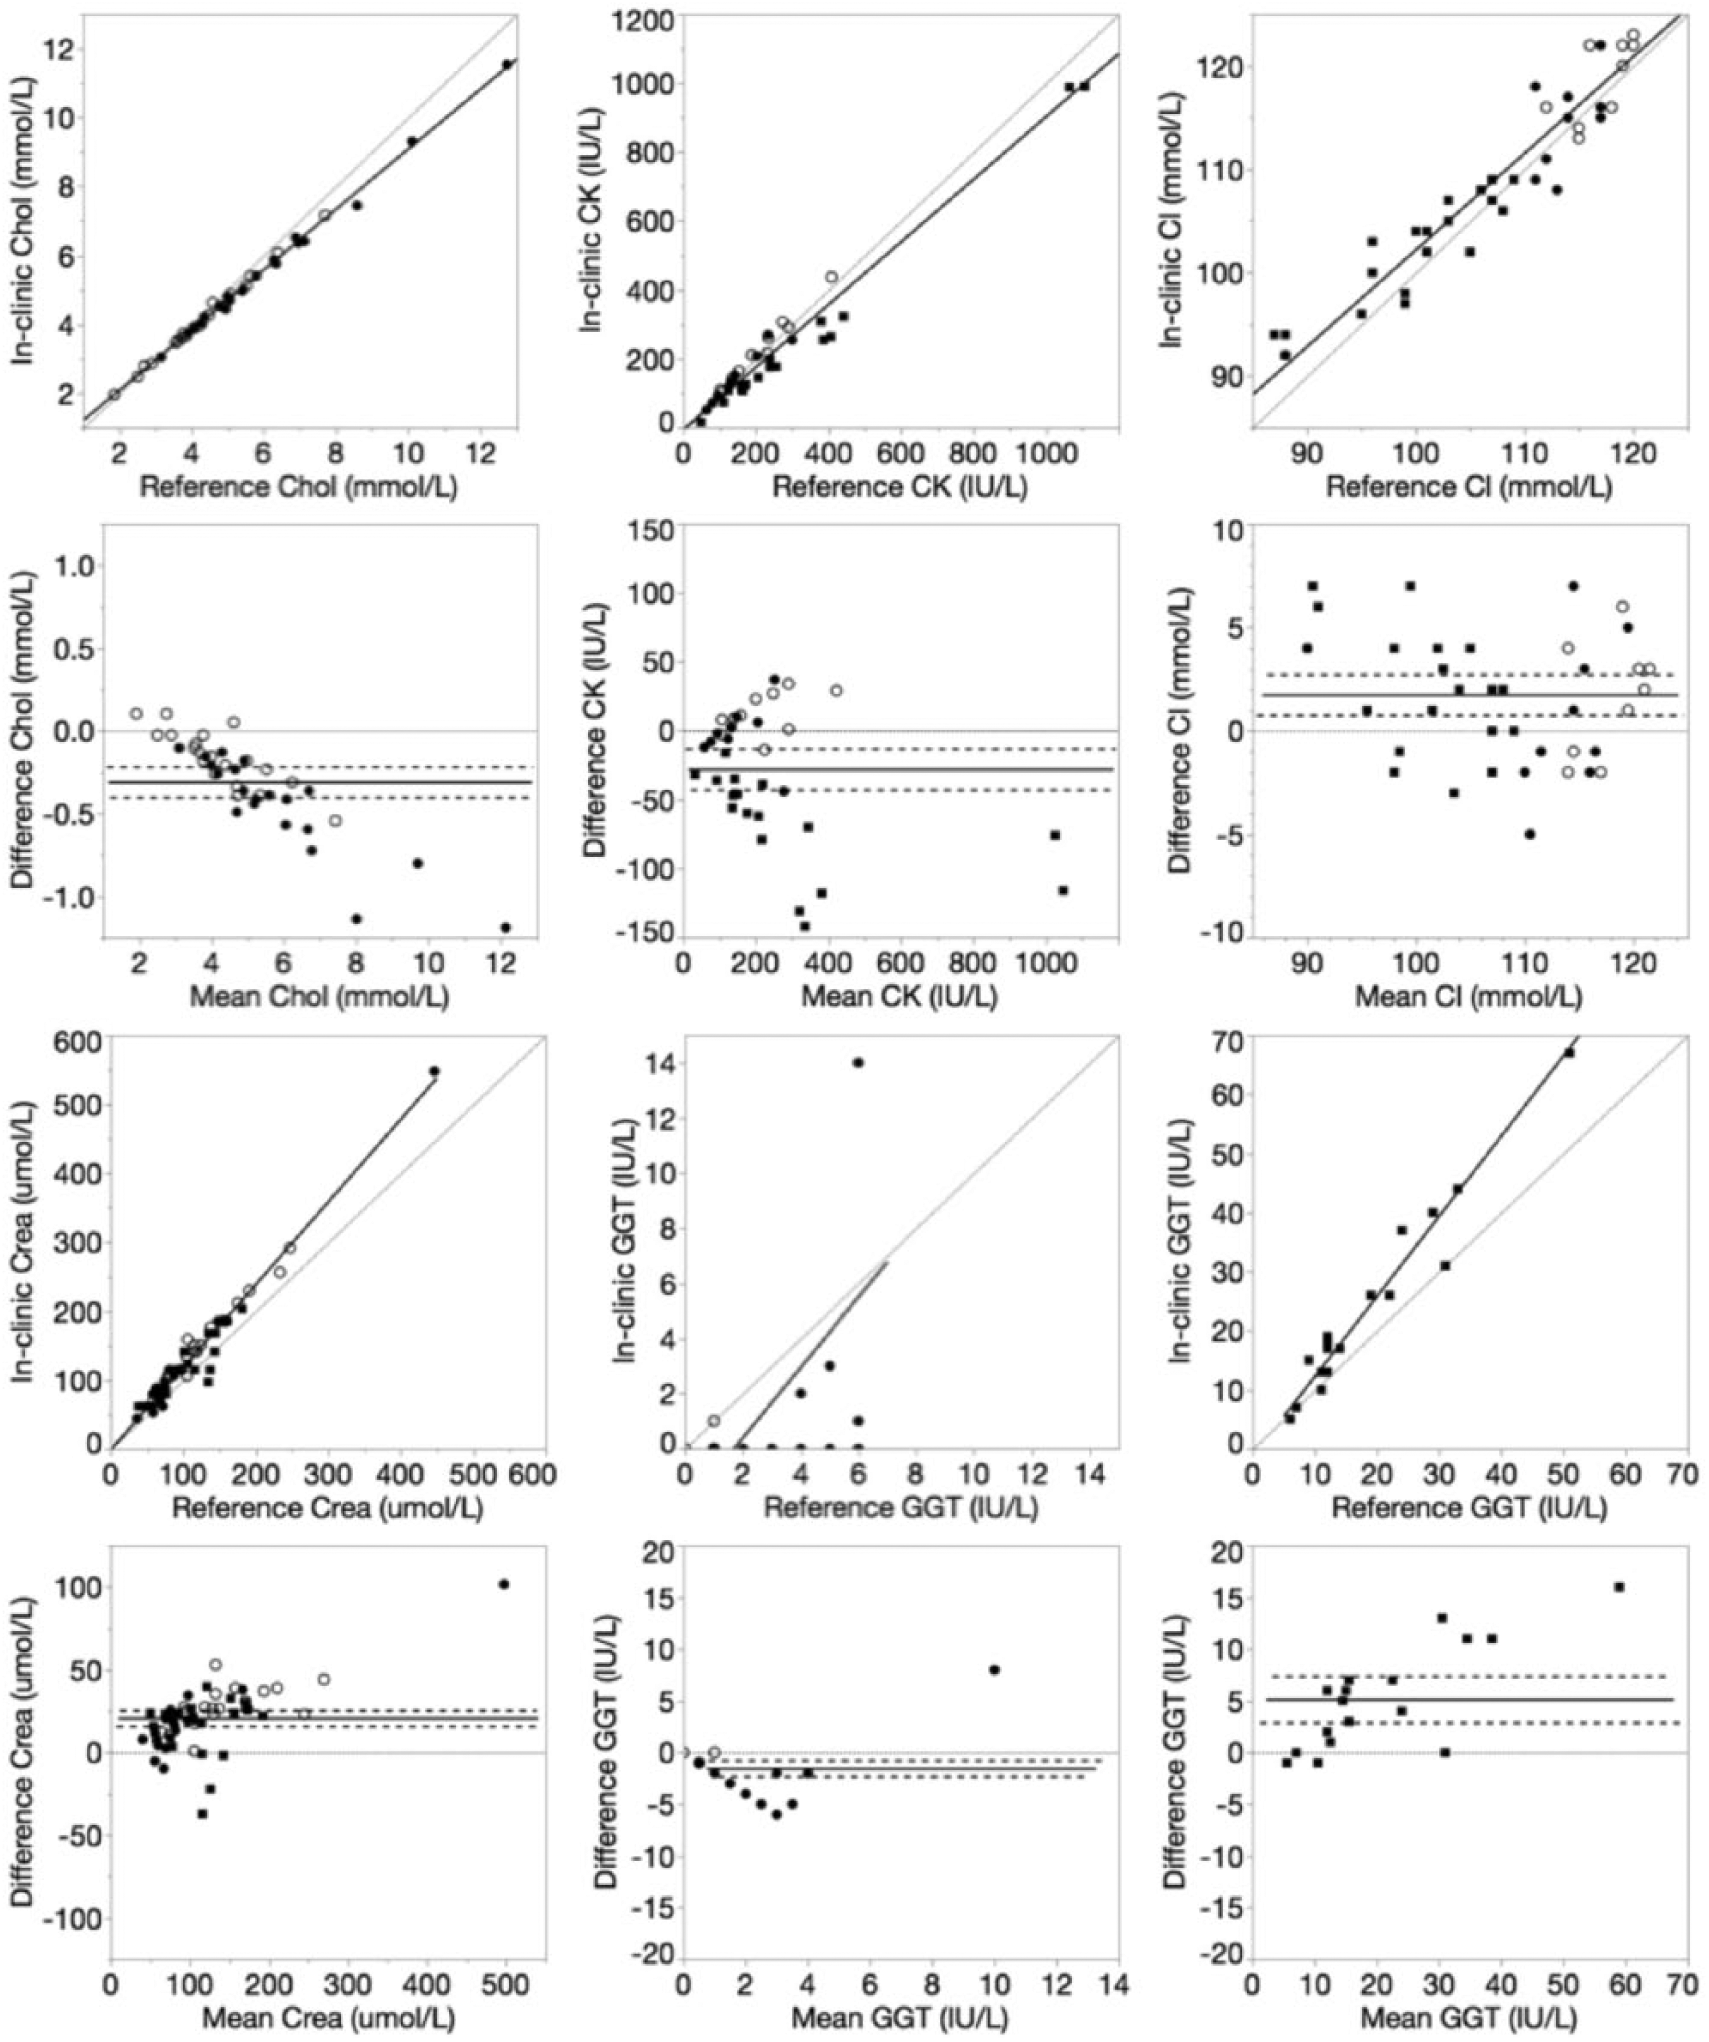
Deming regression and Bland–Altman plots of cholesterol (Chol), creatine kinase (CK), chloride (Cl), creatinine (Crea), and gamma-glutamyl transferase (GGT) for the in-clinic dry chemistry analyzer relative to the reference wet chemistry analyzer. Data points were derived from canine (closed circle), equine (closed square), or feline (open circle) plasma samples. For Deming regression plots, lines of identity (y = x, dotted) and lines of best fit (solid) are plotted. For Bland–Altman plots, lines of no bias (y = 0, dotted), mean bias (solid), and 95% limits of agreement (dashed) are plotted.
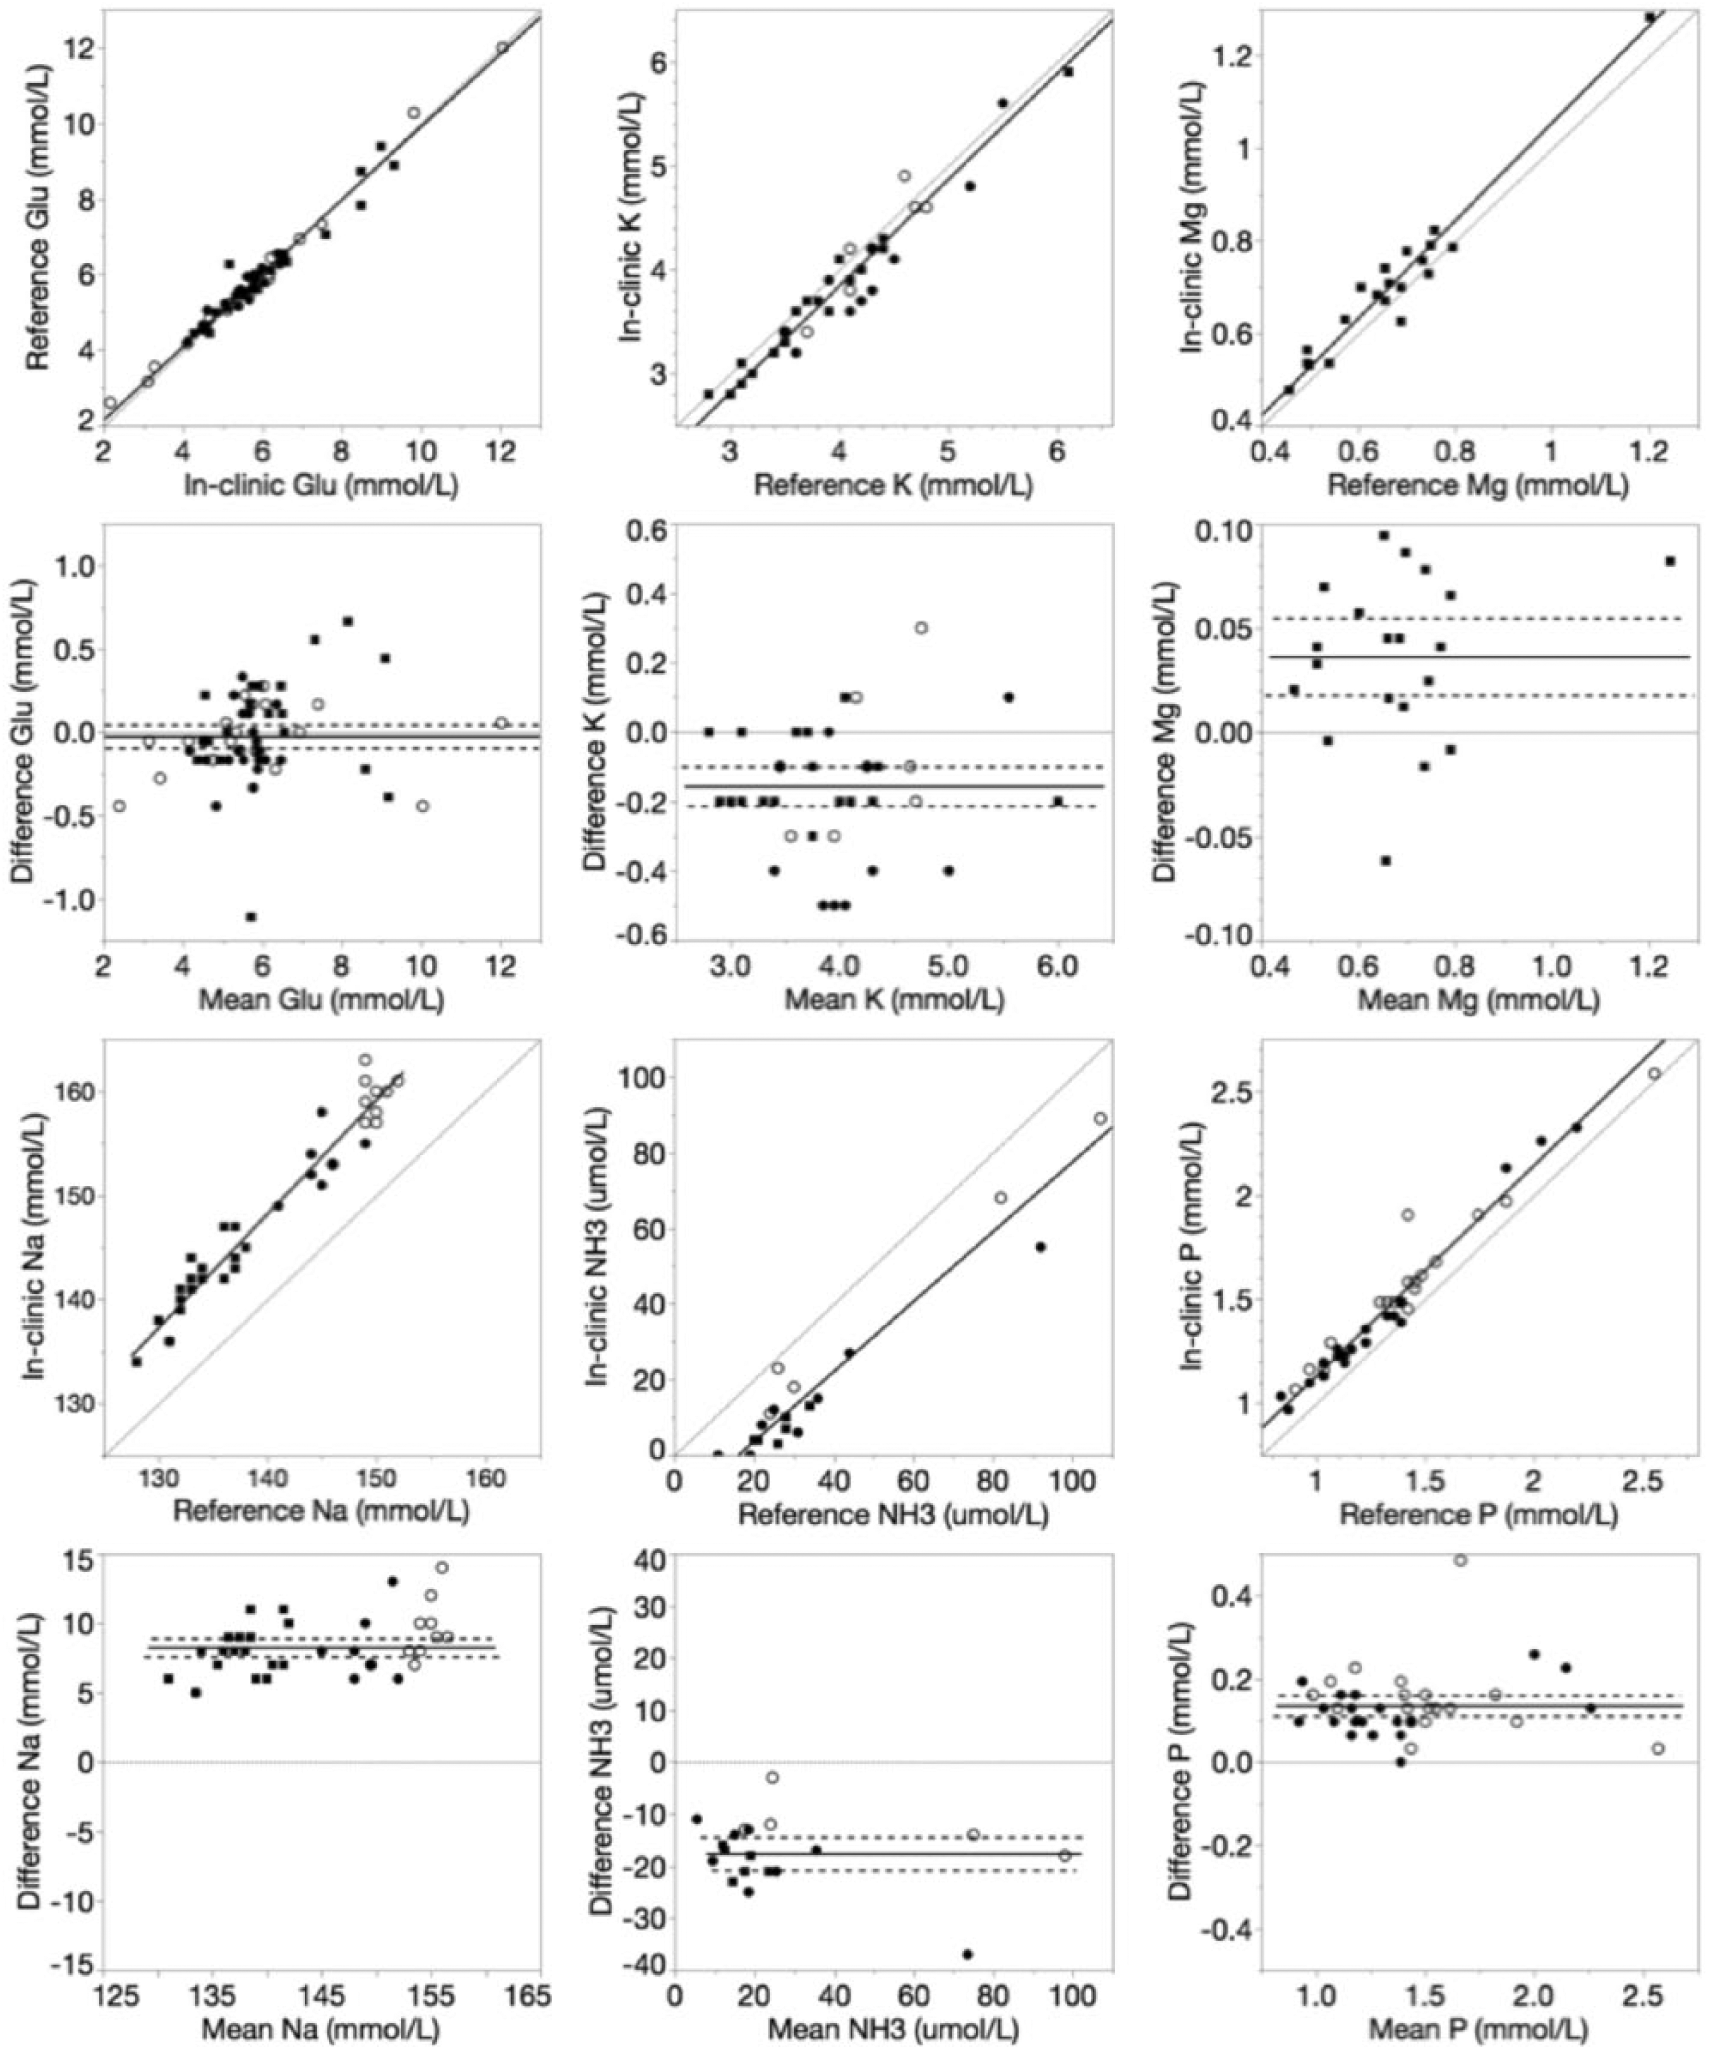
Deming regression and Bland–Altman plots of glucose (Glu), potassium (K), magnesium (Mg), sodium (Na), ammonia (NH3), and phosphorus (P) for the in-clinic dry chemistry analyzer relative to the reference wet chemistry analyzer. For Deming regression plots, lines of identity (y = x, dotted) and lines of best fit (solid) are plotted. For Bland–Altman plots, lines of no bias (y = 0, dotted), mean bias (solid), and 95% limits of agreement (dashed) are plotted.
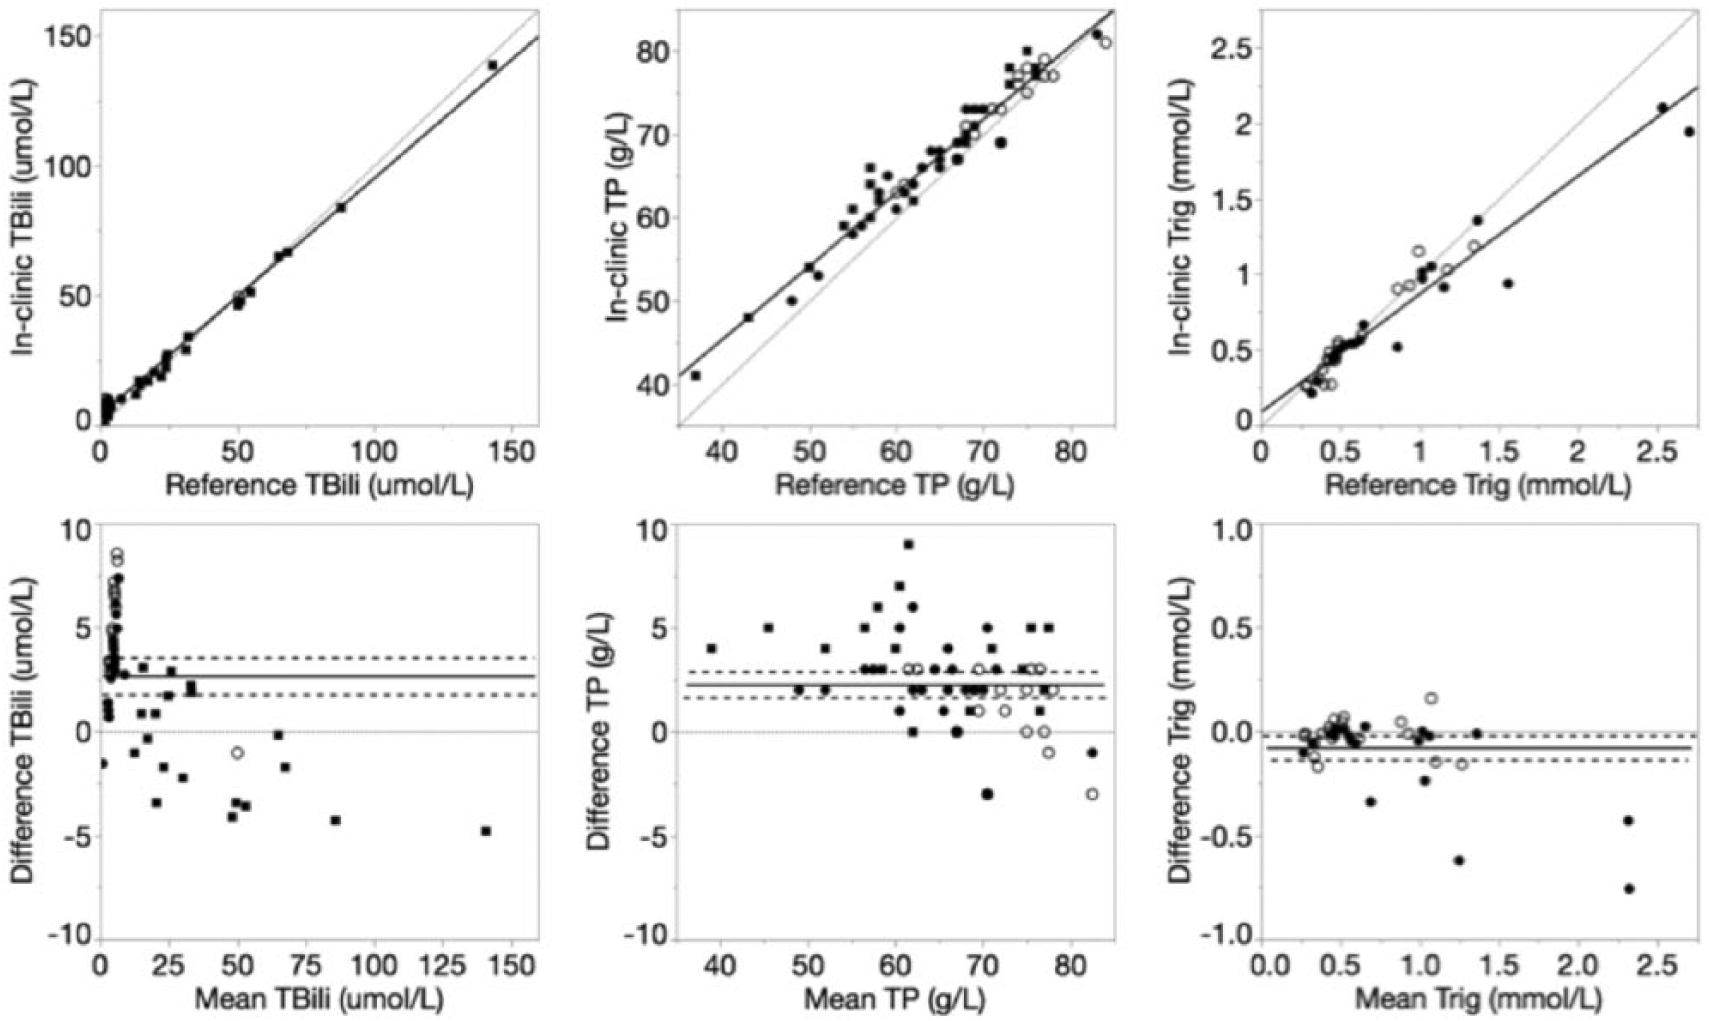
Deming regression and Bland–Altman plots of total bilirubin (TBili), total protein (TP), and triglyceride (Trig) for the in-clinic dry chemistry analyzer relative to the reference wet chemistry analyzer. For Deming regression plots, lines of identity (y = x, dotted) and lines of best fit (solid) are plotted. For Bland–Altman plots, lines of no bias (y = 0, dotted), mean bias (solid), and 95% limits of agreement (dashed) are plotted.
Discussion
Performance characteristics that were assessed included the analyzer’s imprecision (CV%), bias (bias%), total error in relationship to published quality guidelines (TEobs vs. TEa), and sigma metrics (σ). 4 These performance characteristics can aid in selection of appropriate in-clinic QC protocols. Our method comparison study to the reference wet chemistry analyzer helped identify differences in results that could influence clinical interpretation and case management, but does not by itself prove which method is more accurate.
Quality specifications for minimum CV have been published for some routine serum biochemical analytes in dogs (ALT, ALP, Alb, Chol, Crea, Glu, K, and TP), but quality specifications for other analytes in veterinary species have yet to be established. 4 Based on the veterinary guidelines, the in-clinic dry chemistry analyzer meets minimum precision specifications for lower concentrations or activities of Alb, ALT, Chol, Crea, Glu, and TP, and higher concentrations or activities of ALP, ALT, Chol, Crea, Glu, K, and TP. Estimates of imprecision at the lower ALP activity (mean: 34 IU/L; CVobs: 7.51%), lower K concentration (mean: 2.7 mmol/L, CVobs: 3.46%), and higher Alb concentration (mean: 40 g/L; CVobs: 1.90%) exceeded the published minimum precision specifications. However, these deviations were mild, and considered clinically acceptable at their respective plasma activities or concentrations. The point-of-care analyzer therefore has high measurement precision for most analytes, and moderate precision for the remaining analytes when analyzing the specified QCMs in the Methods section. However, to optimize QCM shelf-life, QCMs often have different physical and chemical properties relative to plasma. Repeat analysis of pooled species-specific patient plasma or serum is therefore required to quantify analytical precision in each species.
Nine analytes (Ca, Chol, Glu, Mg, Na, P, TBili, TP, and Trig) had TEobs values less than published TEa guidelines for both levels of QCM, indicating that statistical QC may be employed to monitor the performances of these assays. 2 This would require selection of appropriate QC rules using QC validation tools, the σ metric, and desired probabilities of error detection (Ped) and false rejection (Pfr). 2 Alternatively, use of the QC rule 13s has been recommended if Ped ⩾ 85% and Pfr ⩽ 5% can be achieved. 2 TEobs for 10 analytes (Alb, ALP, ALT, BUN, CK, Cl, Crea, GGT, K, and NH3) exceeded TEa at one or both levels of QCM. This indicates that the analyzer’s performance for these assays should be monitored by non-statistical methods, through comparability testing, or by participating in an external quality assessment program. 2 Non-statistical methods for monitoring analyte results include analyzing the sample in duplicate, interpreting analyte results in conjunction with medical knowledge of the patient’s disease, and monitoring trends in the patient’s data. 2
In addition to being used in QC rule selection, the σ results gauge assay performance relative to veterinary serum biochemical guidelines for TEa. 4 Five analytes (Chol, Glu, Mg, TP, and Trig) achieved σ values >3 at both levels of QCM, which suggests acceptable analytical performance through a wide range of analyte concentrations. The relatively lower performance of the other analytes that showed variable or consistently lower σ values was mostly attributed to substantial mean biases.
In our methods comparison study, the lack of statistical and graphical biases for Glu measurements indicates Glu patient results and population-based reference intervals should have high agreement between the 2 analyzers. However, the presence of various degrees of bias for all other analytes indicates that patient results and reference intervals may not be interchangeable.
Analytes with more noteworthy biases included GGT, Na, and NH3. Relative to the reference wet chemistry analyzer, the in-clinic dry chemistry analyzer had a positive bias in equine samples and negative bias in canine and feline samples. The low agreement in small animal samples may be partially attributed to the narrow result range and the relatively low numbers of abnormal results (reference wet chemistry analyzer reference intervals: canine, 1–5 IU/L; feline, 0–0 IU/L). Additional studies are needed to assess agreement of results at increased activities of GGT in small animals. Relative to other analyte results, Na and NH3 had more significant positive and negative constant biases, respectively. This underscores the importance of instrument-specific reference intervals for these and all analytes. In addition, serial analysis of samples to monitor health and disease progression in an individual patient should be performed using the same analyzer.
Study limitations included 1) the use of QCM instead of pooled patient samples for determining estimates of imprecision, bias, and total error, and 2) the lack of quality specification guidelines for species other than dogs, and the limited quality specification guidelines available for dogs. Use of species-specific plasma or serum would be especially helpful in identifying any matrix-related effects on sample analysis that could influence data interpretation. Additional investigations into the performance of the in-clinic dry chemistry analyzer should include linearity, recovery, and reportable range studies, as well as investigations into interfering substances.
Supplemental Material
DS1-4_JVDI_10.1177_1040638718809407 – Supplemental material for Evaluation of an in-clinic dry chemistry analyzer for canine, equine, and feline plasma samples
Supplemental material, DS1-4_JVDI_10.1177_1040638718809407 for Evaluation of an in-clinic dry chemistry analyzer for canine, equine, and feline plasma samples by Katie M. Boes, Carolyn A. Sink, Melinda S. Camus and Stephen R. Werre in Journal of Veterinary Diagnostic Investigation
Footnotes
Acknowledgements
We thank the ViTALS staff for technical assistance.
Declaration of conflicting interests
KM Boes and C Sink declare that the in-clinic dry chemistry analyzer was provided to the Virginia-Maryland College of Veterinary Medicine by the manufacturer at a discounted rate, and that some test cartridges were also gifted by the manufacturer. M Camus and S Werre declare no potential conflicts of interest with respect to the research, authorship, and/or publication of this article.
Funding
The authors received no financial support for the research, authorship, and/or publication of this article.
References
Supplementary Material
Please find the following supplemental material available below.
For Open Access articles published under a Creative Commons License, all supplemental material carries the same license as the article it is associated with.
For non-Open Access articles published, all supplemental material carries a non-exclusive license, and permission requests for re-use of supplemental material or any part of supplemental material shall be sent directly to the copyright owner as specified in the copyright notice associated with the article.