
Abstract
A wet-chemistry biochemical analyzer was assessed for in-practice veterinary use. Its small size may mean a cost-effective method for low-throughput in-house biochemical analyses for first-opinion practice. The objectives of our study were to determine imprecision, total observed error, and acceptability of the analyzer for measurement of common canine and feline serum analytes, and to compare clinical sample results to those from a commercial reference analyzer. Imprecision was determined by within- and between-run repeatability for canine and feline pooled samples, and manufacturer-supplied quality control material (QCM). Total observed error (TEobs) was determined for pooled samples and QCM. Performance was assessed for canine and feline pooled samples by sigma metric determination. Agreement and errors between the in-practice and reference analyzers were determined for canine and feline clinical samples by Bland–Altman and Deming regression analyses. Within- and between-run precision was high for most analytes, and TEobs(%) was mostly lower than total allowable error. Performance based on sigma metrics was good (σ > 4) for many analytes and marginal (σ > 3) for most of the remainder. Correlation between the analyzers was very high for most canine analytes and high for most feline analytes. Between-analyzer bias was generally attributed to high constant error. The in-practice analyzer showed good overall performance, with only calcium and phosphate analyses identified as significantly problematic. Agreement for most analytes was insufficient for transposition of reference intervals, and we recommend that in-practice–specific reference intervals be established in the laboratory.
Introduction
Continuous advancement in diagnostic technology has increased both instrument reliability and the frequency of its in-house use in veterinary clinical practice. Hematology and biochemistry analyzers are the most frequently employed in first-opinion practice and have the advantages of being rapid and mostly cost-effective. Dry-chemistry analyzers are generally considered more cost-effective than wet-chemistry analyzers for low-throughput applications. For reference laboratories with high numbers of samples, large wet-chemistry analyzers offer significant savings given low reagent cost. The relatively rapid expiration of these reagents once opened precludes their use in low-throughput laboratories, however, because significant wastage would offset any savings. A smaller wet-reagent analyzer a is available for veterinary in-house use, although, at present, independent performance evaluation studies have not been published, to our knowledge. The aims of this study were 1) to determine the precision, total observed error (TEobs), and acceptability of the in-practice analyzer for measuring 12 common canine and feline serum biochemical analytes and 2) to compare the results obtained from clinical samples using the in-practice analyzer to those generated from a reference commercial, high-throughput wet-chemistry analyzer. b
Materials and methods
Samples
Blood samples from 66 dogs and 59 cats submitted to the Diagnostic Laboratories (University of Bristol, Langford, Bristol, UK) between March 2013 and March 2014 were included in the study. The samples included those for routine pre-anesthetic screening as well as investigation of a wide range of clinical signs and diseases. Whole blood submitted for biochemical analysis in nonanticoagulant (plain) tubes c was allowed to clot and then centrifuged (4°C; 2,000 × g; 5 min) before removal of the serum fraction. Excess serum from clinical samples following analysis was frozen at −20°C for up to 1 year and used in the study with owners’ consent.
Pooled serum samples were also created for both species using excess serum from stored clinical samples. For simplicity, a single pooled sample from each species was used rather than multiple samples with different concentrations for all of the different analytes. Canine and feline pooled samples were created by mixing several samples containing within- or near-reference concentrations for all analytes in this study, as determined by the reference chemistry analyzer.
Samples that were grossly hemolyzed were excluded from the study. Samples that were grossly lipemic were analyzed without modification for cholesterol concentration; these samples were centrifuged at high speed (12,000 × g for 5 min) and the lipid layer removed before further biochemical analysis. Icteric samples with total bilirubin concentrations >340 µmol/L, as measured by the reference chemistry analyzer, were excluded from the study to avoid interference with phosphate measurements, according to the manufacturer’s instructions.
On the day of testing, frozen serum samples were placed in a water bath (37°C) for 5–10 min to thaw, and then remained at room temperature (23°C, range: 22–25°C) not longer than 1 hour before testing. Analyzer calibration, daily checks, and daily control runs were performed according to the manufacturers’ instructions before sample analysis.
Quality control material
Quality control material (QCM) d with low, normal, and high values were included in every run of samples in the reference chemistry analyzer. Two human-derived QCM (Eurocontrol N and Eurocontrol P) a were run daily on the in-practice analyzer. The analyte concentrations in Eurocontrol N were all within the manufacturer-defined reference intervals. Analyte concentrations in Eurocontrol P were abnormal as follows: albumin (ALB), decreased; alkaline phosphatase (ALP), increased; alanine aminotransferase (ALT), increased; calcium (Ca), decreased; cholesterol (Chol), increased; creatinine (Crea), increased; gamma-glutamyl transferase (GGT), increased; glucose (Glu), increased; phosphate (Phos), increased; total bilirubin (TBil), increased; total protein (TP), decreased; urea, increased.
All analyzer reagents were from the same batch to ensure consistency, and all analyses were performed according to the respective manufacturers’ instructions. The accuracy of the reference chemistry analyzer methods was assessed by continuous bimonthly participation in an external quality assurance program (RIQAS, http://www.randox.com/riqas/riqas-eqa-scheme).
Analytes
The following 12 analytes were assessed in this study: ALB, ALP, ALT, Ca, Chol, Crea, GGT, Glu, Phos, TBil, TP, and urea. The methods employed by the 2 analyzers for measurement of these analytes are shown in Table 1.
Methods employed by the in-practice and reference analyzers for biochemical analysis.*
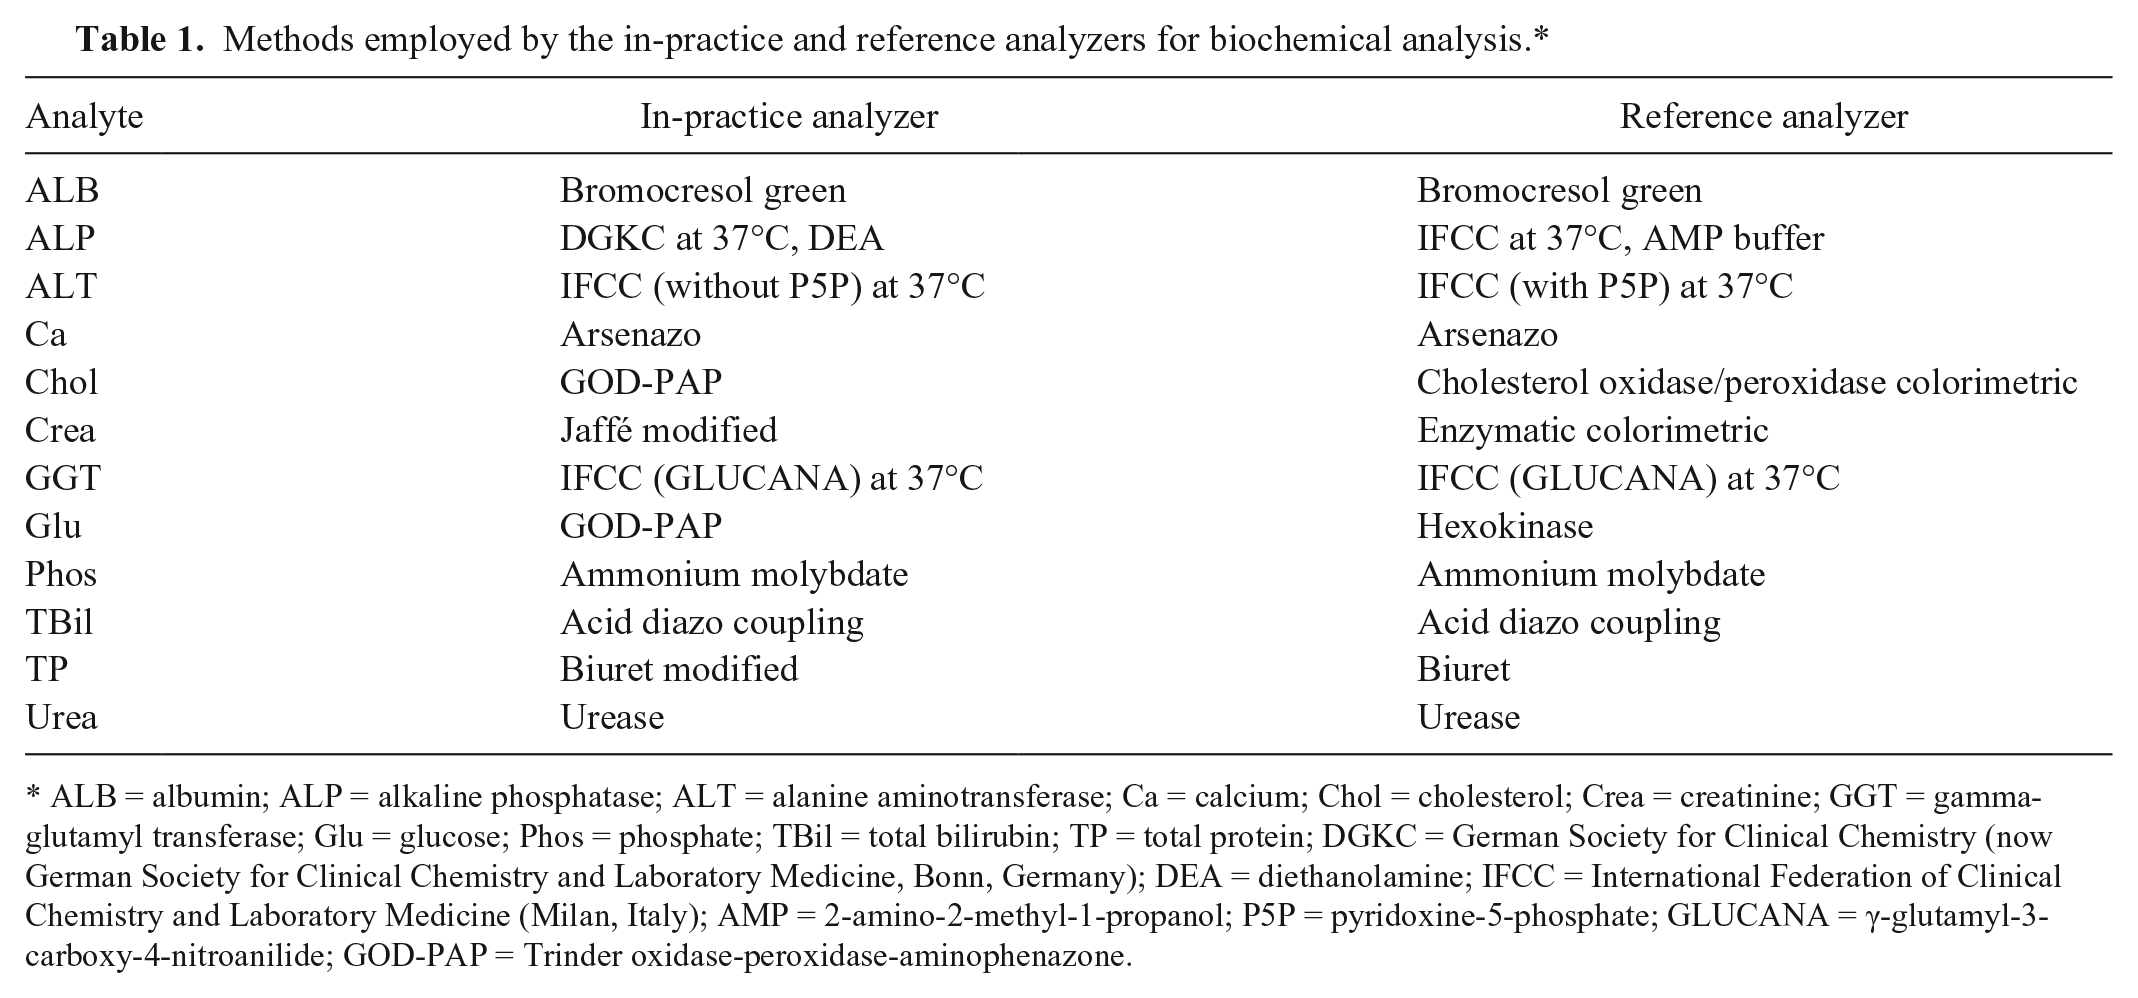
ALB = albumin; ALP = alkaline phosphatase; ALT = alanine aminotransferase; Ca = calcium; Chol = cholesterol; Crea = creatinine; GGT = gamma-glutamyl transferase; Glu = glucose; Phos = phosphate; TBil = total bilirubin; TP = total protein; DGKC = German Society for Clinical Chemistry (now German Society for Clinical Chemistry and Laboratory Medicine, Bonn, Germany); DEA = diethanolamine; IFCC = International Federation of Clinical Chemistry and Laboratory Medicine (Milan, Italy); AMP = 2-amino-2-methyl-1-propanol; P5P = pyridoxine-5-phosphate; GLUCANA = γ-glutamyl-3-carboxy-4-nitroanilide; GOD-PAP = Trinder oxidase-peroxidase-aminophenazone.
Imprecision
The imprecision of the in-practice analyzer was assessed by within- and between-run repeatability using the QCM (Eurocontrol N and P) and the canine and feline serum pools. Within-run repeatability was determined by measuring each analyte in the same sample 10 times sequentially within the same assay run. Between-run repeatability using the serum pools was determined by measuring each analyte in the same pool each day for 5 consecutive days. 4 Between-run repeatability using the QCM was determined from the daily control values generated over a 2-month period (10 measurements).
Method comparison and statistical analysis
Individual clinical samples were run simultaneously on the 2 analyzers to minimize between-analyzer error. Dilutions (1 in 2) were performed in 14 canine and 3 feline samples because the original ALP (11 canine, 1 feline), ALT (2 feline), and GGT (3 canine) results were outside the detection limit of the in-practice analyzer methods. All analyses were performed using the graphing and statistics software Prism. e
Imprecision, TEobs, and sigma metrics
Within- and between-run imprecision was determined by calculation of the coefficient of variation (CV; %), where CV = 100 × standard deviation (SD)/mean. TEobs(%) for each analyte was determined by the following formula: TEobs(%) = 2 × CV + bias(%). 5 Bias(%) for each analyte was calculated using the QCM according to the following formula: bias = (target – measured)/target, where “target” is the mean analyte value reported by the manufacturer, and “measured” is the mean analyte value measured by the in-practice analyzer over a 2-month period. 3 Given that 2 different QCMs (Eurocontrol N and P) were used daily, bias was determined for all analytes from both controls. TEobs(%) for each analyte was assessed in 2 ways: 1) TEobs(%) values for the QCM [TEobs-N(%) and TEobs-P(%)] were calculated for each analyte using the calculated between-run CV for QCM N and P, and the N- and P-specific bias as determined above, respectively and 2) species-specific TEobs(%) for each analyte was calculated using the between-run CV for canine and feline pools, and using QCM bias as determined above. 3 Given that bias was determined for both QCM N and P, species-specific TEobs-N(%) and TEobs-P(%) was calculated for each analyte for comparison. An in-practice analyzer method was considered acceptable if TEobs < total allowable error (TEA). Because published TEA values vary throughout the literature, values were taken from both the guidelines of the American Society for Veterinary Clinical Pathology and a second published study.4,6
Sigma (σ) metric values were calculated according to the following formula: σ = (TEA(%) – bias(%))/CV.2,4,6 TEA values were taken from published studies, bias was taken as the bias for the QCM N, and CV as the between-run CV for the canine and feline pools.4,6 Where the TEA values differed between the 2 published studies, σ for both was calculated to generate σTEA-Low and σTEA-High. Interpretation of σ values was performed as follows: >2: poor; >3: marginal; >4: good; >5: excellent; and >6: world-class.5,8
Method comparison
Data from the clinical samples for all analytes in each species was assessed for normality using D’Agostino and Pearson omnibus tests. When datasets from both analyzers for each analyte and species were normally distributed, data was compared using a Student’s unpaired 2-tailed t-test, with Welch correction for unequal variances as appropriate. A Wilcoxon rank-sum test was otherwise used. Similarly, correlations between the 2 analyzers were performed using Pearson correlation when data for that analyte and species was normally distributed; all other corre-lations were performed using Spearman correlation. Correlation coefficients were interpreted as follows: 0.9–1 very high correlation; 0.70–0.89 high correlation; 0.50–0.69 moderate correlation; 0.30–0.49 low correlation; and <0.30 little, if any, correlation (Zady M, Correlation and simple least squares regression, 2009, https://www.westgard.com/lesson42.htm).
Deming regression analysis was used to determine the mathematical relationship between the 2 analyzers for each analyte and species, and to determine the constant (intercept) and proportional (slope) errors. Bland–Altman analysis was used to assess agreement between the analyzers. 1 Agreement was considered good when the 95% limits of agreement (LOA; ± 2 SD) were narrow, the bias was small, and 95% points fell within the LOA.
Results
Imprecision
All within-run CV values were <10% (Table 2). Between-run CV values were <10% except for Phos (QCM N), ALT (canine serum pool), and Ca (feline serum pool; Table 2). CV values for GGT (feline serum pool) were not reported.
Within- and between-run precision data for quality control material (Eurocontrol N and Eurocontrol P; QCM N and P, respectively) and serum pools using the in-practice analyzer.*
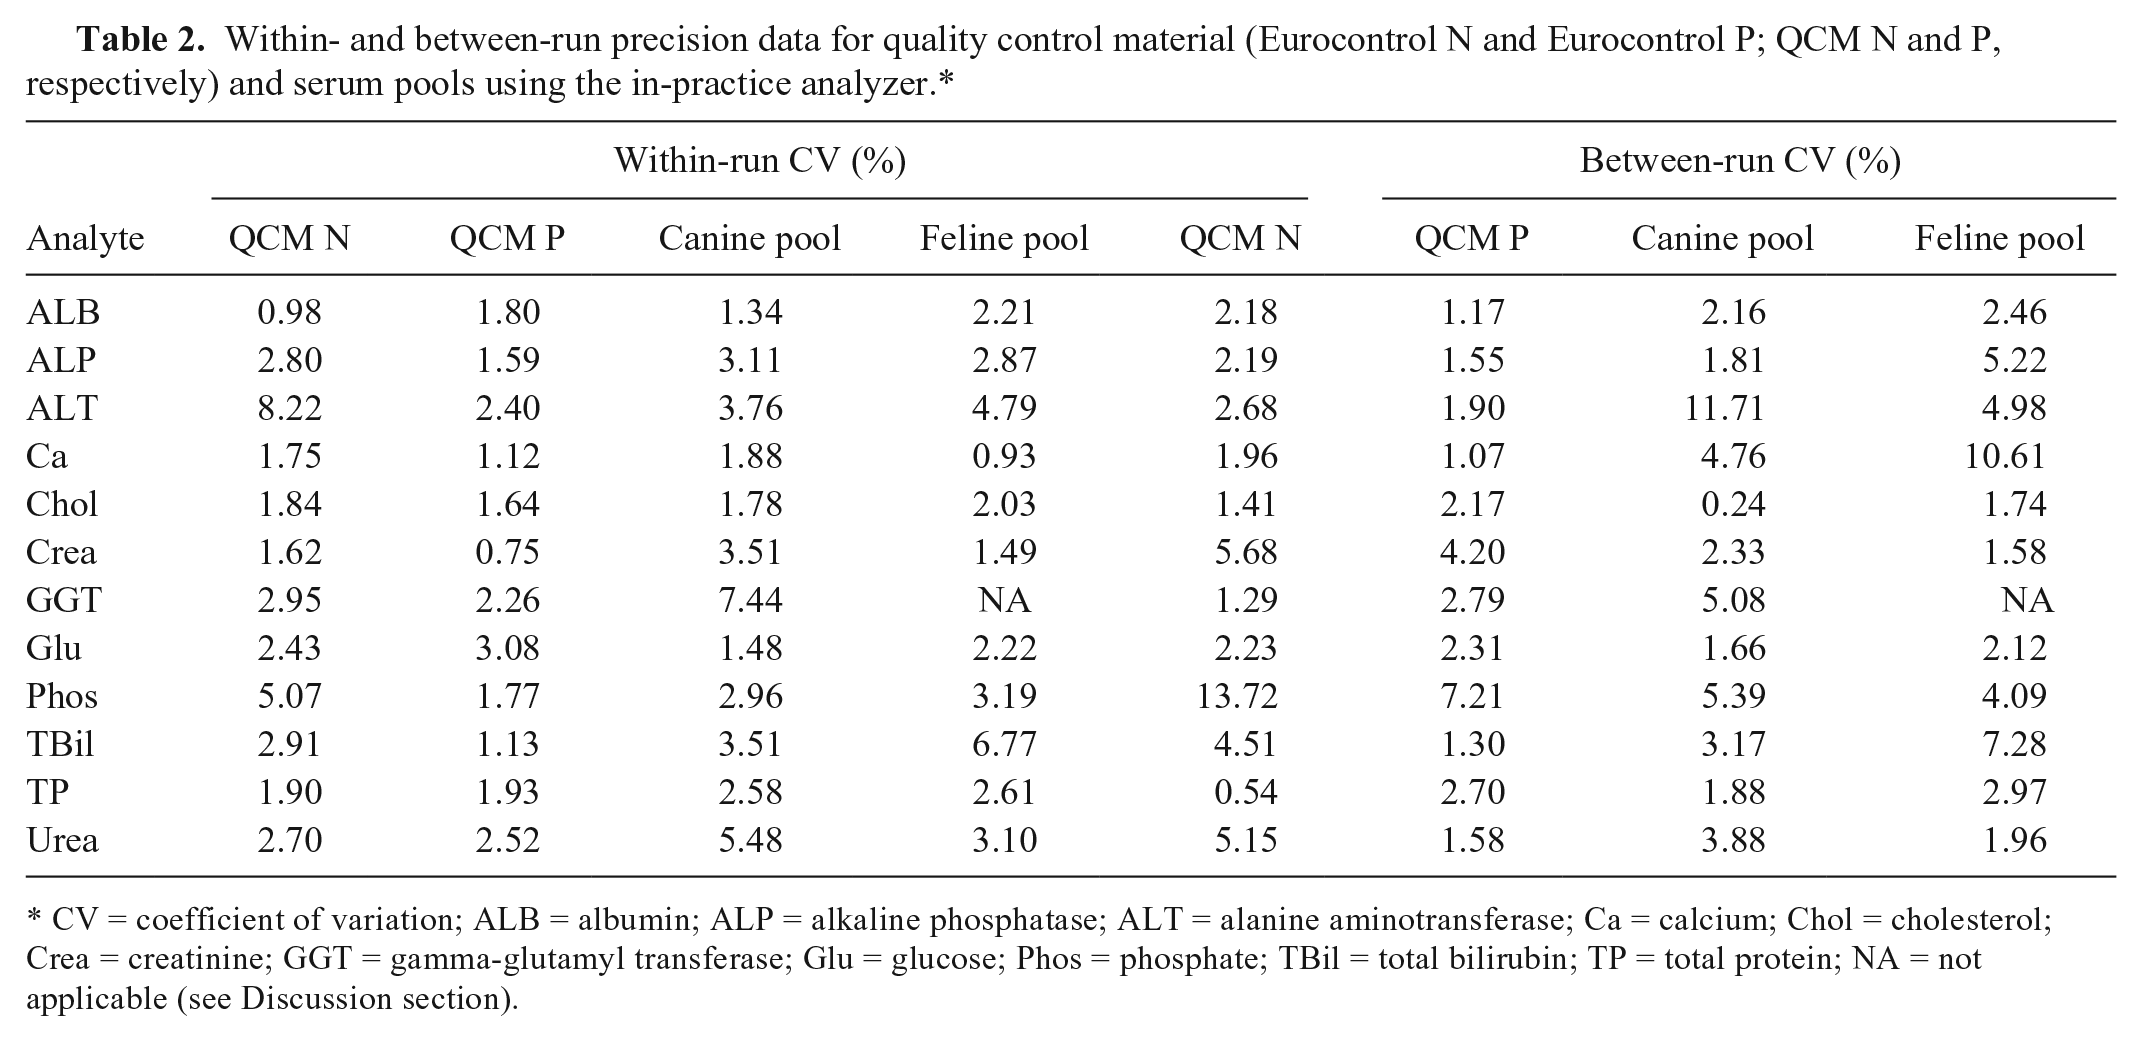
CV = coefficient of variation; ALB = albumin; ALP = alkaline phosphatase; ALT = alanine aminotransferase; Ca = calcium; Chol = cholesterol; Crea = creatinine; GGT = gamma-glutamyl transferase; Glu = glucose; Phos = phosphate; TBil = total bilirubin; TP = total protein; NA = not applicable (see Discussion section).
Quality requirements
All TEobs values were below the lowest published TEA for ALB, ALP, Chol, Crea, GGT, Glu, and TP (Table 3). Analytes for which some TEobs values were over the lower TEA but lower than the higher TEA were ALT and TBil. For Ca and Phos, more than 1 TEobs was above the higher TEA. All σTEA-High were >3 except for Ca, Phos, and TP (feline serum pool only; Table 4). Many σTEA-Low values were also >3; TBil was the only additional analyte with a σTEA-Low <3 in both species.
Quality control material (QCM) bias(%) and total observed error [TEobs(%)] for the in-practice analyzer, together with published total allowable error (TEA).*
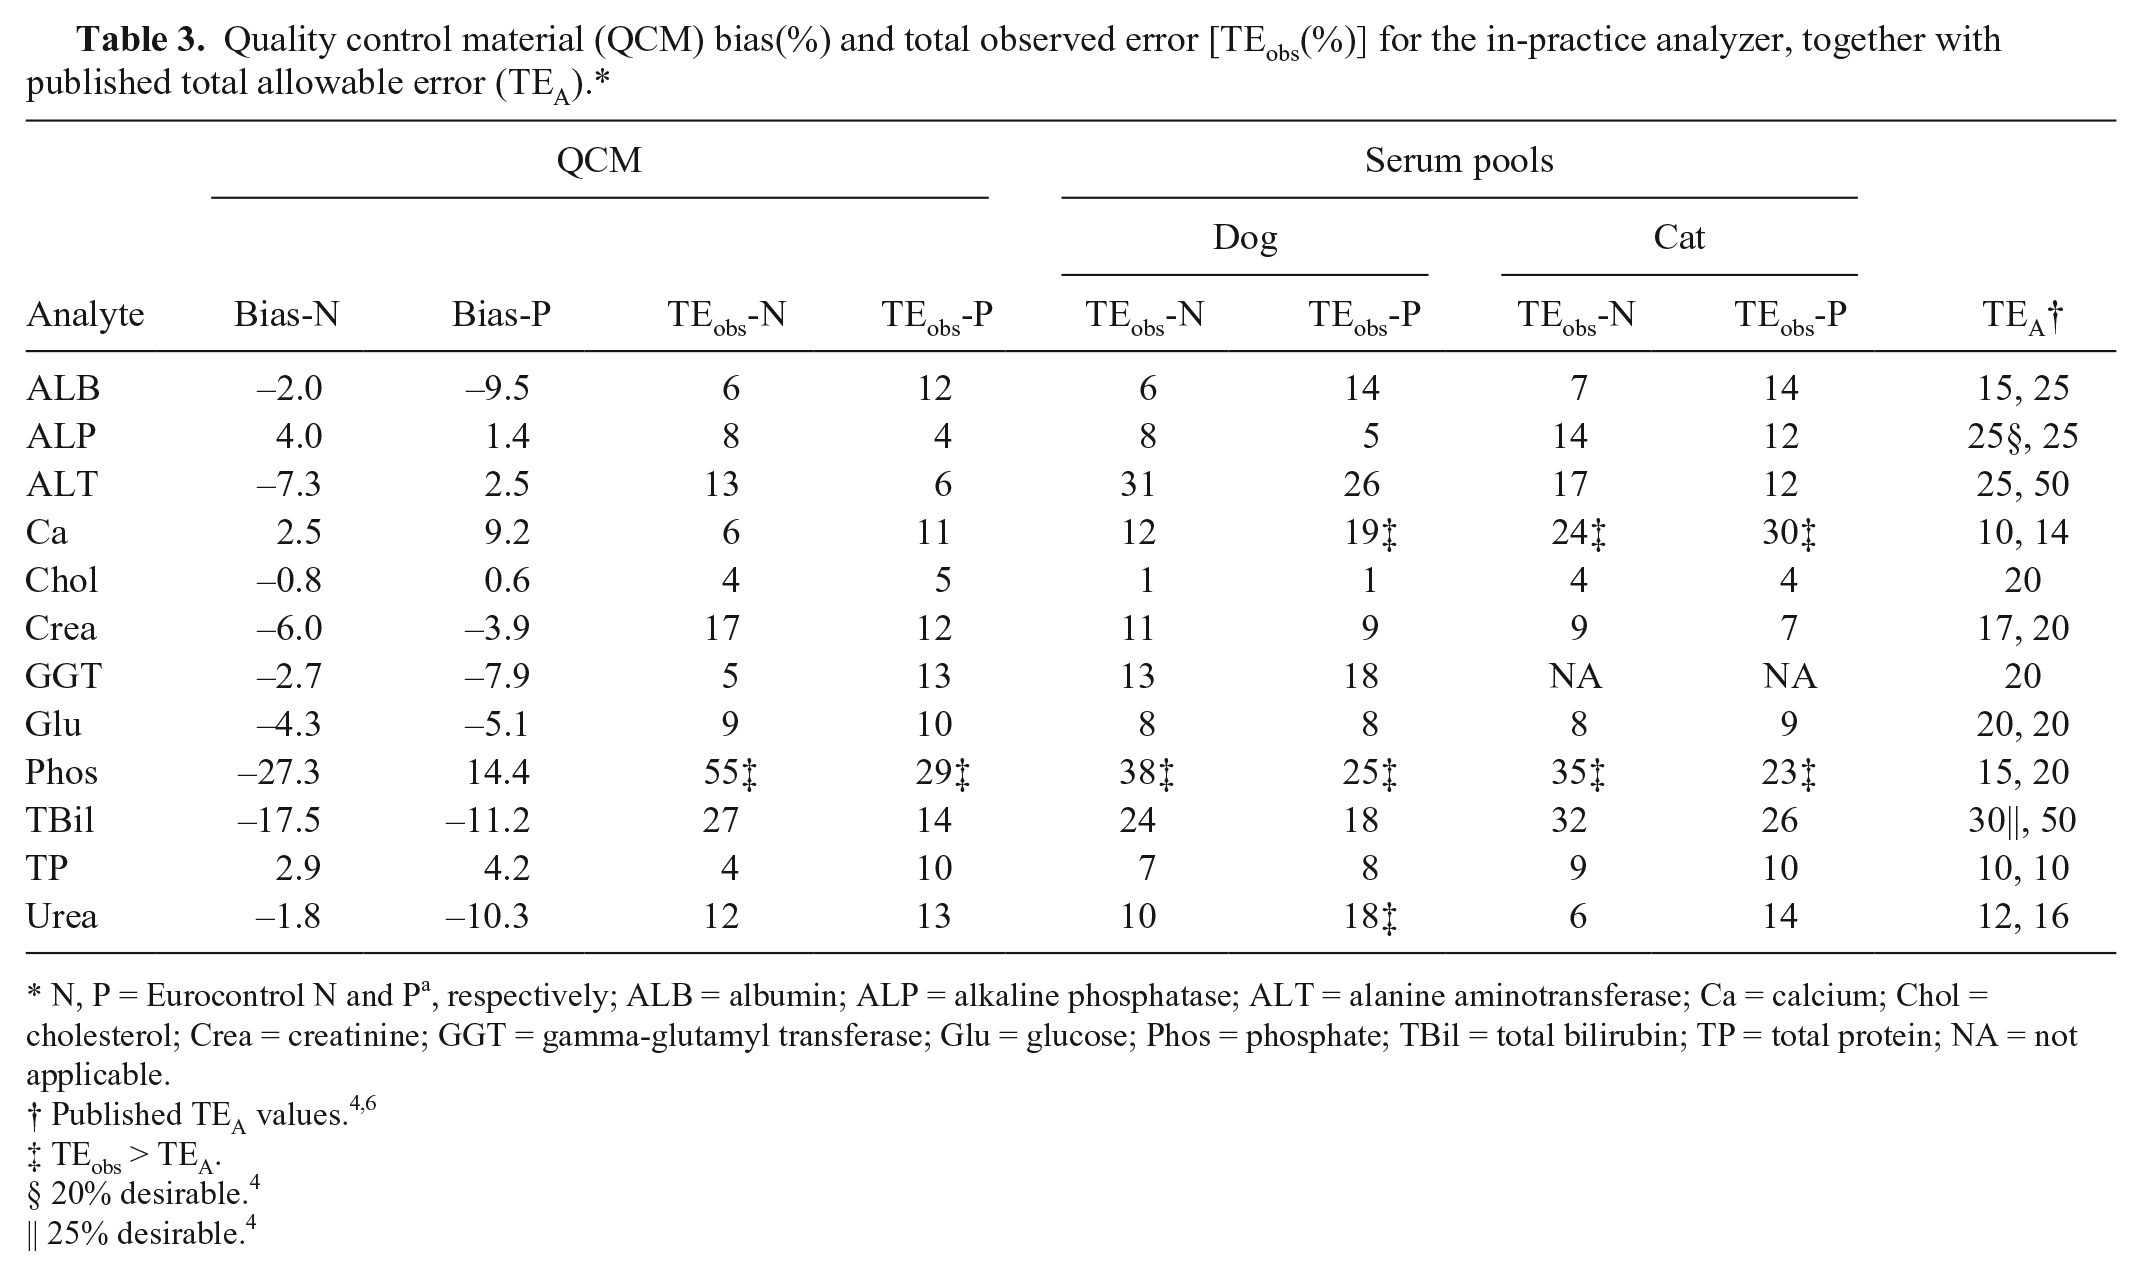
N, P = Eurocontrol N and Pa, respectively; ALB = albumin; ALP = alkaline phosphatase; ALT = alanine aminotransferase; Ca = calcium; Chol = cholesterol; Crea = creatinine; GGT = gamma-glutamyl transferase; Glu = glucose; Phos = phosphate; TBil = total bilirubin; TP = total protein; NA = not applicable.
TEobs > TEA.
20% desirable. 4
25% desirable. 4
Sigma (σ) values for canine and feline pooled serum measured using the in-practice analyzer.*
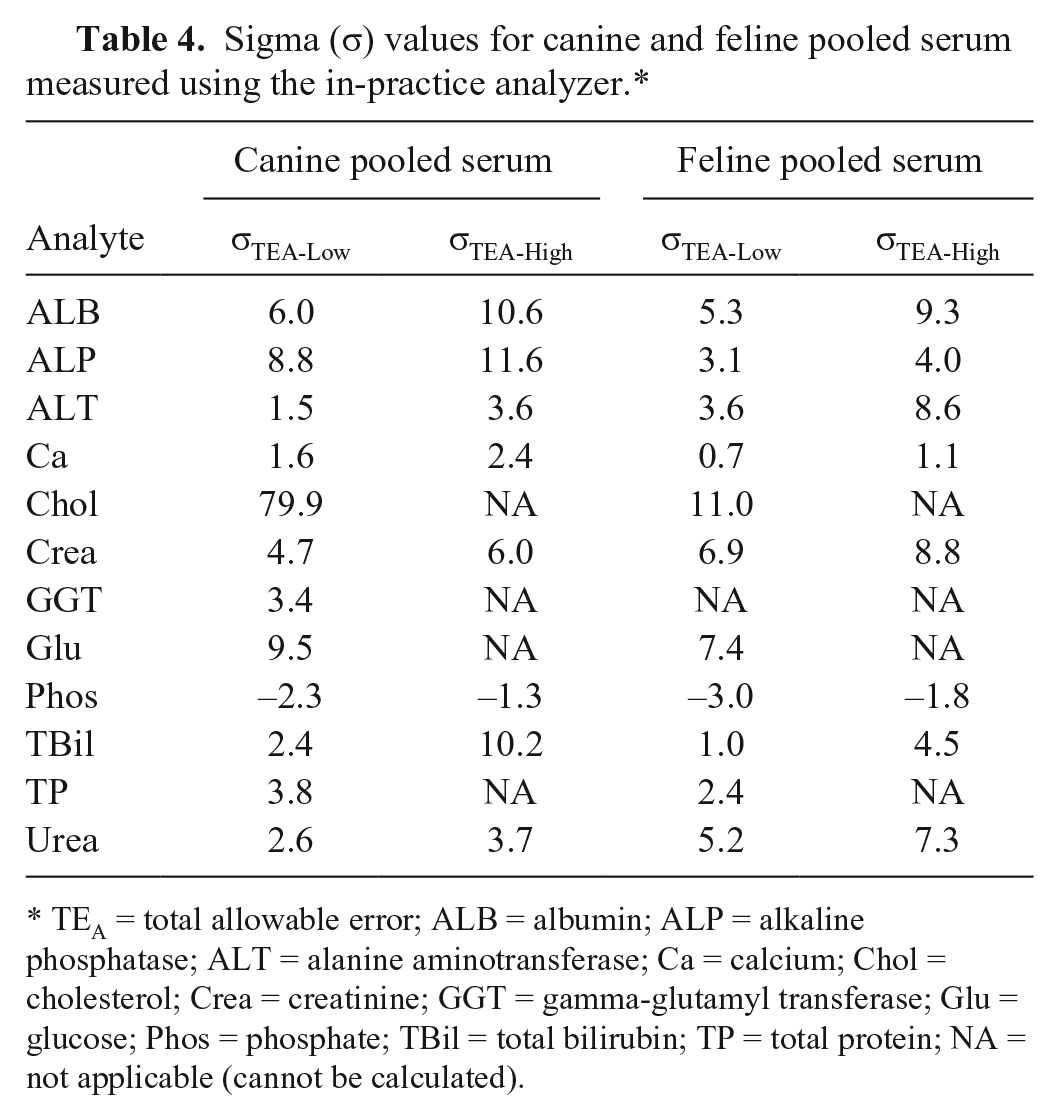
TEA = total allowable error; ALB = albumin; ALP = alkaline phosphatase; ALT = alanine aminotransferase; Ca = calcium; Chol = cholesterol; Crea = creatinine; GGT = gamma-glutamyl transferase; Glu = glucose; Phos = phosphate; TBil = total bilirubin; TP = total protein; NA = not applicable (cannot be calculated).
Method comparison using clinical samples
Chol, Glu, and urea measurements were not significantly different between analyzers for clinical samples in either species, whereas ALB, ALP, Phos, TBil, and TP measurements were significantly different between analyzers in both canine and feline samples (Table 5). Correlations between the analyzers were <0.7 for canine Phos, feline Ca, and feline GGT (Table 6).
Measurement of analytes from canine clinical samples using the in-practice and reference analyzers.*
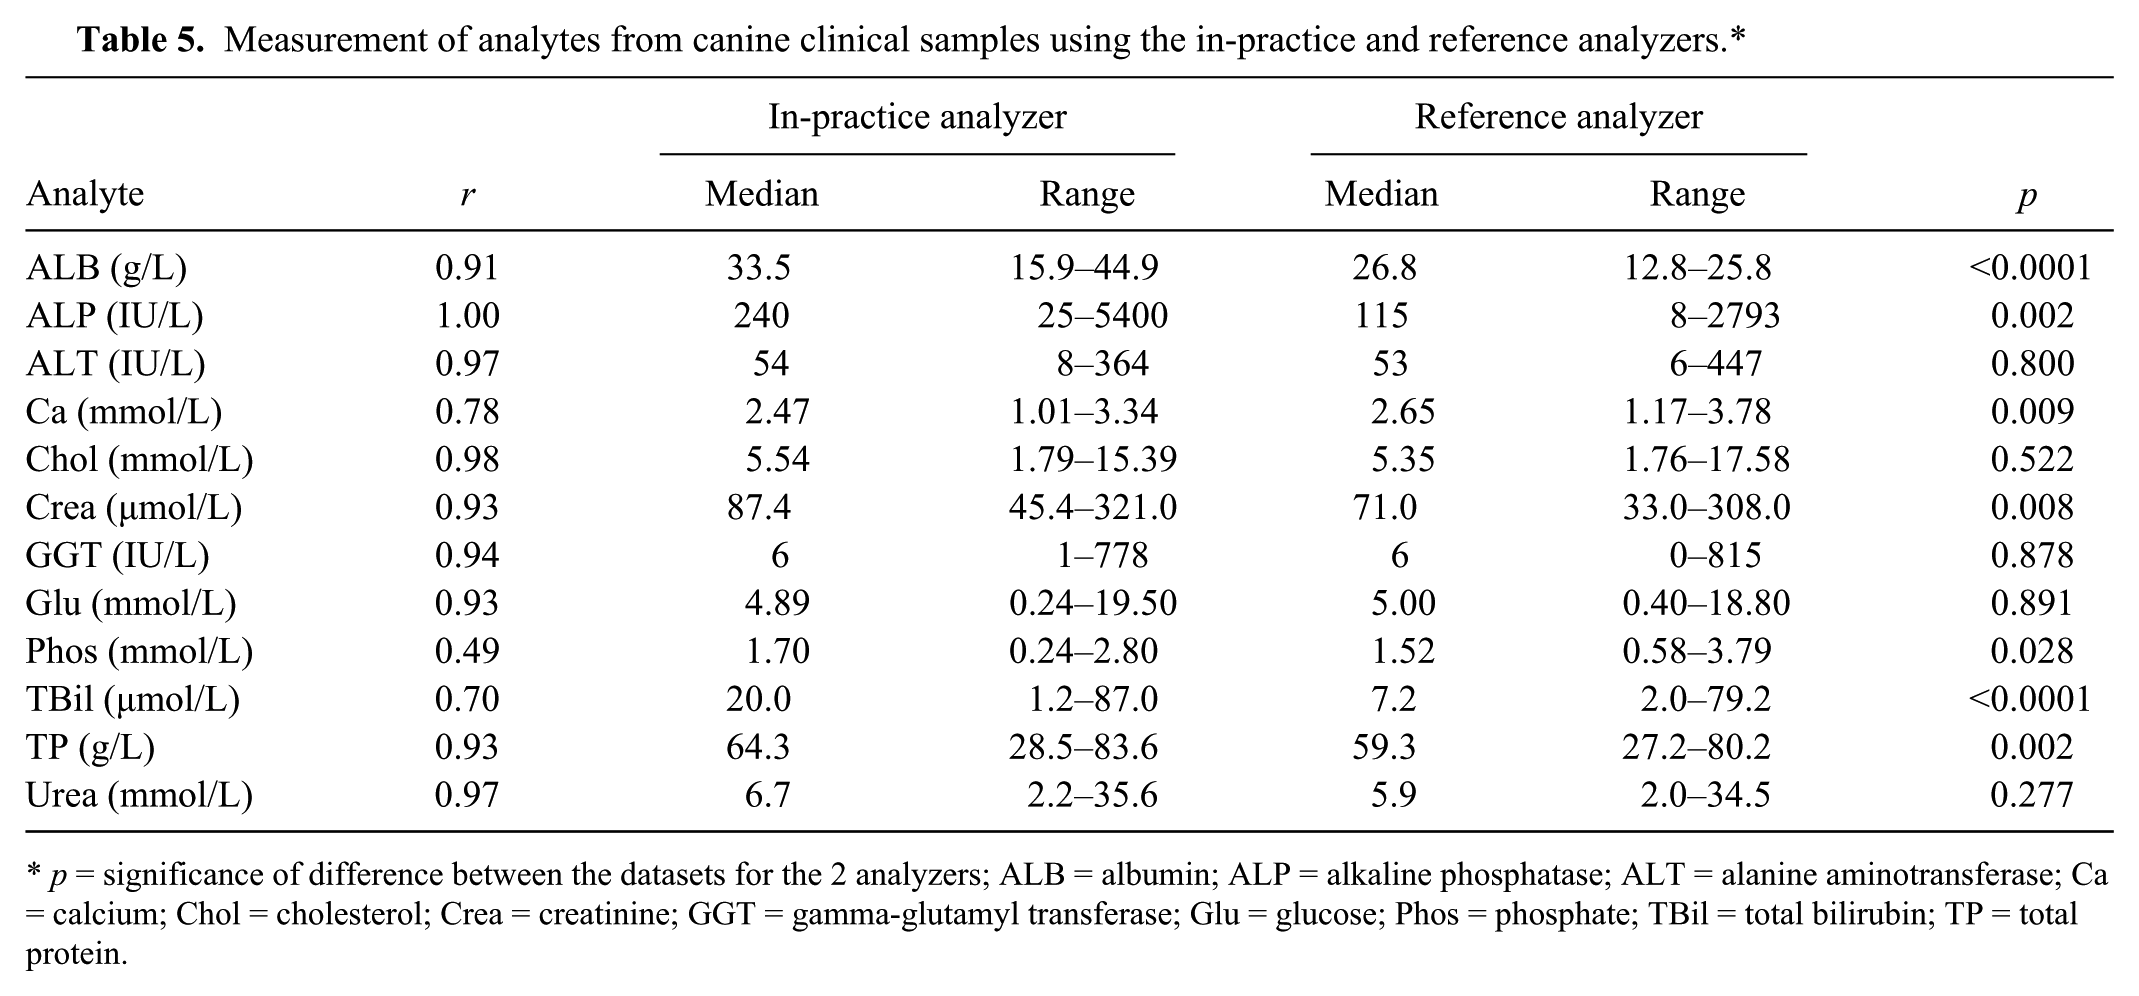
p = significance of difference between the datasets for the 2 analyzers; ALB = albumin; ALP = alkaline phosphatase; ALT = alanine aminotransferase; Ca = calcium; Chol = cholesterol; Crea = creatinine; GGT = gamma-glutamyl transferase; Glu = glucose; Phos = phosphate; TBil = total bilirubin; TP = total protein.
Measurement of analytes from feline clinical samples using the in-practice and reference analyzers.*
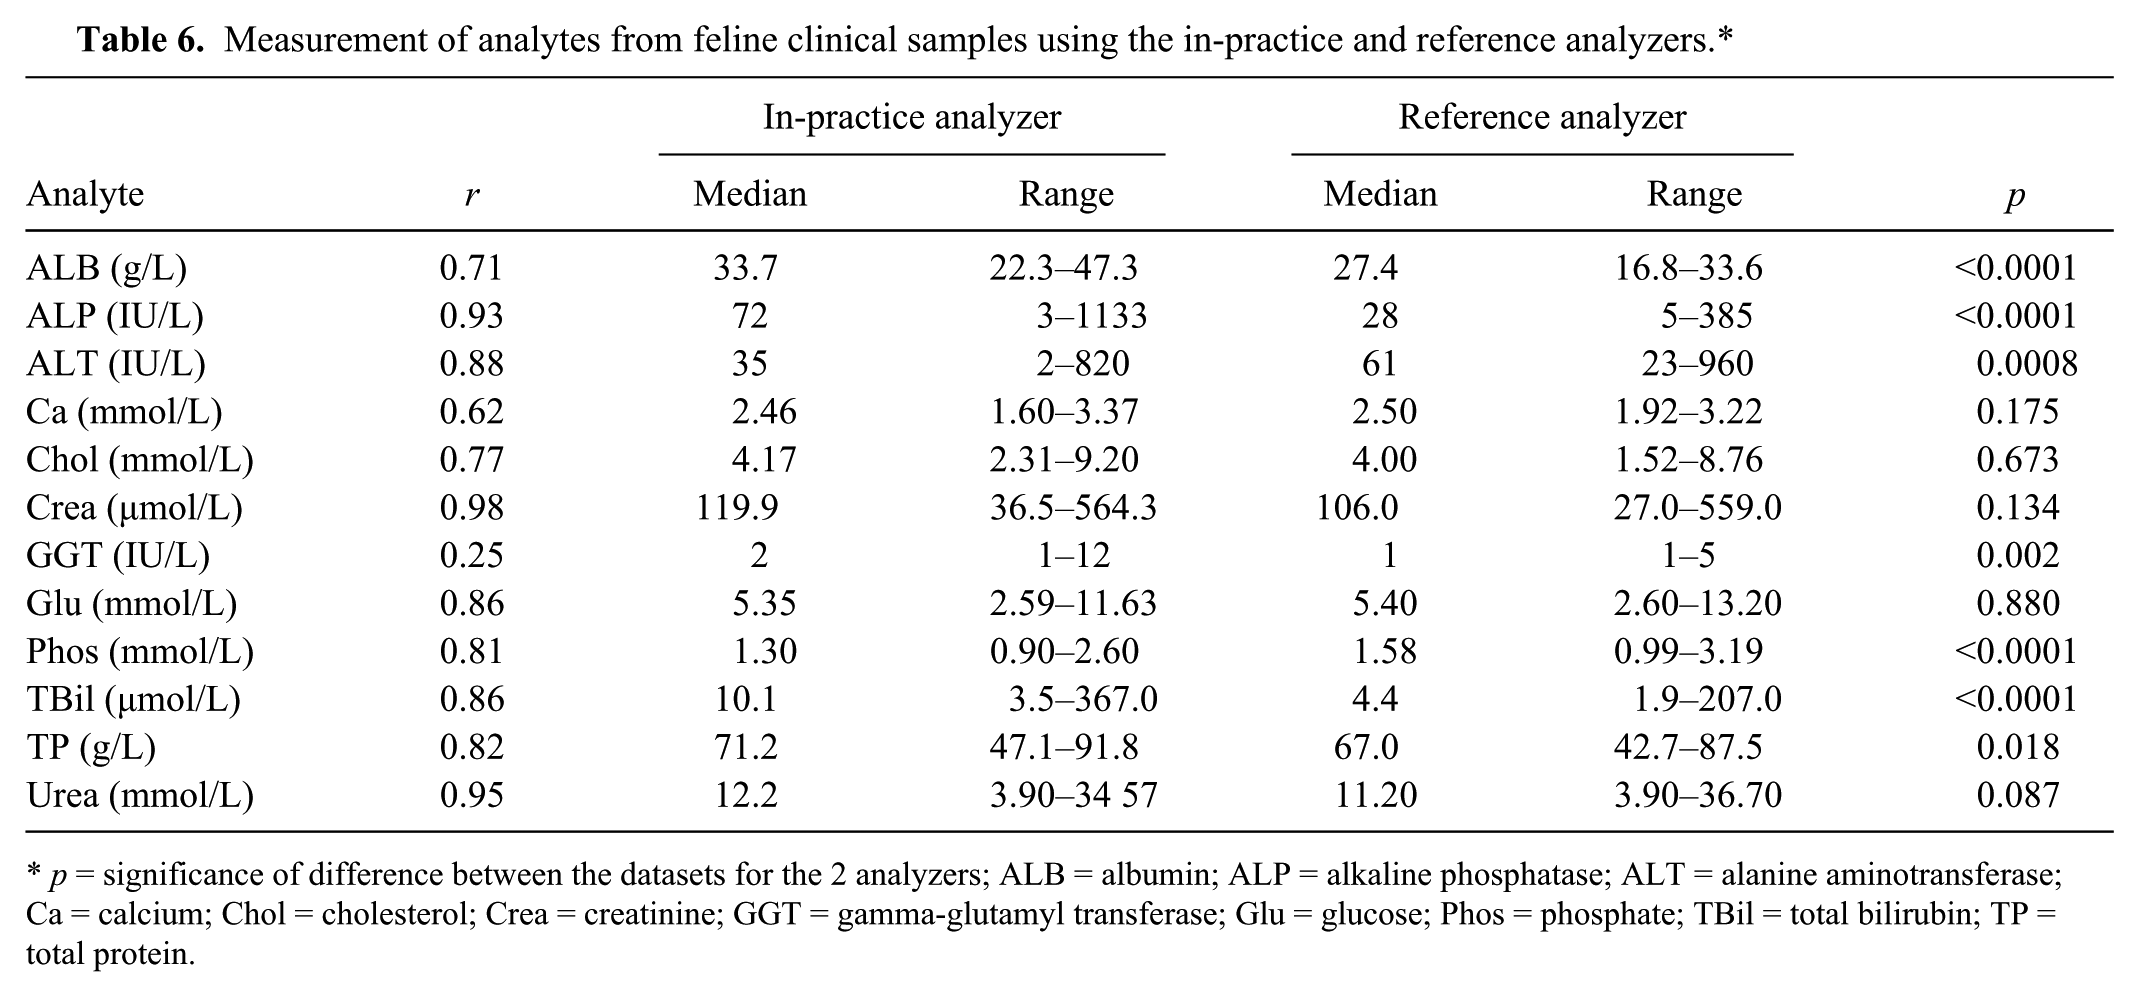
p = significance of difference between the datasets for the 2 analyzers; ALB = albumin; ALP = alkaline phosphatase; ALT = alanine aminotransferase; Ca = calcium; Chol = cholesterol; Crea = creatinine; GGT = gamma-glutamyl transferase; Glu = glucose; Phos = phosphate; TBil = total bilirubin; TP = total protein.
The most substantial bias values were seen for canine ALP (242% reference median) and TBil (218%), and for feline ALP (–307%), ALT (89%), GGT (110%), and TBil (250%; Tables 7, 8). The widest 95% LOA were observed for ALP, ALT, GGT, and TBil.
Proportional error (slope), constant error (y-intercept), and bias for canine samples measured using the in-practice analyzer and relative to the reference analyzer.*
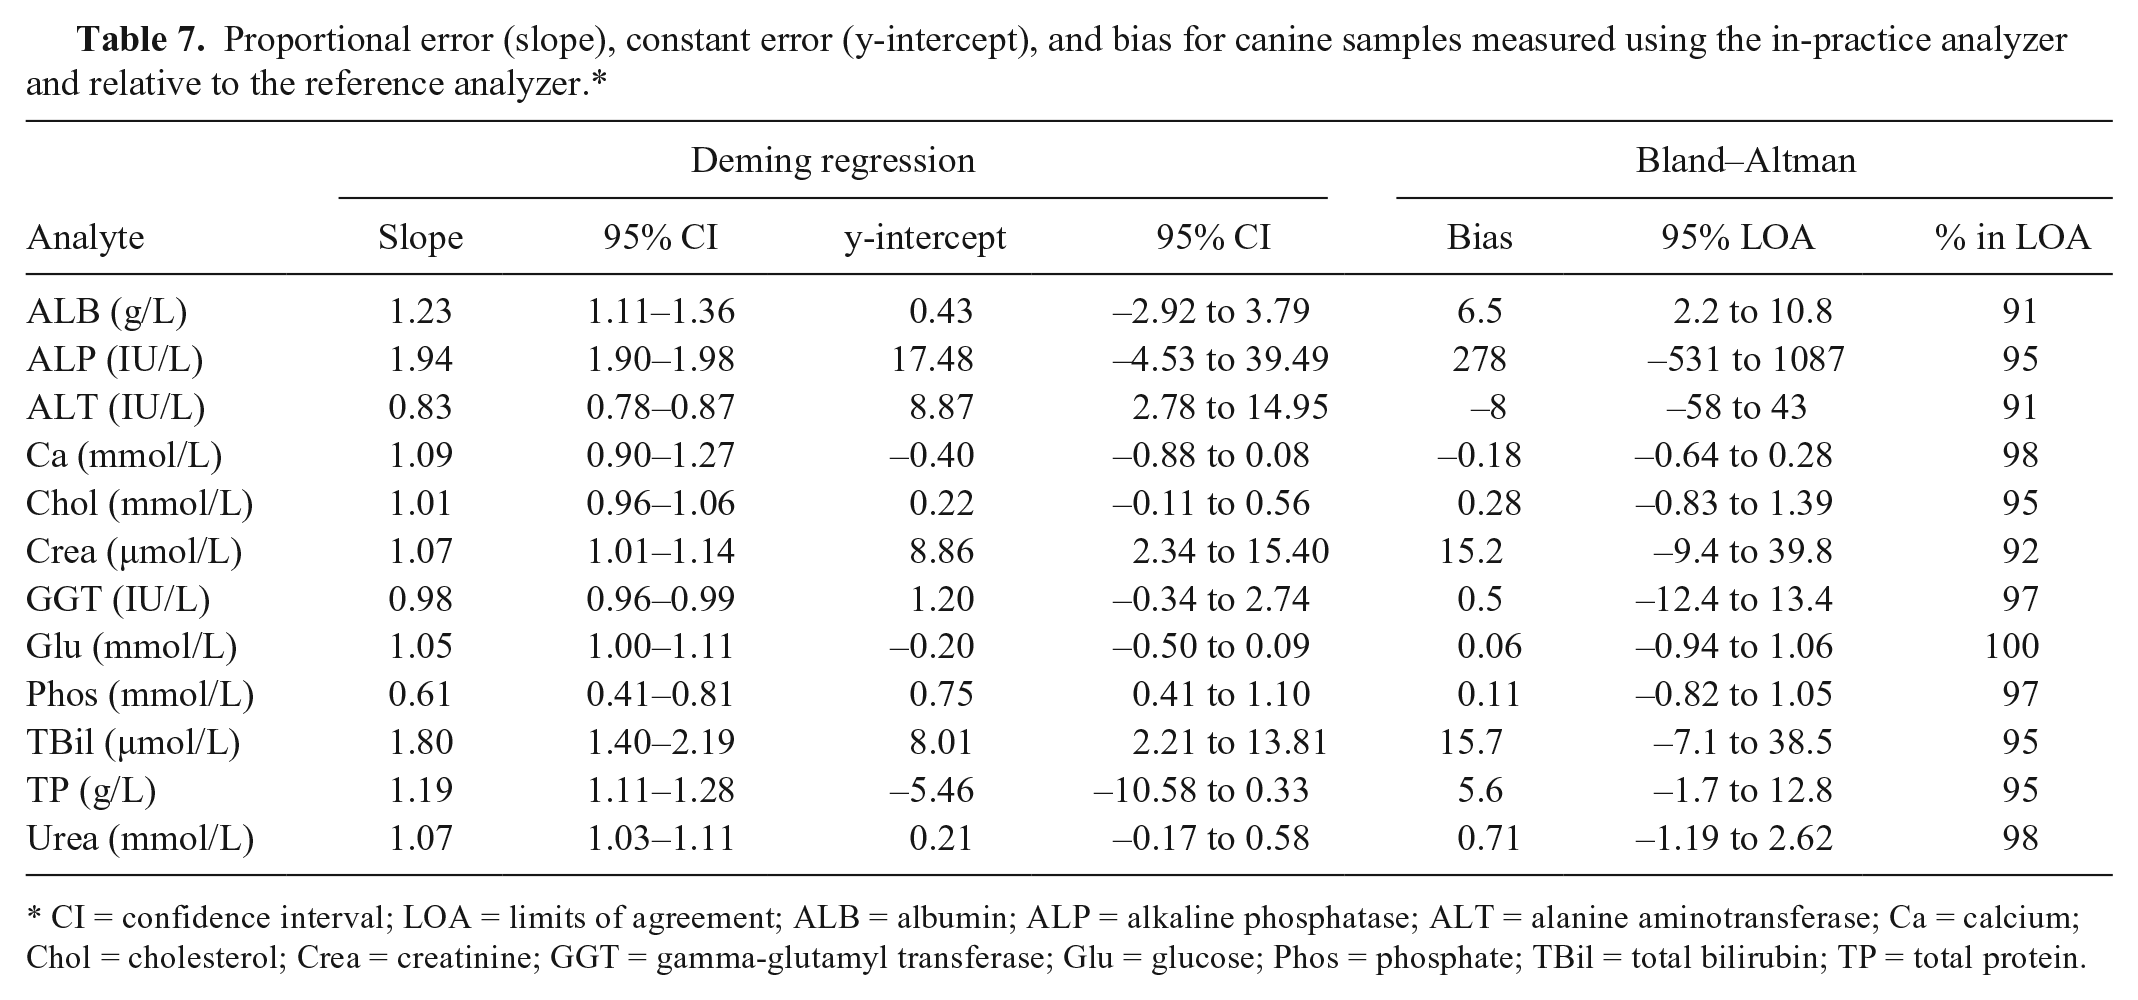
CI = confidence interval; LOA = limits of agreement; ALB = albumin; ALP = alkaline phosphatase; ALT = alanine aminotransferase; Ca = calcium; Chol = cholesterol; Crea = creatinine; GGT = gamma-glutamyl transferase; Glu = glucose; Phos = phosphate; TBil = total bilirubin; TP = total protein.
Proportional error (slope), constant error (y-intercept), and bias for feline samples measured using the in-practice analyzer and relative to the reference analyzer.
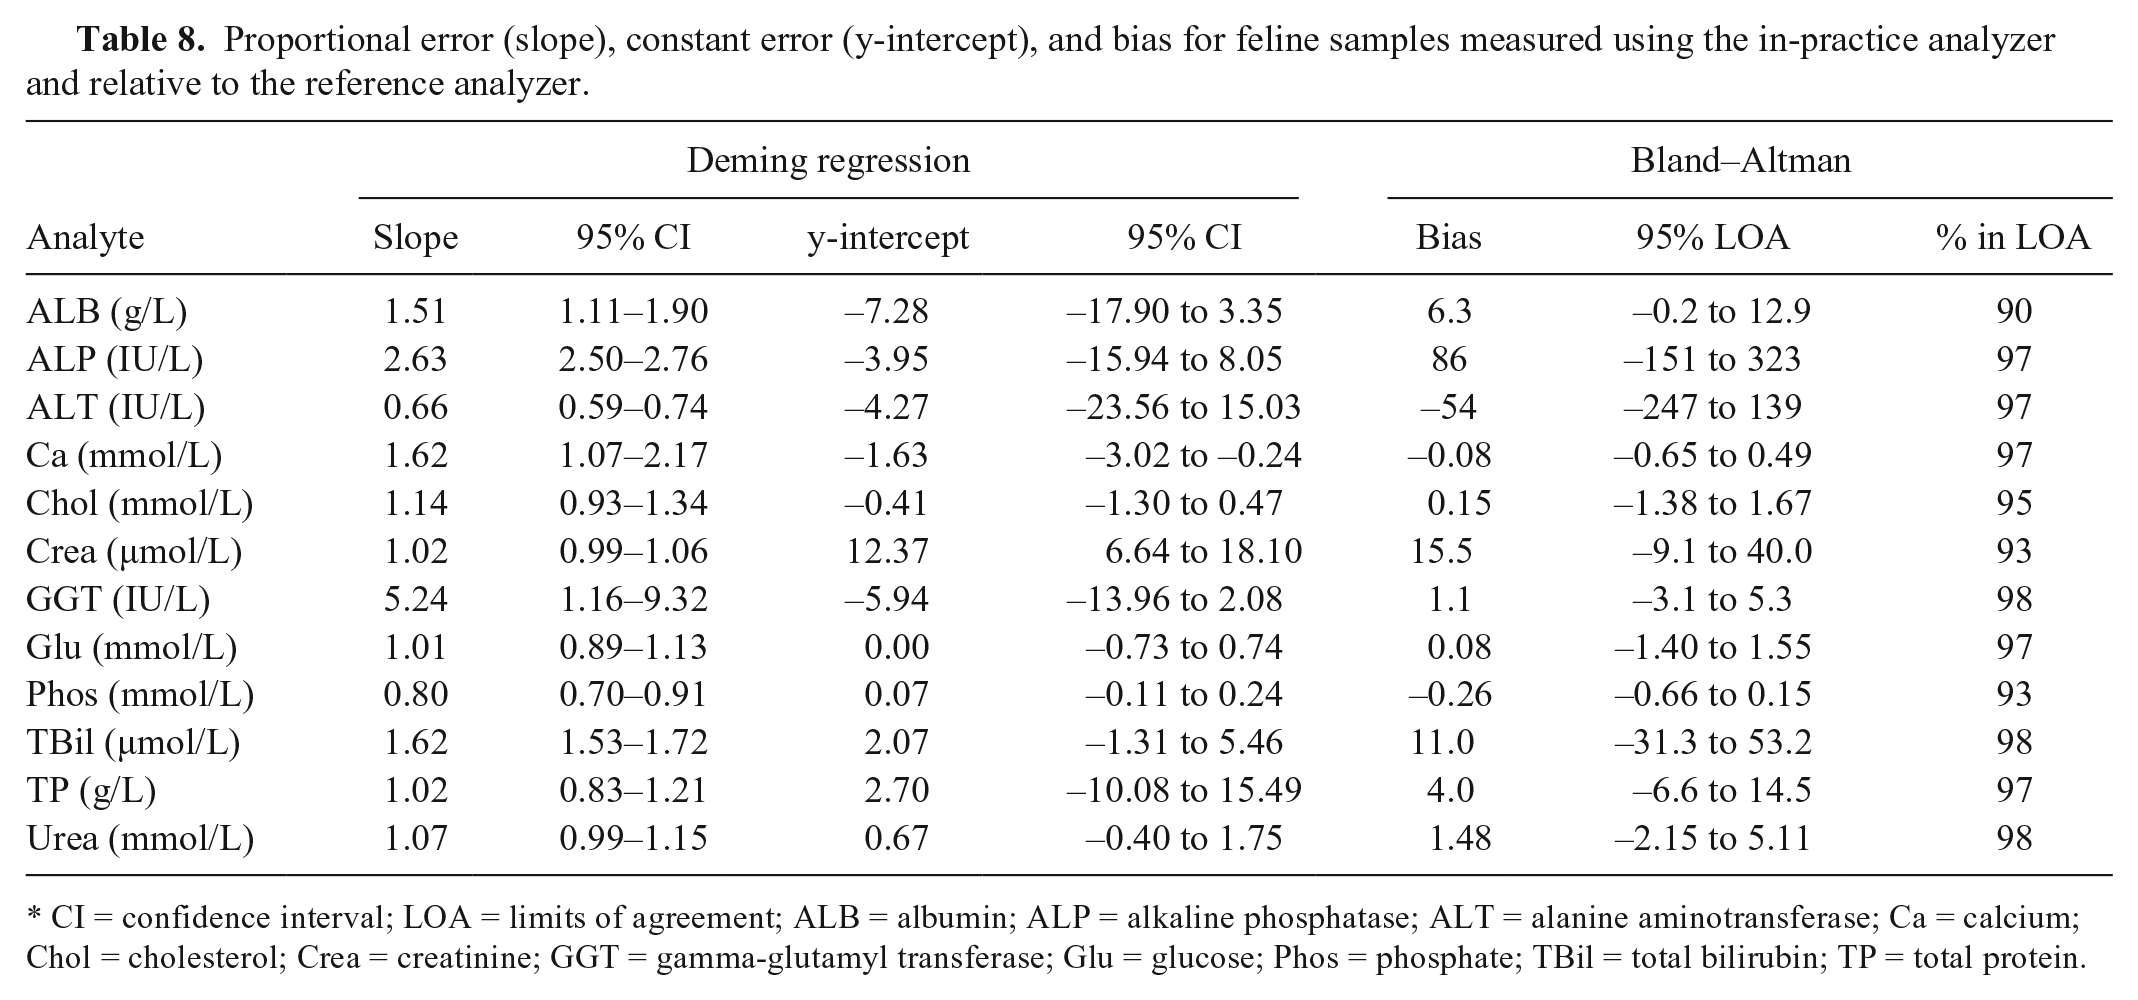
CI = confidence interval; LOA = limits of agreement; ALB = albumin; ALP = alkaline phosphatase; ALT = alanine aminotransferase; Ca = calcium; Chol = cholesterol; Crea = creatinine; GGT = gamma-glutamyl transferase; Glu = glucose; Phos = phosphate; TBil = total bilirubin; TP = total protein.
Discussion
Large-scale wet-chemistry analyzers are employed by most veterinary diagnostic laboratories because of their speed, overall reliability, and consistency of results. The costs of running these analyzers can be prohibitive for general practitioners in first-opinion practice, however, especially when throughput is relatively low. Validation of smaller, less expensive analyzers is therefore of most benefit to practices who desire wet-chemistry analysis without the incumbent costs.
The results of the repeatability study show that the within-run CV values for both QCM and both serum pools were mostly ≤5% (42/47 values), and all were <9%. The majority of between-run CV values (38/47) were also ≤5%, with all values <14%. The in-practice analyzer therefore has high precision for measurement of most analytes in dogs and cats, and moderate precision for the remaining analytes.
The between-cat variation in GGT in our study, even with the inclusion of cats with apparent cholestasis (based on ALP and TBil values), was relatively very low compared with that for the dog. Our maximum observed feline GGT activity measured by the in-practice analyzer was 12 IU/L, although TBil and ALP were normal in this cat. The maximum reference analyzer GGT activity was 5 IU/L (in-practice analyzer: 4 IU/L); ALP and TBil were both markedly increased in this sample. In contrast, the maximum canine GGT measured was 778 IU/L. In our experience, even cats with marked cholestasis are observed to have substantially lower GGT levels than other species, and milder increases following extrahepatic bile duct obstruction are seen in the cat than in the dog. 7 With such narrow between-cat variation, GGT values need to be reported to at least 1 decimal place for meaningful repeatability analysis because each 1 IU/L represents ≥8% of the maximum value. GGT is measured to zero decimal places using the in-practice analyzer, however, which generated very large and meaningless CV values. The results were therefore excluded from the study, and dependent calculations (feline GGT TEobs and σ values) were not performed. This issue has been encountered in other similar studies, and results were likewise excluded. 3
QCM TEobs-N(%) and TEobs-P(%) were broadly similar for all analytes, and, with the exception of canine ALT, were also broadly similar to the pooled samples. Seven of the analytes (ALB, ALP, Chol, Crea, GGT, Glu, and TP) had all TEobs(%) values below the lower published TEA, which demonstrates acceptability based on observed error for these methods. TEobs(%) for TBil and ALT were lower than the higher TEA, which also suggests acceptability for these methods. TEobs-P(%) for canine urea was the only TEobs value for this analyte above TEA, but the increase was small (2%) and likely to be of little significance. Several TEobs(%) for Ca and all TEobs(%) for Phos were well above the TEA, which suggests the in-practice analyzer methods are not acceptable for measuring these analytes based on observed error.
The computed σ metric value for an assay and its graphical representation, the MEDx chart, are performance indicators used to show assay reliability. 5 This information complements allowable error analysis and ensures that the minimum desired quality standards for an assay are met. In addition, these analyses are used to determine the stringency of quality control rules for that particular assay, with lower values requiring a greater number of, and more stringent, rules to ensure error detection. The highest σ values in our study were generally observed for analytes with TEobs < TEA, which is in part caused by low CV and/or bias, and relatively high TEA. Canine analytes with σTEA-Low values >4 (good performance) were ALB, ALP, Chol, Crea, and Glu, with TBil σTEA-High >4. ALT, GGT, TP, and urea were all >3 for σTEA-Low and/or σTEA-High, which suggests that the performance for measuring these analytes is likely to be sufficient but with room for improvement. For feline samples, analytes with σTEA-Low >4 were ALB, Chol, Crea, Glu, and urea, with σTEA-High >4 for ALP, ALT, and TBil. Ca and Phos performance in both species, and TP performance in the cat, was poor or worse. No single factor was identified to explain the low feline TP σ value, as bias and CV were both low. A relatively low TEA of 10% (much lower than ALB, for example) appears contributory, however, and a TEA of 12% would move the σ value to >3.
Ca performance is likely to be affected, at least in part, by the relatively low TEA compared with most other analytes. A low TEA is expected for analytes that require tight biological control, and so the performance requirement is high to ensure that small deviations are detected accurately and reliably. Ca bias was 2% for QCM N, with between-run CV of 5% and 10% in the dog and cat, respectively. This suggests that improvement in precision is required to increase the σ value.
High TEobs(%) and very poor σ values for Phos measurement appear to be the result of high bias(%): QCM N generated a bias of –27%, and QCM P a bias of 14%, despite controls falling within the recommended ranges given in the technical inserts. This suggests there may have been a failure in calibration. Recalibration of the instrument with 2 different batches of QCM N and P did not affect the Phos measurements of the QCM (not shown). Bias values for the other analytes were a mixture of positive and negative, and of relatively small magnitude for most analytes, which excludes errors in reconstitution of 1 or both of the QCM. Failure of calibration is therefore potentially the result of either incorrect concentration of Phos in both QCMs (which is unlikely given that bias was large for both QCM but in different directions) or a technical fault in the assay.
Correlation between the analyzers was mostly very high for canine samples, with Ca showing moderate correlation and Phos showing poor correlation. The datasets for many canine analytes were significantly different between the analyzers, however, and the Deming regression analyses revealed that this was mostly because of constant error in the measurement of the analytes by the in-practice analyzer relative to the reference analyzer. Correlations were also high or very high for feline samples, with moderate correlation seen for ALB and Chol, and poor for Ca and GGT. Major differences between the analyzer datasets also appeared to be the result of constant rather than proportional error with the exception of GGT.
Agreement between the analyzers was assessed from the results of the Bland–Altman analysis. For many of the analytes, ≥95% of results fell within the 95% LOA; however, the bias was too large and/or 95% LOA was too wide to be meaningful. 1 Canine Glu and TP, and feline TP, had a small mean bias and relatively narrow LOA, as well as ≥95% results within the 95% LOA, consistent with good agreement. Agreement for the remaining analytes was considered unacceptable.
Our study had some limitations. Ideally, precision, TEobs, and σ metrics are calculated for 2 or 3 different analyte levels (low, within-reference, and high) to show performance over the range of clinical samples. In our study, we determined 1 precision, TEobs, and σ metric value for each analyte given the use of a single pooled sample for each species. It must also be noted that veterinary TEA values are generally based on results from canine studies, and all TEA values in this study were defined for dogs. It is therefore possible that these values are not always appropriate for cats when reference intervals differ significantly between species. Complete validation of a method should include reportable range, recovery, and interference measurements. For simplicity, these were not performed during this study, and it is recommended that these be determined prior to clinical use. Last, duplicate measurement of analytes in the clinical samples may have improved agreement between the analyzers. Were the interchangeability of reference intervals between the analyzers of critical importance, this would have been preferred; for the purposes of this study and other studies, it was not necessary. 3
Footnotes
Authors’ contributions
KL Irvine contributed to design of the study; contributed to acquisition, analysis, and interpretation of data; drafted the manuscript; and critically revised the manuscript. K Burt contributed to acquisition of data and drafted manuscript. K Papasouliotis contributed to conception and design of the study; contributed to acquisition, analysis, and interpretation of data; drafted manuscript; and critically revised the manuscript. All authors gave final approval and agreed to be accountable for all aspects of the work in ensuring that questions relating to the accuracy or integrity of any part of the work are appropriately investigated and resolved.
a.
KeyLab, BPC BioSed SrL, Rome, Italy.
b.
Konelab PRIME 60i, Thermo Scientific Oy, Vantaa, Finland.
c.
BD, Franklin Lakes, NJ.
d.
Bio-Stat Diagnostic Ltd., Worcestershire, United Kingdom.
e.
GraphPad Software Inc., San Diego, CA.
Declaration of conflicting interests
The author(s) declared no potential conflicts of interest with respect to the research, authorship, and/or publication of this article.
Funding
The author(s) disclosed receipt of the following financial support for the research, authorship, and/or publication of this article: The study was funded by HORIBA Medical of HORIBA UK Ltd., Northampton, UK.