
Abstract
Disorders of the avian reproductive tract are common, yet monitoring their resolution presents a diagnostic dilemma. Reproductive hormones such as luteinizing hormone or estrogen are the best reflection of reproductive status, but the required sample volumes and lack of reference intervals limit their clinical utility. An alternative analyte is blood triglyceride, the concentration of which rises markedly during sustained estrogen release from the ovary. Portable meters for measuring human blood triglyceride concentration offer the advantage of using minimal sample volumes, but these have not been validated for use in birds. We assessed the precision and accuracy of 2 portable meters for measuring blood triglyceride concentration in pooled whole blood and plasma from chickens (n = 42), and performed method comparison using a reference analyzer and determined total error. Within-run repeatability was fair-to-excellent using whole blood and plasma (range: 2.5–11.5%), and between-run repeatability using plasma was similar (3.1–12.2%). The meters performed well in recovery and dilution studies in which almost all readings fell within the preset requirement of 75–125%. Correlations between each meter, using whole blood and plasma, and the reference analyzer, using plasma only, were high to very high (0.86–0.98). Bias determined by Bland–Altman analysis was similar between whole blood and plasma for each meter, yet markedly different between the meters. The calculated total observed error was consequently within our pre-set total allowable error of 25% for one meter but not the other, indicating the requirement for a meter-specific reference interval.
Introduction
In captive birds, disorders of the female reproductive tract are one of the most common reasons for presentation to a veterinarian. Although reproductive disorders, such as chronic egg laying, oviductal disease, and ovarian disease are relatively easy to diagnose in avian patients using diagnostic imaging, the treatment and monitoring of these disorders remains challenging. Surgical treatment options are limited in birds because only surgical removal of the oviduct, but not the ovary, is feasible without significant risk to the patient. 11 Removal of the oviduct alone results in continued ovarian activity, which can lead to morbidity and mortality in some birds. Medical management of reproductive disorders aims to suppress ovarian activity and ovulation, and there have been several prospective studies evaluating the efficacy of long-acting gonadotropin-releasing hormone agonists for the treatment of avian reproductive disorders.2,11,14,15
Neither medical nor surgical treatments alone or combined are likely to completely resolve disorders caused by chronic gonadal activity in pet birds such as psittacines and passerines. 11 Identifying and correcting the environmental factors that trigger continued reproductive activity is therefore critical in helping manage these cases; however, monitoring the effect of medical suppression or environmental changes on ovarian activity remains challenging in the clinical setting. Measuring blood sex hormone or luteinizing hormone (LH) concentrations is often not feasible given the large volume of blood needed and the lack of established reference intervals. In birds, blood triglyceride concentration is increased in response to increased release of estrogen from the ovary.1,10 Triglyceride may therefore be used as a marker of ovarian activity and thus proxy for sex hormones and LH during monitoring of the response to hormonal treatment or environmental modification. 6
Compared with conventional laboratory methods, triglyceride point-of-care (POC) meters require much smaller sample volumes and provide faster results. 3 The meters are relatively inexpensive and portable, which allows cage-side testing. POC meters have been validated for triglyceride measurement in humans, dogs, cats, and horses.8,9,13 Although avian veterinarians have considered using these meters in birds, published validation studies are not available.
Validation studies in small birds such as psittacines present unique challenges, in particular the small sample volumes available to create whole blood pooled samples. Larger birds such as chickens provide greater sample volumes and provide a more homogeneous population for initial validation studies. Given that no POC meters have been validated for measuring triglycerides in any avian species, to our knowledge, we evaluated the precision and accuracy of 2 POC meters for measuring blood triglyceride concentration in pooled whole blood and plasma from chickens, performed method comparison using a reference analyzer, and determined total observed error for the meters using chicken whole blood and plasma. Both sample types were evaluated to address whether whole blood and plasma are interchangeable or whether one sample type is better than the other.
Materials and methods
Blood samples were obtained from 42 chickens, housed on the University of Wisconsin–Madison campus, comprising 34 females, 6 males, and 2 of unreported sex. All birds were clinically healthy, and females were mostly non-laying at the time of sampling. All samples were obtained in accordance with an established IACUC protocol.
Blood was obtained by jugular venipuncture and collected into evacuated plastic tubes containing lithium–heparin anticoagulant (Becton Dickinson, Franklin Lakes, NJ). Samples were transported to the clinical pathology laboratory, University of Wisconsin Veterinary Care, at room temperature and refrigerated (4–8°C) within 1 h of collection. One aliquot was taken from each sample and centrifuged (4°C; 2,000 × g; 5 min) to allow separation of the plasma fraction. Following determination of the plasma triglyceride concentration of individual samples by the reference analyzer, pooled whole blood samples were created, and approximately half of each pool was centrifuged as before to create a matched pooled plasma sample for each whole blood pool. High and low triglyceride concentration pooled samples were created for precision, recovery, and dilution studies. None of the plasma samples exhibited more than slight hemolysis, including plasma obtained from the pooled whole blood.
The reference analyzer was the Vitros 5,1 (Ortho Clinical Diagnostics, Rochester, NY), which has a reportable range of 0.11–5.93 mmol/L (10.0–525.0 mg/dL) triglyceride. The 2 POC meters (CardioChek PA [Polymer Technology System., Indianapolis, IN] and Accutrend Plus GCT [Roche Diagnostics, Mannheim, Germany]) were designated meter 1 and meter 2, respectively. Both meters use meter-specific test strips, and for this study all strips were for triglyceride measurement only. Meter 1 has a reportable range of 0.56–5.65 mmol/L (50–500 mg/dL) and can be programmed to report either unit. Results outside this range are reported by the analyzer as <0.57 mmol/L and >5.65 mmol/L. Meter 2 has a reportable range of 0.80–6.86 mmol/L (70–600 mg/dL), and results outside this range are reported by the analyzer as “Lo” or “Hi.” For both meters, erythrocytes are separated from the plasma fraction within the test strip prior to measuring triglyceride.
The assay principle for chemical detection of triglyceride used by both POC meters and the reference analyzer is the same: triglycerides are hydrolyzed into glycerol and free fatty acids. Two subsequent reactions convert glycerol into hydroacetone phosphate and hydrogen peroxide. Hydrogen peroxide, in the presence of peroxidase, converts an indicator to a dye by oxidation. Concentration of the dye is then measured by reflectance photometry to give the triglyceride concentration.
Triglyceride concentration was determined in native and pooled plasma samples using the reference analyzer and 2 POC meters. Native and pooled whole blood was analyzed by the POC meters but not the reference analyzer because only plasma can be analyzed by this machine. Whole blood and plasma samples were tested by all analyzers within 1 h of each other. All analyses were completed within 24 h of collection. All analyzers were used according to the respective manufacturer’s instructions.
For sample analysis by the meters, a test strip was inserted into each meter and 25 μL of whole blood or plasma was volumetrically pipetted onto the test spot. Results were then available ~2–3 min after addition of the sample. For testing by the reference analyzer, 100–200 μL of plasma was placed into an assay micro-cup and covered with a cap prior to testing. Results were available after ~5 min.
All quality control materials (QCM) used in our study were made by the respective analyzer manufacturer. For the reference analyzer, 2 levels of QCM (Vitros Performance Verifier Level 1 and Level 2, Ortho Clinical Diagnostics) were analyzed daily as part of the routine quality control procedures for the diagnostic laboratory and interpreted in accordance with established laboratory quality control practices.
For the POC meters, controls were analyzed immediately before analyzing the first samples on the day of testing. Two QCM (level 1 and level 2; Polymer Technology) are available for meter 1, and one QCM (TG1; Roche) is available for meter 2. All control readings fell within the recommended limits determined by the manufacturers (meter 1—“Level 1”: 1.24–2.15 mmol/L, “Level 2”: 1.92–3.50 mmol/L; meter 2—“TG1”: 2.7–3.8 mmol/L).
Imprecision of the meters was assessed by within- and between-run repeatability using pooled samples. Within-run repeatability was determined by measuring the same whole blood or plasma sample 10 times sequentially in the same assay run. Between-run repeatability was determined by measuring the same plasma sample each day for 10 consecutive days; frozen aliquots were used to avoid repeated freeze–thaw cycles and ensure minimal variation. For the pooled samples, 2 concentrations of triglyceride, near the lower and upper detection limits of the meters (~1 and 4 mmol/L), were used to assess repeatability. For comparison, within- and between-run repeatability was also determined for the reference analyzer.
Accuracy was determined by a recovery experiment. Two pooled whole blood and plasma samples, one with high and one with low concentrations of triglyceride within the reportable range for both meters, were mixed in various proportions (high-to-low: 2:1, 1:1, and 1:2). The measured triglyceride concentration is expressed as a percentage of the expected concentration. Each sample was measured twice on each meter. The pooled plasma samples were also measured twice on the reference analyzer.
Feasibility of sample dilution was also addressed. Because the meters have a narrow reportable range, and dilution range is limited, linearity over the reportable range was not determined. Instead, pooled whole blood and plasma samples were diluted and concentrations expressed as a percentage of expected concentration, as for the recovery experiment. Two diluents were tested: 0.9% saline solution with and without 7% bovine serum albumin (BSA). Saline containing 7% BSA was chosen because this is the formulation of the commercial reference analyzer diluent (Vitros Chemistry Products FS Diluent Pack 2 (BSA/Saline), Ortho Clinical Diagnostics) for triglycerides; 0.9% saline without BSA was also tested because this may be a more readily available diluent for POC testing. As for the recovery experiment, each sample was measured twice on each meter and plasma measured twice on the reference analyzer.
For each of the 42 chickens in our study, samples were analyzed using the 2 POC meters and reference analyzer. Seven samples were above the reportable range of the meters as determined by the reference analyzer using automatic dilution. These samples were diluted to a one-third dilution manually using 0.9% saline with 7% BSA to bring them into the reportable range, and the diluted samples were then analyzed using the POC meters and reference analyzer. Some samples were below the reportable range for the meters, which varied by meter and sample type. Although in some studies nominal values are assigned to such samples, this was considered inappropriate for this comparison, and these samples were therefore excluded from the analyses.
The predetermined quality requirement for the meters was a total allowable error (TEA) of 25%, which is recommended by both the American Society for Veterinary Clinical Pathology and Clinical Laboratory Improvement Amendment for triglyceride measurement. 5 If calculated total observed error (TEobs) was greater than the TEA, the quality requirement for between-day coefficient of variation (CV) was set at ≤10%; this is based on available biologic variation for triglycerides in people because data are not available for avian species. 16 The predetermined recovery and dilution requirements were 75–125%, which corresponds to the required TEA. 18
All analyses were performed using the graphing and statistics software Prism (GraphPad Software, La Jolla, CA). Imprecision was determined by calculating the CV, where CV(%) = 100 × standard deviation (SD)/mean.
A D’Agostino and Pearson omnibus test showed that data for the analyzers were not normally distributed. Data sets for each combination of analyzer and sample type were therefore compared using a Kruskal–Wallis test, with the Dunn post-hoc test for individual data sets, and the Spearman correlation.
The mathematical relationship of paired results between the meters and reference analyzer was determined for each sample type by Deming regression. 7 Proportional error was considered to be present if the 95% confidence interval (CI) of the slope did not include 1. Constant error was considered to be present if the 95% CI of the y-intercept did not include 0.
Agreement and mean bias were determined by Bland–Altman analysis. Agreement was considered good when the 95% limits of agreement (LOA; ±2 SD) were subjectively narrow, the bias was small, and 95% points fell within the LOA. Bias(%) was calculated from the Bland–Altman plot as follows: bias(%) = mean[100 × (meter method – reference method)/mean of methods]. 4 Proportional bias was determined for the Bland–Altman graphs using Deming regression as described above.
TEobs was calculated as: TEobs(%) = 2 × CV + bias(%), where CV was between-day repeatability and bias(%) was taken from the Bland–Altman analysis.
Given that 7 samples were diluted, analyses were performed both with and without these 7 data points to exclude the effect of diluted samples on the data calculations. For the TEobs calculations, between-day CV for the pooled plasma sample with low triglyceride concentration was used when the 7 diluted samples were excluded because this best reflected CV at the median triglyceride concentration. Between-day CV for the high triglyceride pooled plasma sample was used when the 7 diluted samples were included to account for the higher concentration samples.
Results
Meter 1 had a consistently low CV, comparable to that of the reference analyzer (Table 1). The CV for meter 2 was lower when using plasma than whole blood and at the higher concentration of triglyceride compared with the lower concentration.
Imprecision of the meters and reference analyzer using pooled whole blood and plasma.
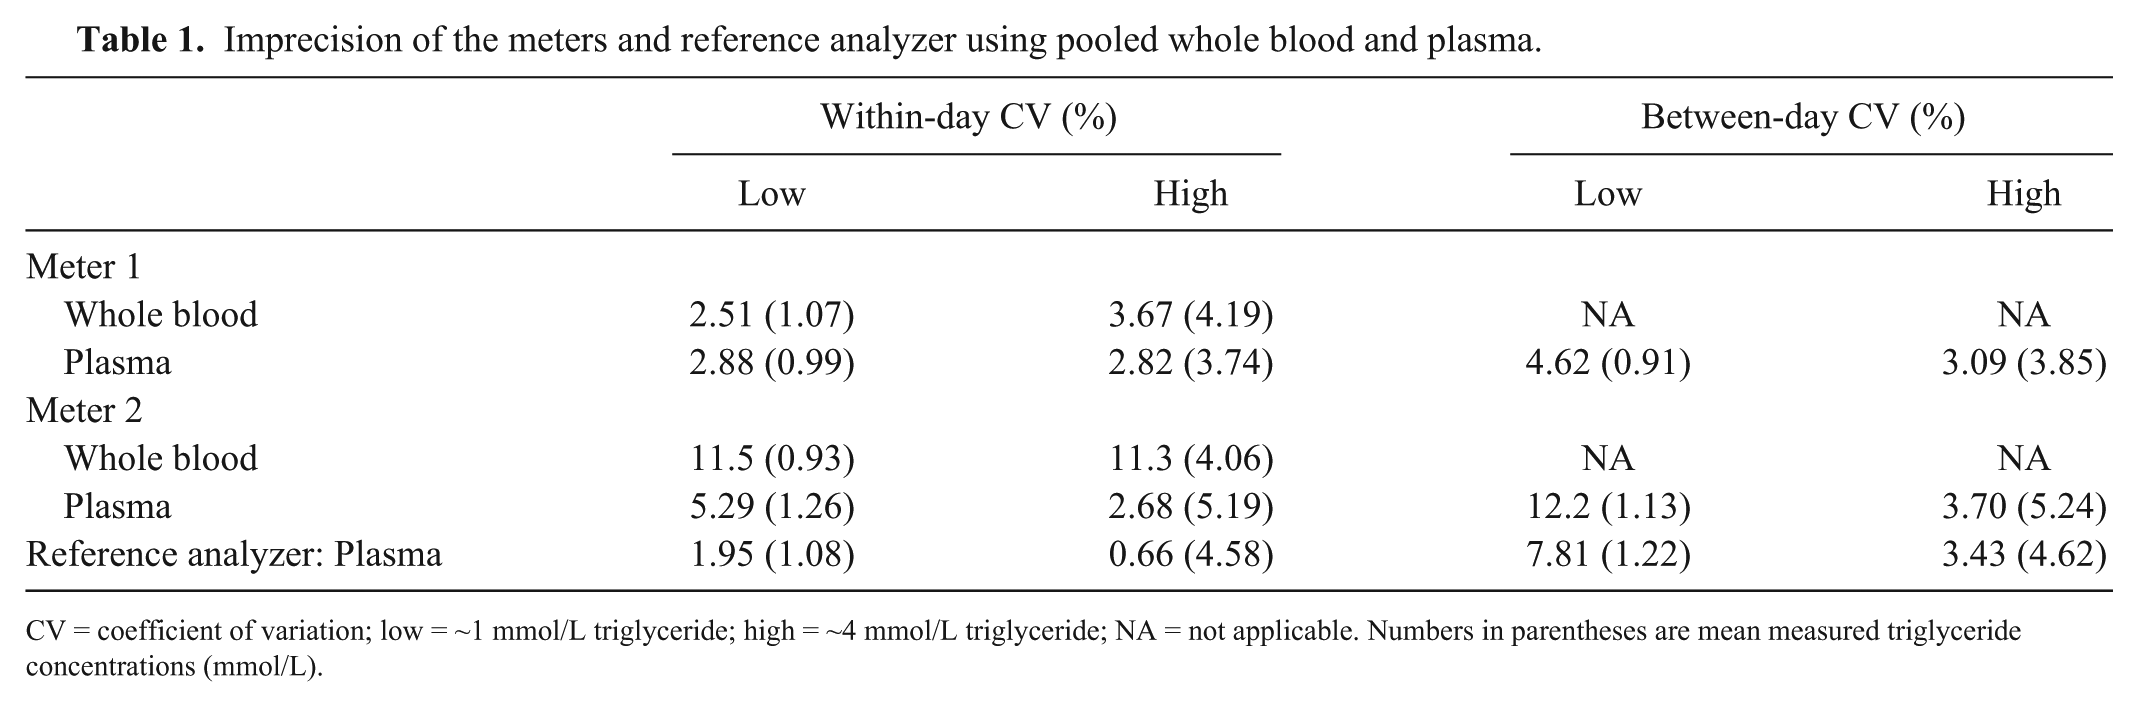
CV = coefficient of variation; low = ~1 mmol/L triglyceride; high = ~4 mmol/L triglyceride; NA = not applicable. Numbers in parentheses are mean measured triglyceride concentrations (mmol/L).
Recovery was within 75–125% for all measurements except meter 2 using whole blood (Table 2). Whole blood exhibited lower recovery whereas plasma recovery was higher. Results for the reference analyzer were all close to 100%.
Recovery of triglyceride from mixed pooled whole blood and plasma samples. Results are expressed as percentage measured versus expected values.
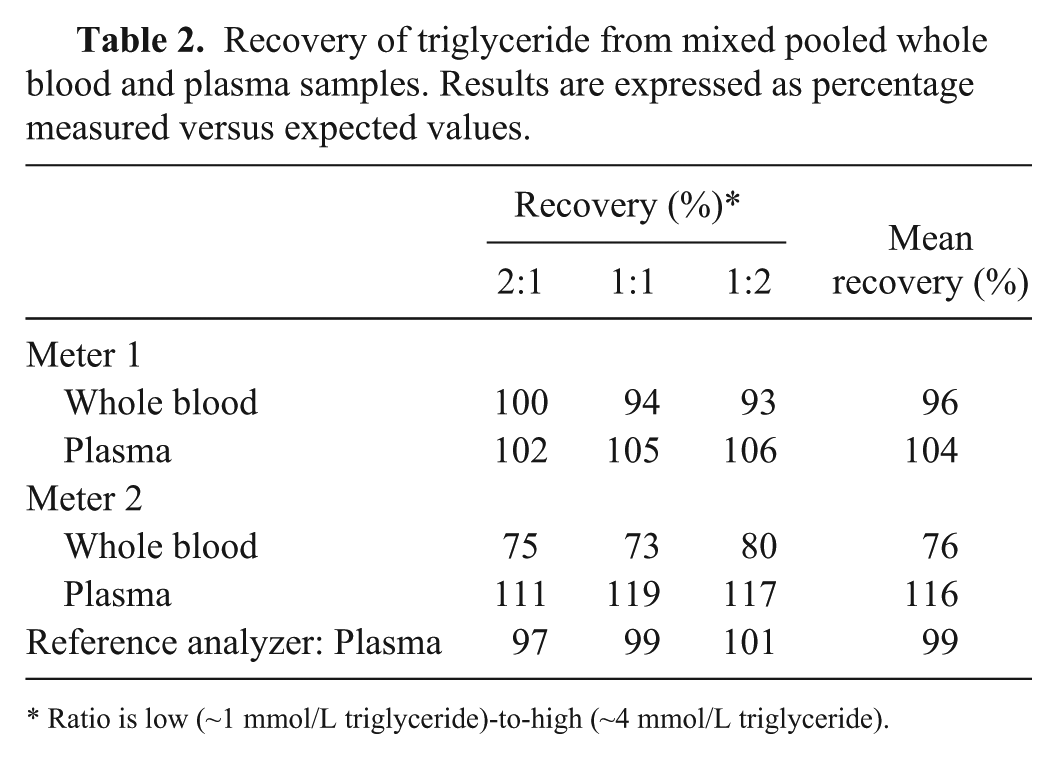
Ratio is low (~1 mmol/L triglyceride)-to-high (~4 mmol/L triglyceride).
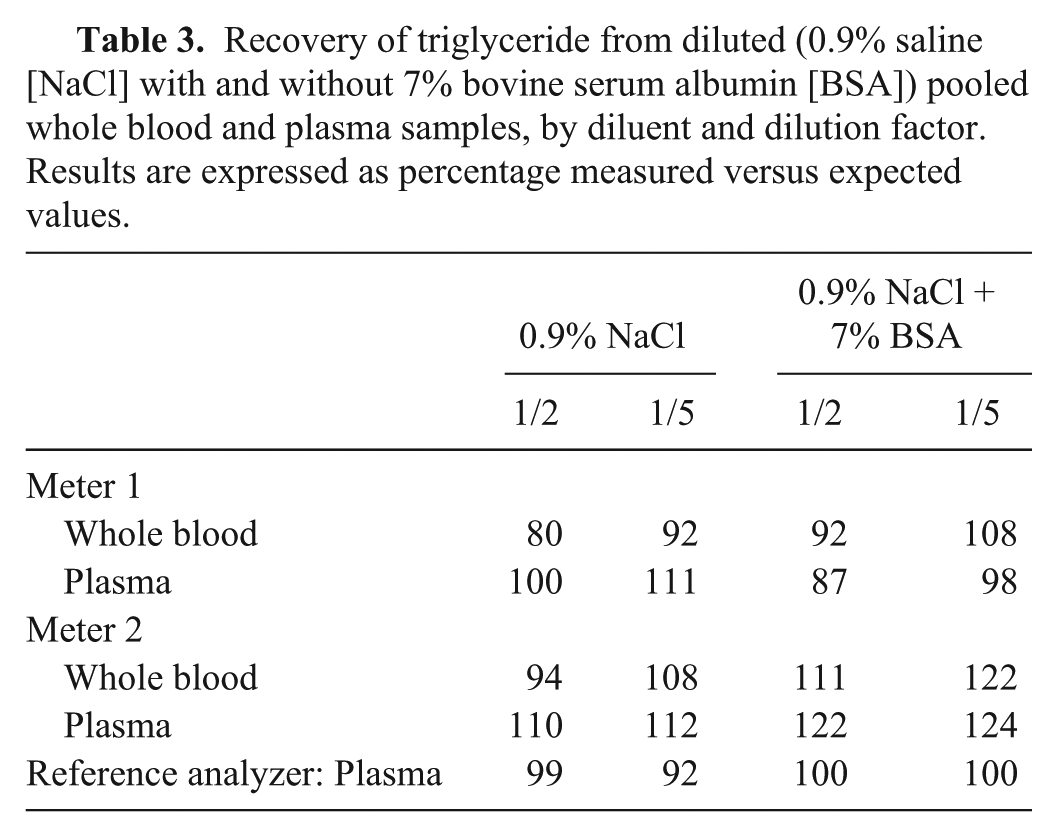
In the dilution experiment, the meters performed similarly to one another (Table 3). Applying the same limits as the recovery experiment, all measurements were within the predetermined requirement of 75–125%. For meter 1, the inclusion of BSA resulted in marginally better recovery for diluting whole blood, whereas the effect of BSA on diluted plasma was equivocal. Recovery for meter 2 using 0.9% saline without 7% BSA was better for both whole blood and plasma, although there was no obvious advantage to using either sample type. The reference analyzer performed better in the presence of 7% BSA, consistent with the manufacturer-supplied commercial diluent.
Recovery of triglyceride from diluted (0.9% saline [NaCl] with and without 7% bovine serum albumin [BSA]) pooled whole blood and plasma samples, by diluent and dilution factor. Results are expressed as percentage measured versus expected values.
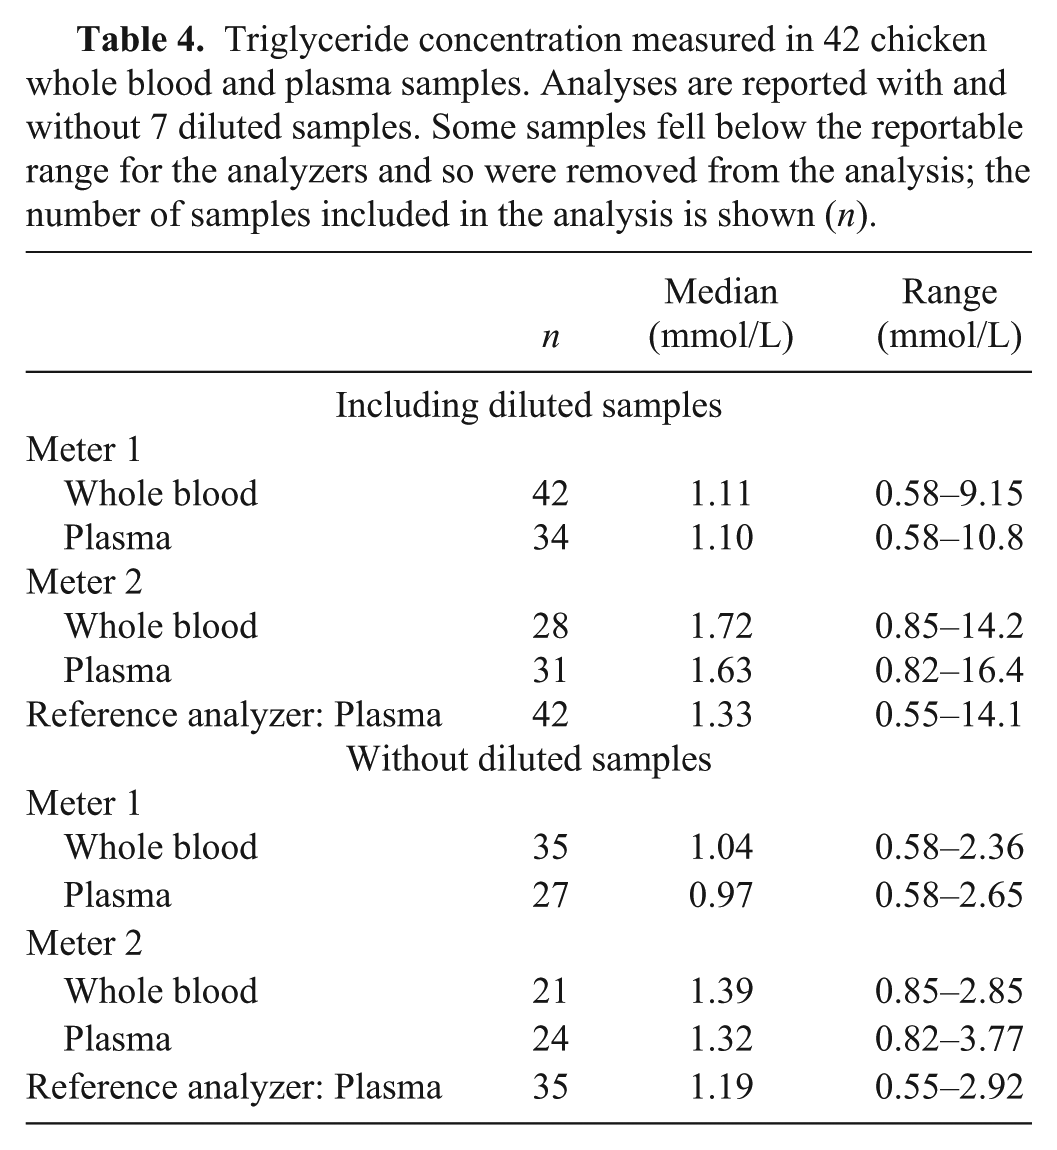
There were no significant differences between any of the data sets across analyzers and sample types for the medians and ranges of triglyceride for the 42 chickens, with or without the 7 diluted samples (Table 4). Correlations between the meters and the reference analyzer were high to very high for both whole blood and plasma (Table 5; Zady M, 2009, Correlation and simple least squares regression, https://goo.gl/FtSciD). On Deming regression analysis for meter 1, the 95% CI for the slope did not include 1, indicating proportional error. The y-intercept 95% CI did not include 0, indicating constant error, when diluted samples were included. For meter 2, the 95% CI for the slope did not include 1 and y-intercept 95% CI did not include 0 using plasma when diluted samples were included, indicating both proportional and constant error was present only for this sample type and with the inclusion of diluted samples.
Triglyceride concentration measured in 42 chicken whole blood and plasma samples. Analyses are reported with and without 7 diluted samples. Some samples fell below the reportable range for the analyzers and so were removed from the analysis; the number of samples included in the analysis is shown (n).
Correlation and Deming regression analysis of chicken whole blood and plasma samples, showing proportional error (slope) and constant error (y-intercept). Comparisons are between the specified meter for that sample type and reference analyzer using plasma. Analyses are reported with and without 7 diluted samples.
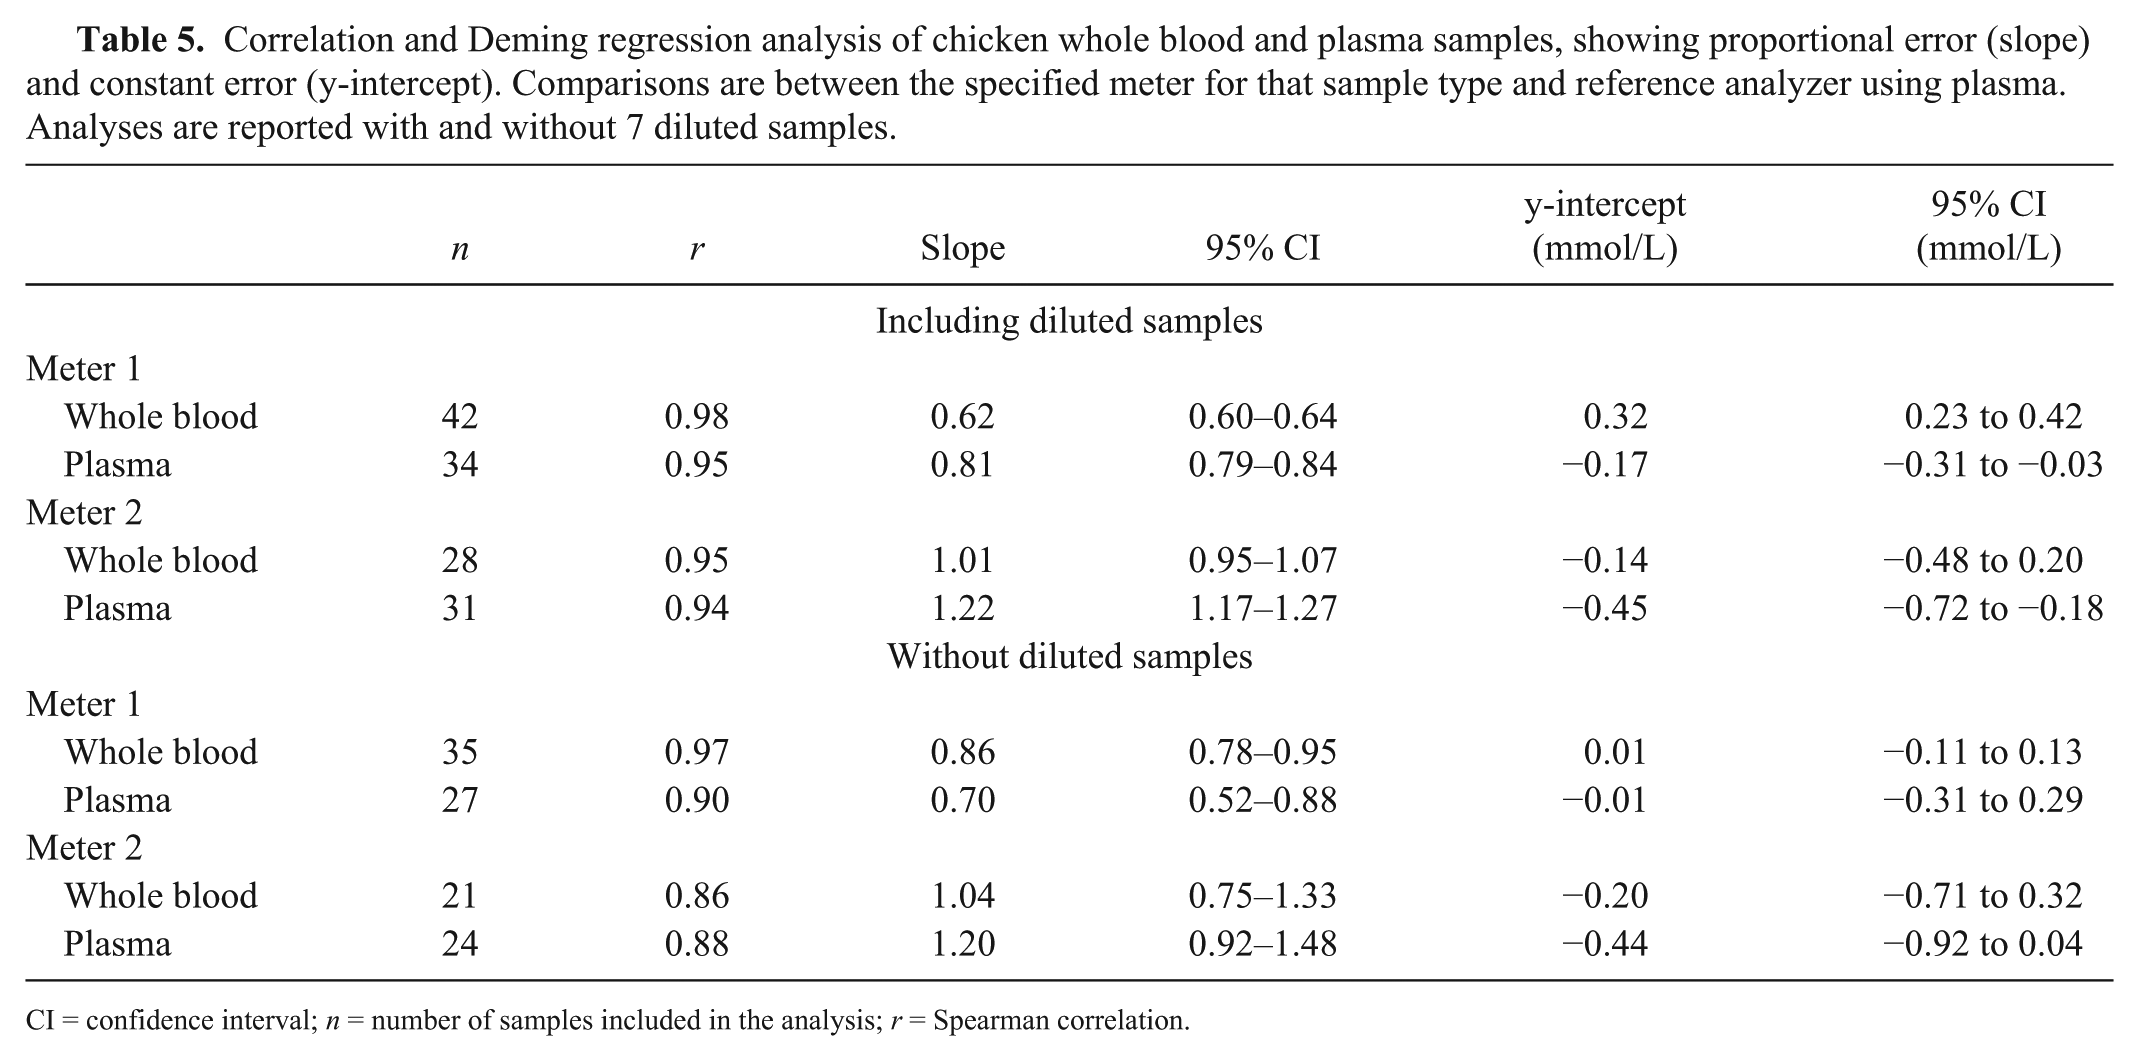
CI = confidence interval; n = number of samples included in the analysis; r = Spearman correlation.
There was a negative mean bias, as shown by Bland–Altman analysis, for both meters and sample types except plasma measured by meter 2 when diluted samples were included, for which the bias was positive (Table 6; Fig. 1). For meter 1, the number of samples falling within the LOA approached 95% for all conditions. For meter 2, 95% of samples fell within the LOA for both sample types when diluted samples were excluded and approached the LOA for plasma when diluted samples were included. Additionally, inspection of the Bland–Altman graphs for meter 1 highlighted an apparent negative proportional bias. Deming regression of the association between difference and mean results in the Bland–Altman plots demonstrated proportional bias (slope, for which 95% CIs did not include 0) was present in all 4 graphs as follows: whole blood −0.47 (Fig. 1A), without diluted samples −0.15 (Fig. 1C); plasma −0.21 (Fig. 1B), without diluted samples −0.45 (Fig. 1D). A small proportional bias was also seen for meter 2 using plasma when diluted samples were included (0.20). These findings recapitulate those from the Deming regression and reflect the significant proportional error present for meter 1.
Bland–Altman analysis and total observed error (TEobs) calculations for 42 chicken whole blood and plasma samples. Analyses are reported with and without 7 diluted samples.
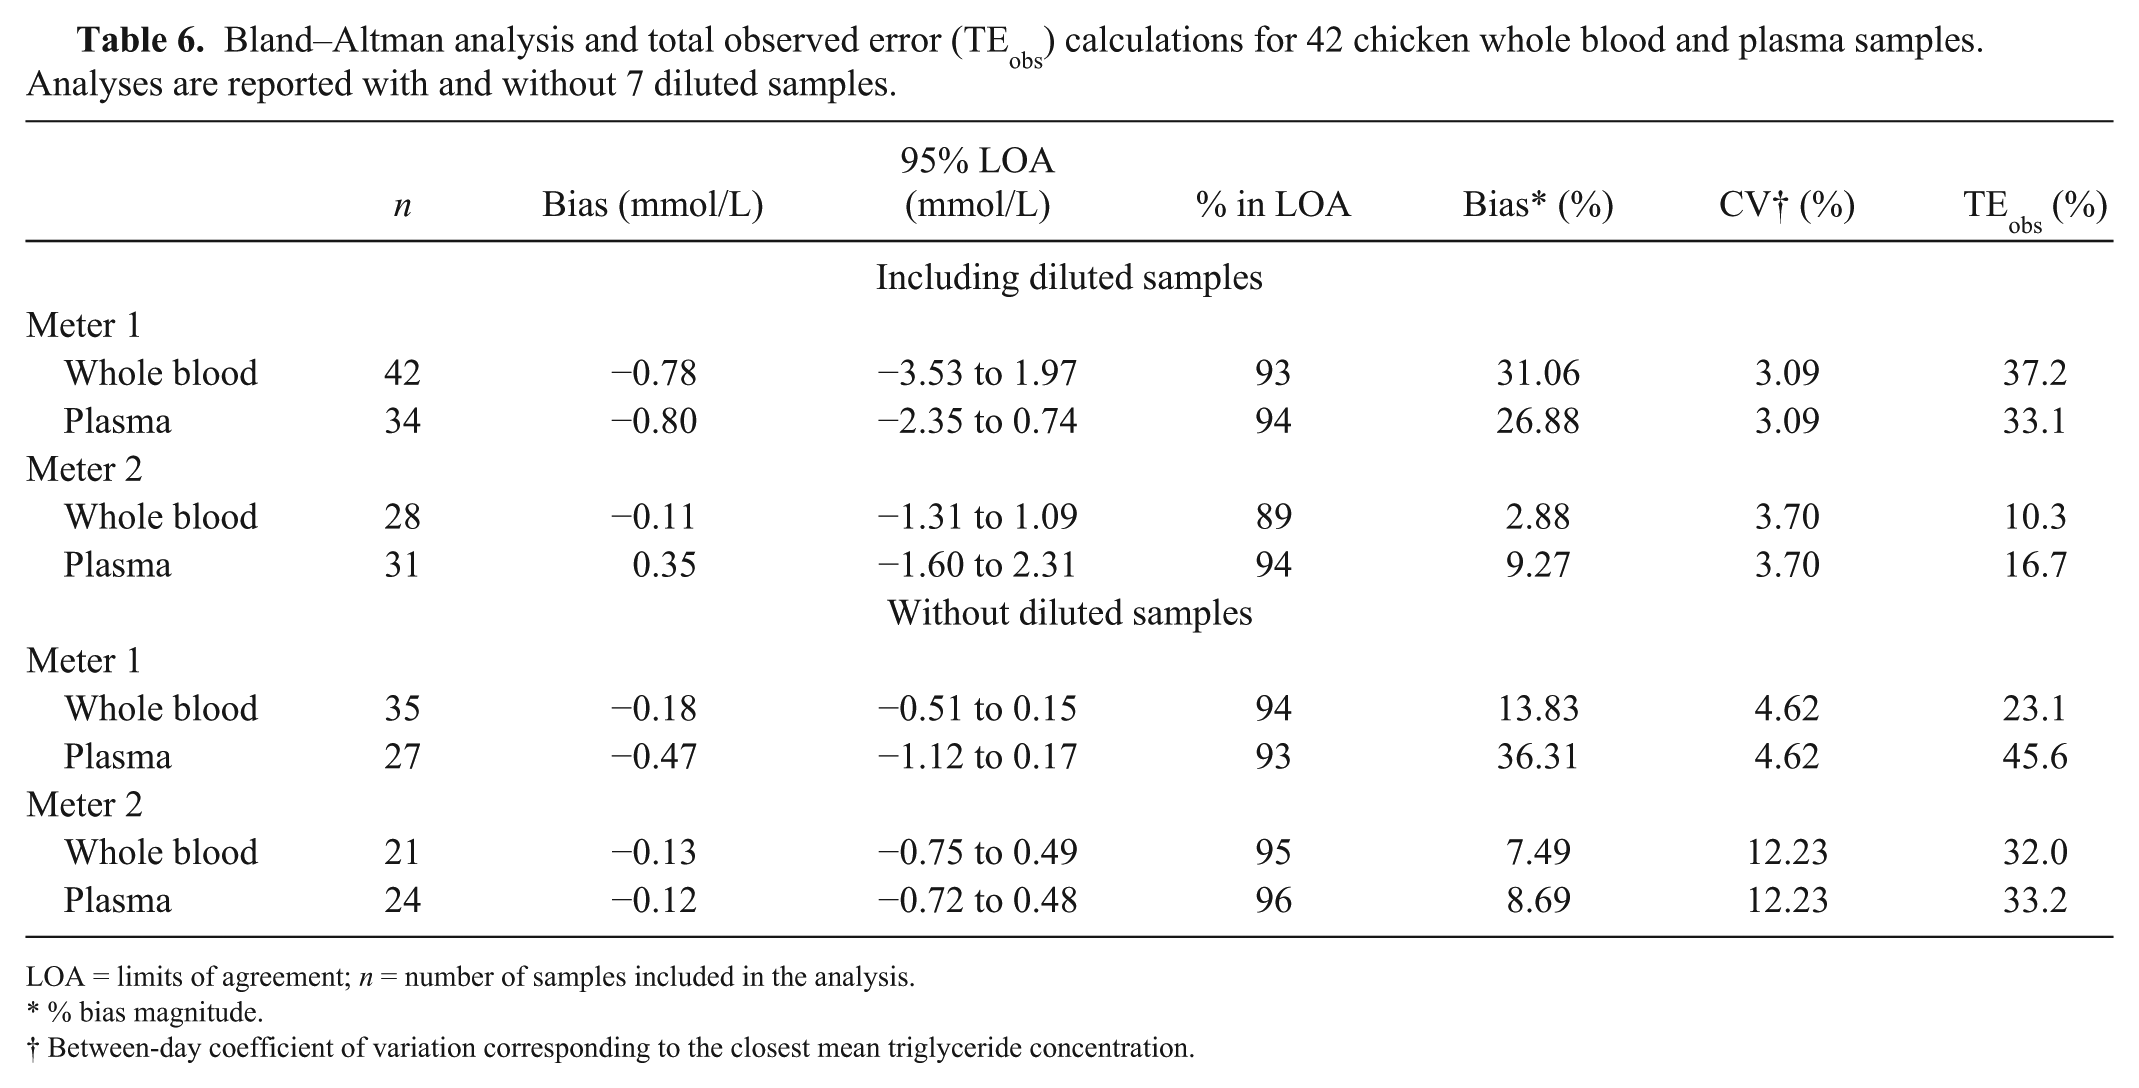
LOA = limits of agreement; n = number of samples included in the analysis.
% bias magnitude.
Between-day coefficient of variation corresponding to the closest mean triglyceride concentration.
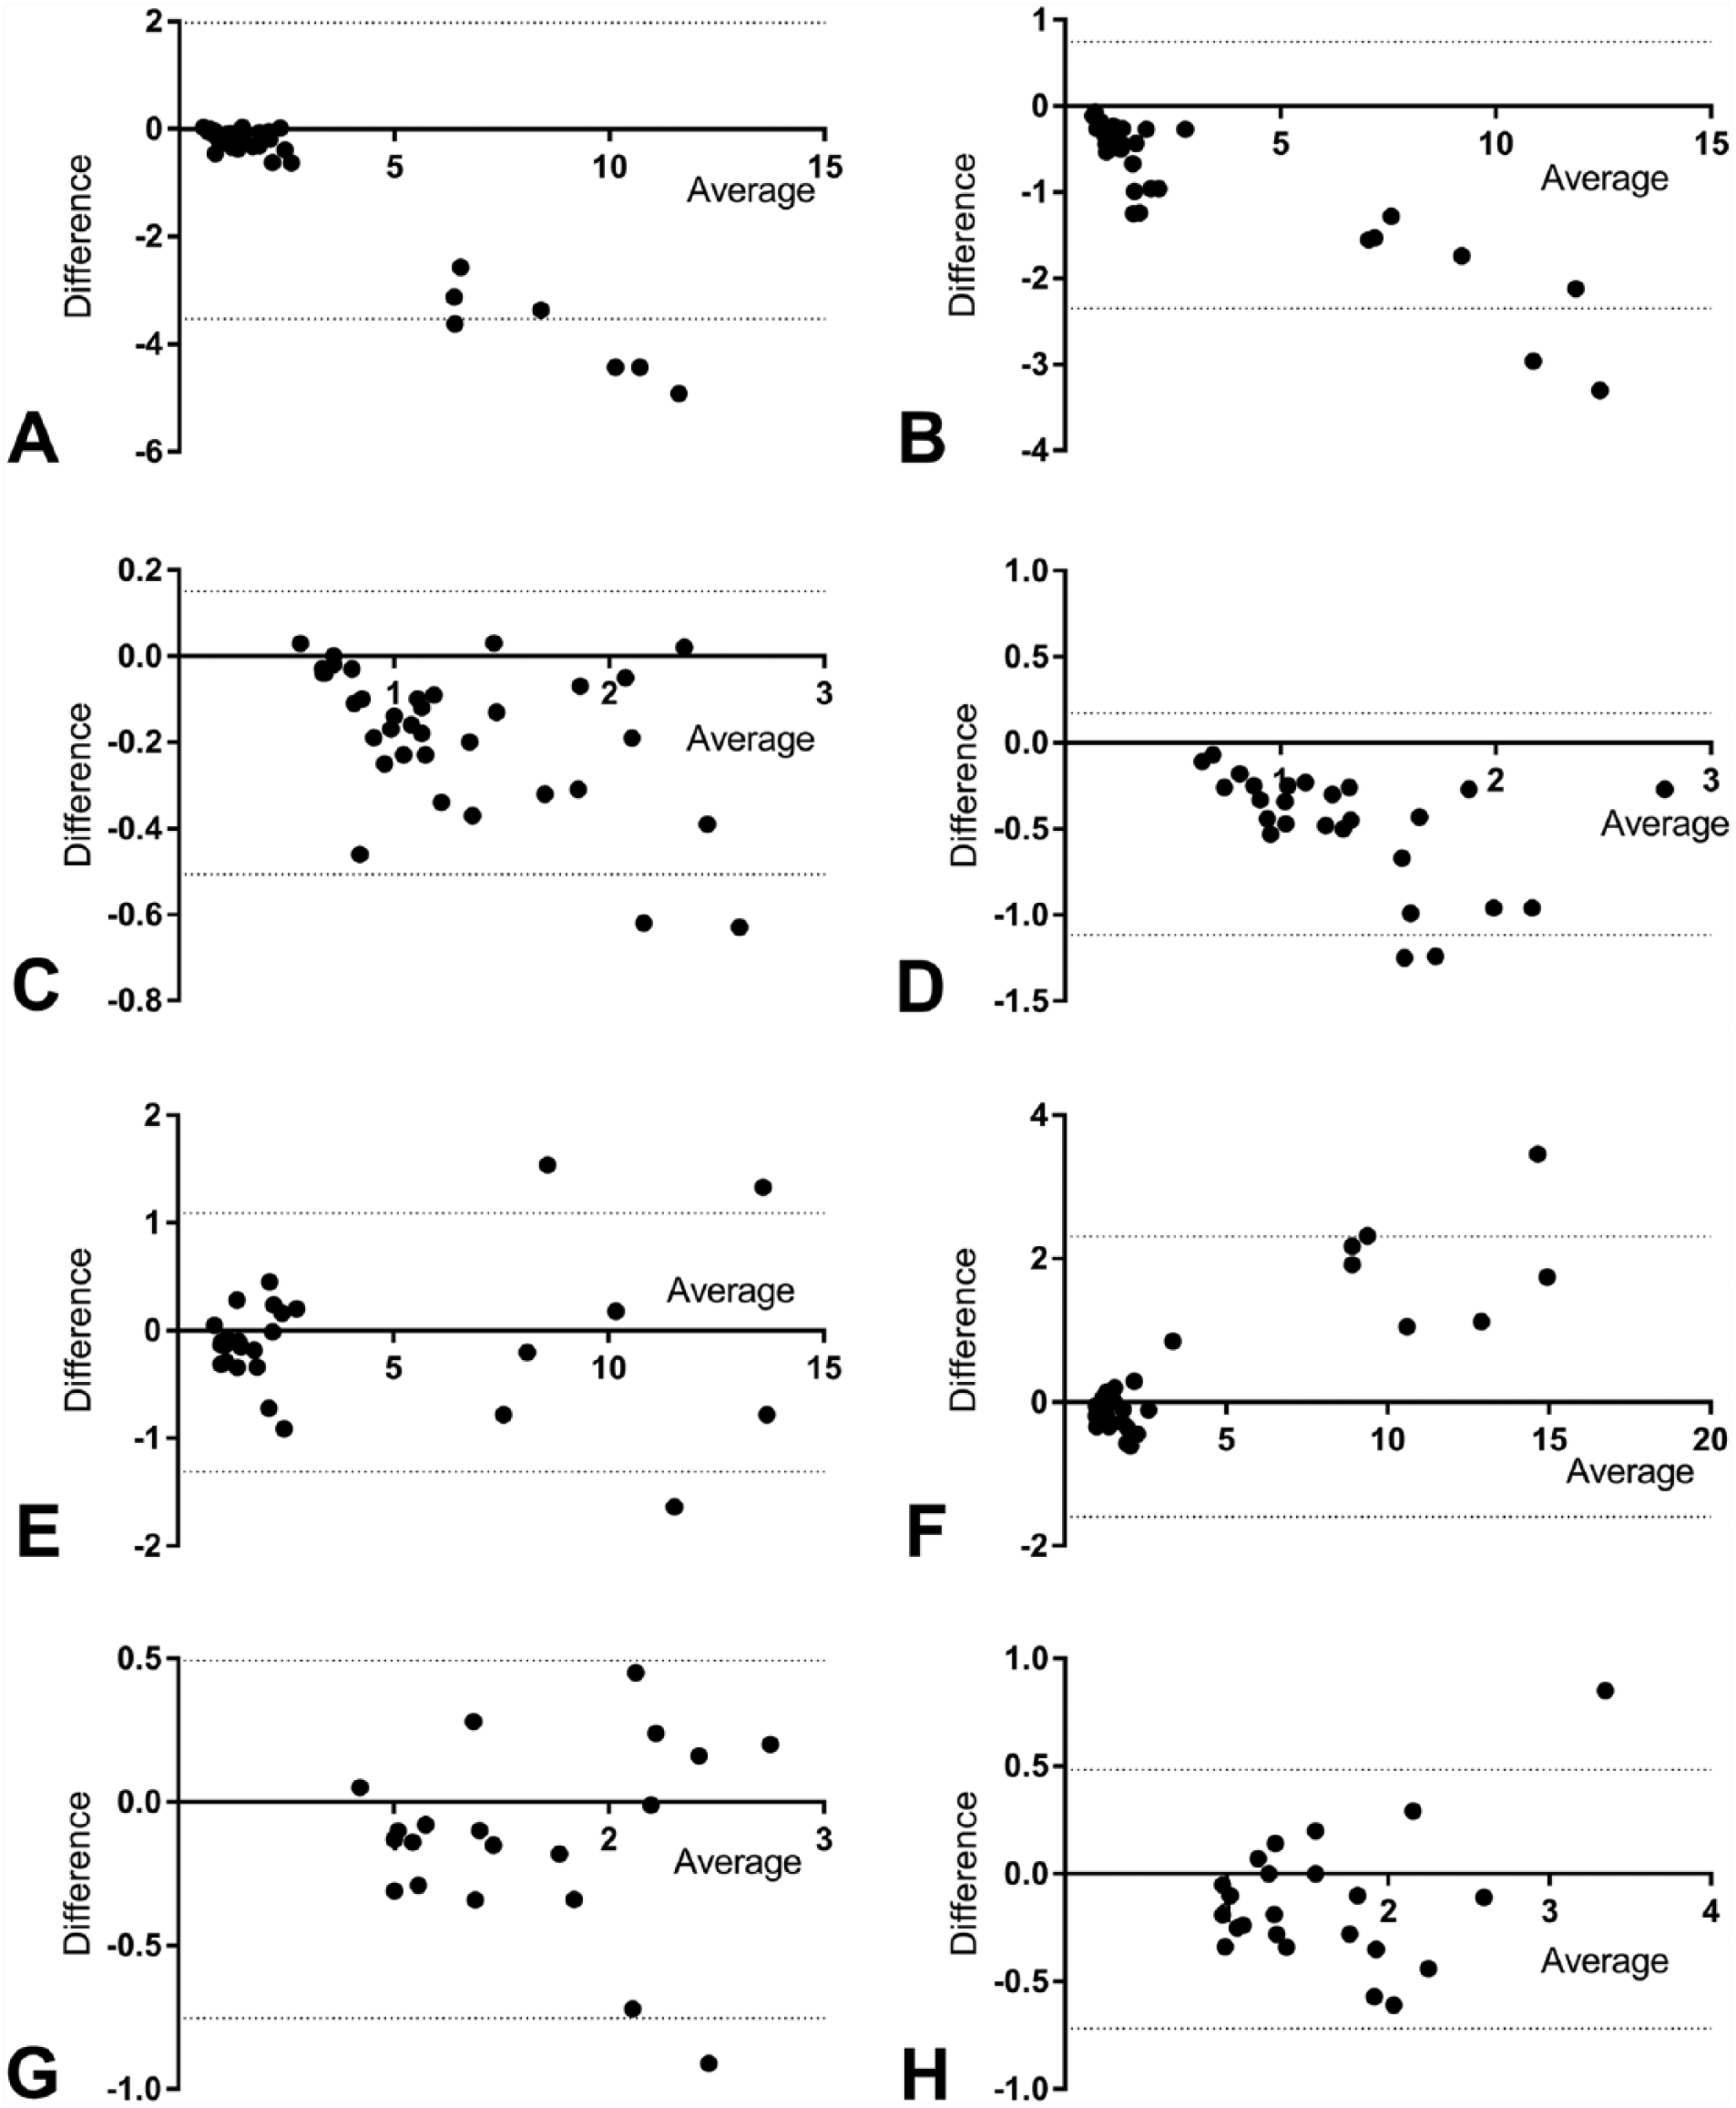
Bland–Altman analyses: y-axis (meter method – reference method); x-axis (mean of methods). Dotted lines represent the 95% limits of agreement.
Discussion
Meter 1 demonstrated good precision with all CV values well below our preset quality requirement of 10%. Meter 2 also demonstrated good within-day precision for plasma and between-day precision for plasma at higher concentrations. Within-day precision for blood and between-day precision for plasma at low concentrations were slightly above 10%. Given that meter 2 demonstrated higher within-day CV for whole blood than plasma and between-day CV could not be measured using whole blood because of the inability to freeze this sample type, it is likely that the between-day CV for meter 2 using whole blood is higher than desirable for POC meters. Further experiments could have been performed to determine the stability of triglyceride in refrigerated chicken whole blood, but this was considered beyond the scope of our study.
The results for the recovery experiment were acceptable for meter 1, whereas meter 2 showed marginally unacceptable low recovery for whole blood. There were clear differences between sample types for meter 2, with whole blood exhibiting low recovery and plasma high recovery. This suggests that there may be a matrix effect from both the red cells and plasma with meter 2, and further studies investigating this finding would be of interest. The dilution experiment demonstrated that dilution of samples provides meaningful results, and that using 0.9% saline without BSA was marginally better for all combinations except for meter 1 using whole blood, for which diluent containing 7% BSA was subjectively better. Dilution of samples is particularly relevant for birds with untreated reproductive problems because triglyceride concentration in healthy laying chickens may exceed 23 mmol/L (2000 mg/dL) and is occasionally considerably higher.12,17
Deming regression of the individual samples in our method comparison study revealed consistent proportional error with a slope <1 for meter 1 using both sample types, whereas concurrent constant error was present only when diluted samples were included; curiously, the error was positive for whole blood and negative for plasma, which suggests a possible matrix effect. The proportional error is reflected in the negative mean bias seen on Bland–Altman analysis. For meter 2, proportional and constant errors were observed only for plasma samples with the inclusion of diluted samples. The lack of proportional and constant errors for meter 2 for most conditions resulted in a smaller absolute bias on Bland–Altman analysis than generated for meter 1 and consequently lower %bias values.
TEobs was not within our quality requirement for meter 1, except for whole blood with diluted samples excluded, because of the high %bias; further investigation into the differences between avian and mammalian triglycerides that contribute to this bias would be very interesting but is beyond the scope of our study. Meter 1 had acceptable precision (CV within the requirement of <10%) for both whole blood and plasma, therefore this meter is acceptable if analyzer-specific reference intervals are established. The constant and proportional error were subjectively relatively modest and therefore unlikely to affect the clinical utility of the meter significantly, given that interpretation of readings above the reference limit are likely to be minimally affected.
TEobs was within our quality requirement of 25% for meter 2 when diluted samples were included, suggesting that meter 2 could be used in place of the reference method using established reference intervals. Meter 2 failed both of our quality requirements when diluted samples were not included, however, primarily as a result of the high between-day imprecision (CV > 10%) at low triglyceride concentrations of ~1 mmol/L. In addition, within-day imprecision for whole blood also exceeded the quality requirement for precision for both low and high triglyceride concentrations, albeit mildly. Plasma is therefore the preferred sample for meter 2, and results from this meter using whole blood or from samples with low triglyceride should ideally not be used if samples are only run once. To minimize the impact of higher imprecision when using whole blood or when triglyceride concentrations are at the lower end of the working range, duplicate patient samples could be run and the average recorded. Given the small sample volume required, this may be acceptable even in avian patients. Establishing meter-specific reference intervals would further minimize error resulting from bias.
Our study has some limitations. The lower reportable limits of the meters were relatively high, therefore numerous samples were excluded from the analysis, which limited the numbers available for method comparison. Ideally, a minimum of 40 samples is included for this type of method comparison. 7 One approach to this problem is to assign a nominal figure to samples below the reportable range, either just below the lower limit or just above zero; however, we considered that this would mathematically affect the mean bias sufficiently so as to make it inaccurate, and therefore chose to omit these readings altogether. For the purposes of our POC evaluation, we considered the numbers used sufficient to provide a meaningful analysis. Similarly, the upper reportable limits meant that some samples required dilution. The inclusion of diluted samples allowed the analysis of more samples over a wider range of possible concentrations, including those more relevant to patients with reproductive issues, and the dilution study demonstrated these samples generated acceptable results. Nevertheless, including diluted samples may remove some of the matrix effects of the sample type, and analyses were therefore also completed without these samples, which further limited the sample number. Clinical samples were also only measured once by each analyzer; measurement in duplicate may have improved the bias observed for the meters. A complete dilution and linearity study was not performed given the narrow range of the meters. This analysis is often omitted in POC validation studies because of a lack of feasibility. We therefore considered it sufficient to show that meaningful results are obtainable from diluted samples.
Our study has provided an initial investigation into the utility of 2 meters for measuring triglycerides in chickens. Although neither meter demonstrated flawless performance, both meters were able to measure triglycerides in chickens at clinically relevant concentrations and correctly identify samples with high triglyceride concentrations using whole blood and plasma. Further investigation into the clinical usefulness of these 2 meters in ovarian disease is therefore warranted. In addition, studies analyzing specimens from other avian species such as pet birds would be of interest, as well as establishing reproductive cycle–specific reference intervals to monitor response to treatment.
Footnotes
Acknowledgements
We thank Dr. Mark Cook, Maria Arendt, and Dr. Lily Parkinson for their help in acquiring the blood samples used in our study.
Declaration of conflicting interests
The authors declared no potential conflicts of interest with respect to the research, authorship, and/or publication of this article.
Funding
Funding was provided by the School of Veterinary Medicine, University of Wisconsin–Madison.