
Abstract
A review of the literature pertinent to interpretation of biochemistry data and quality control (QC) and proficiency testing data from 2 biochemistry analyzers was used to determine clinical quality requirements for biochemistry assays, characterize the performance of and calculate sigma metrics for the analytes run on the 2 analyzers, and perform QC validation in order to determine the needs for statistical QC for each analyzer. Quality requirements suitable for the analytes based on the needs of the authors' laboratory are presented. These requirements may or may not be appropriate for other laboratories, depending on the needs of the clients, species, and equipment performance capability. The majority of the analytes were easily controlled using the 13s control rule, with a sigma metric approaching or exceeding 6 and with a high probability of error detection and a low probability of false rejection. Some analytes could not be controlled using the 13s rule, and additional control rules with a greater number of control data points were required. There were differences between performances of the 2 analyzers. The findings in the present study emphasize the need for QC specific for the analyte and the clinical decision level and the need for separate QC validation on every instrument.
Introduction
Quality planning in veterinary laboratories includes defining quality standards as the foundation for quality laboratory processes, quality control (QC), quality assessment (QA), and quality improvement. The definition of quality requirements for various laboratory tests is an important aspect of veterinary quality planning as regulatory requirements applied to human laboratories do not exist for veterinary laboratories. The quality requirements, expressed as total allowable error (TEa), should indicate the degree of change that needs to be detected in an analyte for a clinically important decision to be made with regard to further investigation or treatment. For example, the reference interval for canine albumin used in the authors' laboratory is 25–41 g/l. A decrease in albumin from 25 to 24 g/l (a 4% change) is unlikely to stimulate further investigation, so a change as small as this does not need to be detected. However, a change from 25 to 22.5 g/l (a 10% change) is more likely to be clinically significant. 16 Therefore, the quality requirement determined for this test is TEa = 10%.
Quality requirement varies greatly between analytes. For example, serum electrolyte levels are strictly regulated physiologically; therefore, small changes are likely to be clinically significant. In contrast, liver enzymatic activities show much greater variability; therefore, much larger increases are required to cause a clinically significant change that warrants further investigation or treatment. The quality requirements selected are likely to differ between laboratories based on the clientele, species of interest, and use of the laboratory data.
Once quality requirements have been established, the requirements can be analyzed with reference to actual performance within the laboratory in order to
determine if this level of quality is achievable given the actual performance of the analyzer(s) used;
determine what QC is needed to detect variation that affects the clinical interpretation of the results; and
determine the need for quality improvement.
Quality control validation is used to determine the statistical QC procedures that are appropriate for detecting errors that may be important in clinical interpretation of the test and to determine the QC rules that can be applied to each test in order to have a high probability of error detection (Ped) and low probability of false rejection (Pfr) of test results. Quality control validation is the final step in validation of methods and instruments, and it ensures that appropriate statistical QC is being applied. 4
Sigma metrics are tools that are rapidly gaining popularity in laboratory applications (Riebling N, Tria L: 2005, Six Sigma project reduced analytical errors in an automated lab. Available at http://www.mlo-online.com/articles/0605/0605clinical_issues.pdf. Accessed January 9, 2008; Westgard S: 2003, From method validation to Six Sigma: translating method performance claims to into sigma metrics. Available at: http://www.westgard.com/lesson78.htm. Accessed April 4, 2008; Westgard JO: 2002, AACC expert access: a Six Sigma primer. Available at: http://www.westgard.com/sixsigprimer.htm. Accessed April 4, 2008). 5,8,9,12–15 Six Sigma is a process quality measurement and improvement program developed by Motorola in the early 1980s. Sigma methodology can be applied wherever an outcome of a process can be measured. A poor outcome is counted as an error or defect. This is quantified as defects per million (DPM). Sigma (σ) is the mathematical symbol for standard deviation (SD).
Approximately 99.73% of all results from a normal population (i.e., results that are equally distributed above and below the mean) fall within 3 SDs of the mean. Six Sigma focuses on controlling a process to 6 SDs, which equates to 3.4 DPM opportunities. Achievement of Six Sigma quality is considered to be a standard of excellence. 12 Performance at the 3-sigma level is considered the minimum acceptable quality for a production process. 12 In simpler terms, a higher sigma metric means the systematic error that must be detected to help ensure accurate results by the use of statistical QC is large and should be more easily detected. A lower sigma metric means QC must detect smaller systematic errors, which is more difficult. Six Sigma philosophy purports that there is a direct relationship between the number of product defects, wasted operating costs, and levels of customer satisfaction. Therefore, as sigma increases, the reliability of the test improves, operating costs are reduced, and customer satisfaction is increased:

where TEa is the total allowable error; Biasobs is the bias, or accuracy, of the test; and Sobs is the coefficient of variation (CV), or precision, of the test. All are expressed as percentages.
Laboratory performance can be evaluated using Six Sigma. The process involves the following:
Defining the quality requirements for the test (expressed as TEa);
Quantifying the performance of the test using standard statistical QC methods;
Analyzing the data and calculating a Six Sigma value;
Improving and optimizing the process based on the results of analysis; and
Continuing the measurement and control of the test.
The current report describes the authors' experience of sigma metrics and QC validation for 2 biochemistry analyzers (Olympus AU640 and AU2700) a used in a veterinary reference laboratory. The objectives of the study were to
determine clinical quality requirements for biochemistry assays based on a review of the literature and current interpretation of clinical biochemistry profiles for common domestic species seen in the authors' laboratory (dog, cat, and horse);
characterize the performance of, and calculate sigma metrics for, the tests run on the 2 analyzers to determine if significant differences in performance are present, and the best approach for optimizing the statistical QC for the clinical biochemistry assays (both analyzers were introduced into the laboratory at the same time and were new instruments at the time of installation); and
perform QC validation to determine the needs for statistical QC for each analyzer.
These objectives would enable the authors to understand the performance of the 2 analyzers in use in the laboratory, determine if significant differences are present, and provide the best approach for statistical QC. Reporting these findings may encourage and help other veterinary investigators and diagnosticians to analyze the performance of Olympus or other biochemistry analyzers in their own laboratories.
Materials and methods
Laboratory materials
Internal statistical QC data was extracted from the Olympus AU2700 and AU640 biochemistry analyzer records for the previous 6 months. Control materials were run daily. The number and levels of controls were selected on the basis of traditional internal QC practice, traditional availability, and cost. 4 Both low and high QC material were assayed at the beginning of each day, and then within each run, QC materials, alternating high and low materials, were assayed. b There were no more than 60 patient samples between QC materials.
Operation was considered stable during this time based on traditionally used, commercially available QC materials, and using an arbitrary choice of 3 SDs above and below the mean as acceptable performance (13s rule). No significant problems in performance were identified. Calibrations were done according to manufacturer's recommendations. The reference intervals used in the study are the authors' laboratory-established reference intervals for adult animals.
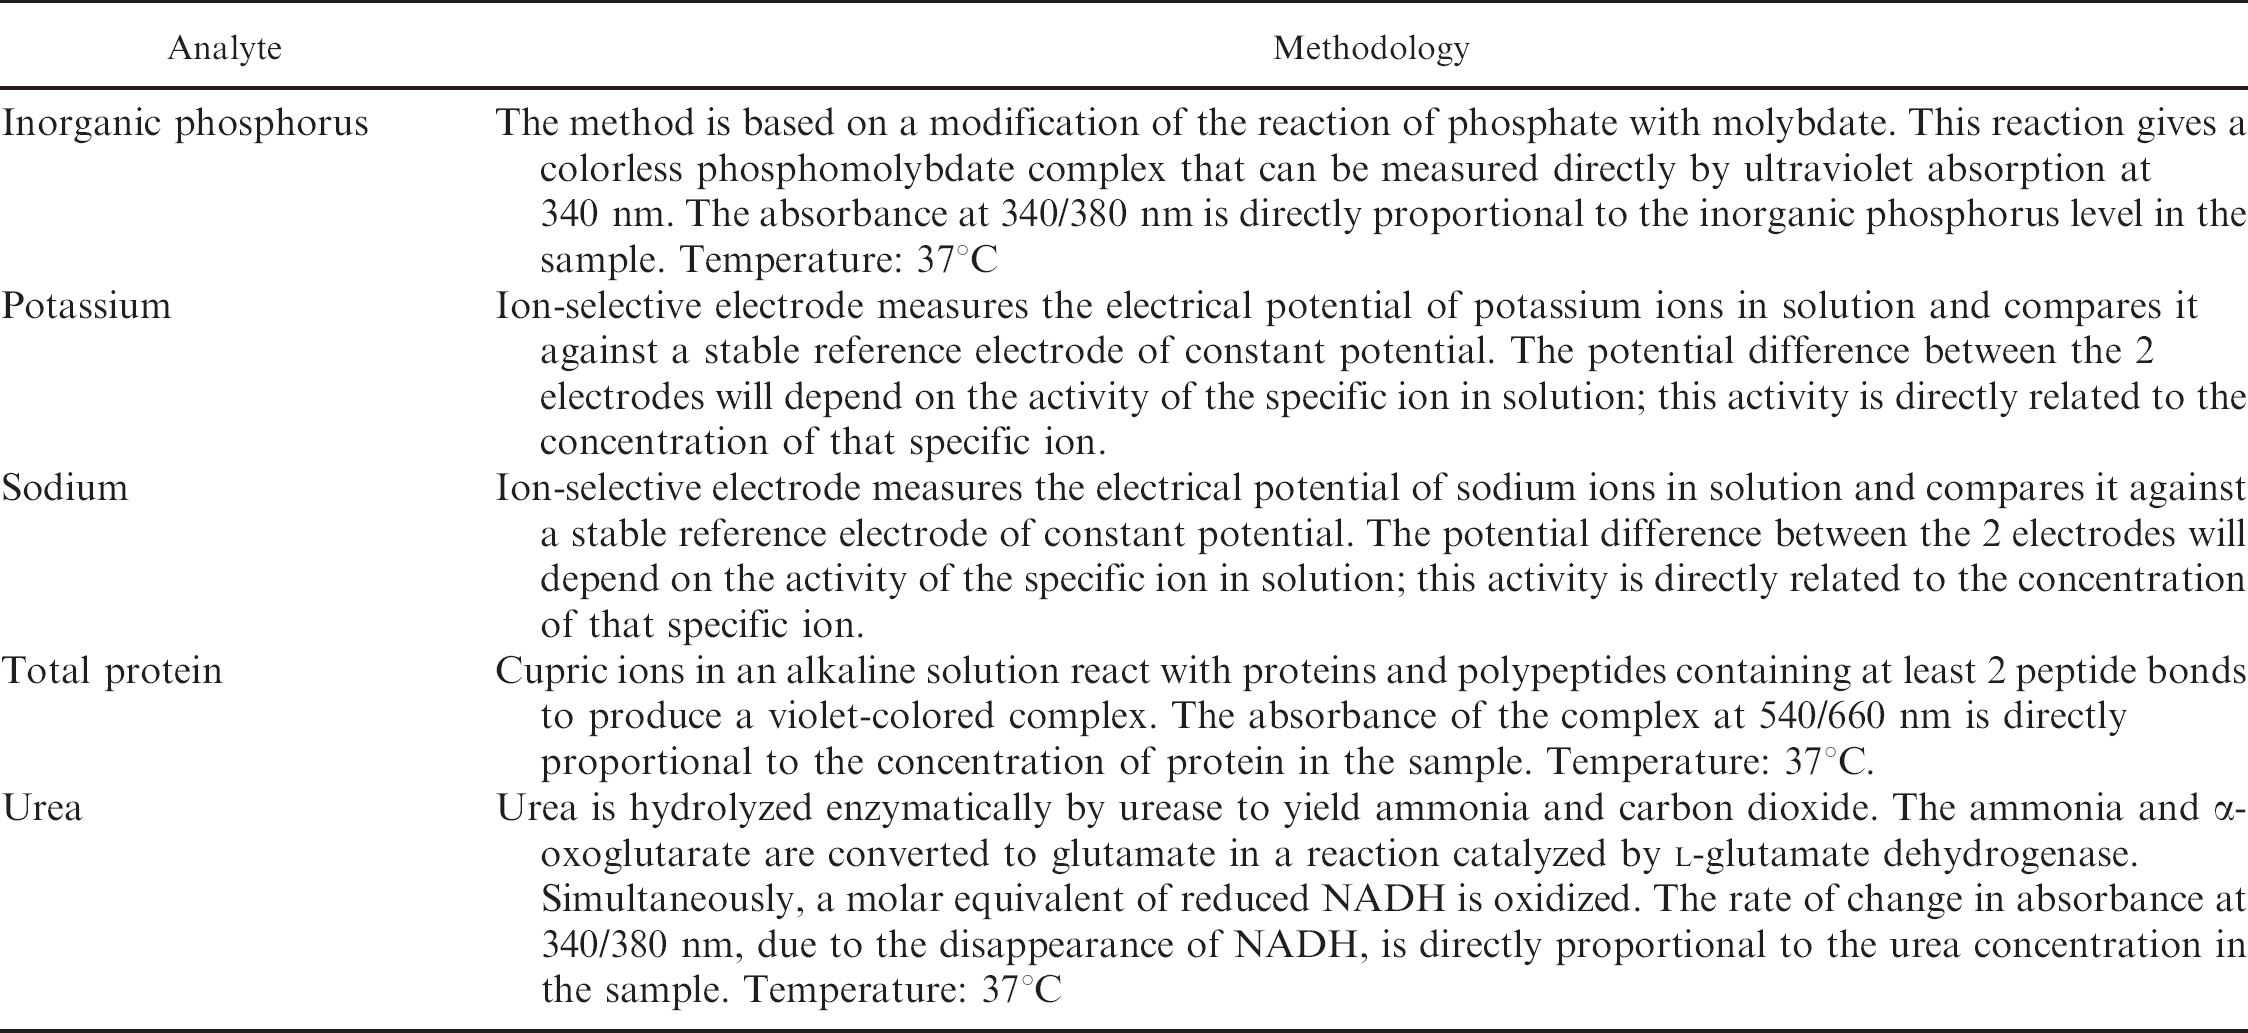
Chemistry analytes included albumin, alkaline phosphatase, alanine aminotransferase, amylase, aspartate amino-transferase, bile acids, total bilirubin, total calcium, chloride, cholesterol, creatine kinase, creatinine, gamma glutamyl transferase, glucose, lipase, inorganic phosphorus, potassium, sodium, total protein, and urea. The methodology used to measure each analyte is summarized in Table 1.
Quality requirements for analytes
The quality requirements for various analytes have not been previously defined. Defining quality requirements has been recommended as a starting point for quality planning by Westgard 13 and the National Committee for Clinical Laboratory Standards 1 and is implied by International Organization of Standardization requirements for “fitness for use.” 6
Analytic quality requirements were chosen based on review of the veterinary literature 2,3,7,10,11,16 and routine clinical use of data for medical interpretations based on internal clinical pathology discussions within the authors' laboratory. Although the Clinical Laboratories Improvement Act (CLIA) guidelines exist for human laboratories in the United States, there are no clinical quality requirements for veterinary laboratories in any country. Quality requirements were determined for cats, dogs, and horses, as these are the species most commonly encountered in the authors' laboratory. Quality requirements were determined for high, low, and/or reference values for each analyte. The quality requirements eventually used in the study were all either high or low. The level at which a change should be detectable by the assay is called the clinical decision level. The strictest of these quality requirements was used as the starting point for QC validation. For example, for creatine kinase (reference interval: 20–225 U/l) there was a need to detect a change in creatine kinase activity at approximately 340 U/l on exercise tolerance tests in horses with suspected rhabdomyolysis (clinical decision level of 340 U/l). The requirement in cats and dogs was considered to be less strict than this; therefore, the equine quality requirement was chosen as the most stringent for the study. The calculation for quality requirement is shown.
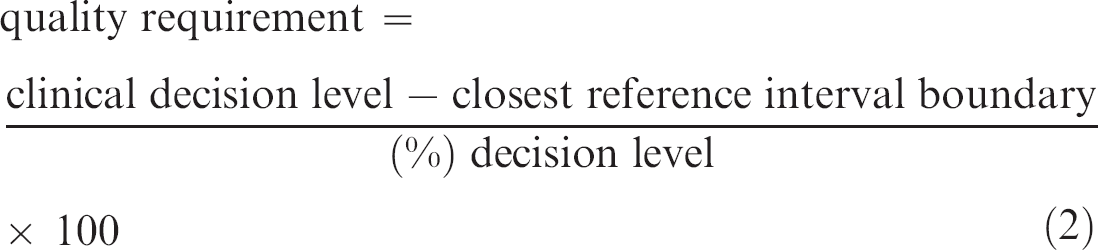
Example using creatine kinase activity in the horse (reference interval: 20–225 U/l):

Performance data
For QC validation, internal quality control (IQC) data were used to determine the CV. External quality assurance (EQA) data b,c were used to determine bias for each analyte. The QC materials currently used in the authors' laboratory had not been specifically chosen based on the levels of clinical significance but on factors such as cost and commercial availability. The level of control material or QA data point closest to the level of clinical significance with the most stringent quality requirement was used to determine the CV and bias (Westgard S: 2003, From method validation to Six Sigma).
The CV was estimated by calculating the mean from 6 months of IQC data. The CV for the control material most closely approximating the level of clinical significance with the most stringent quality requirement was used:

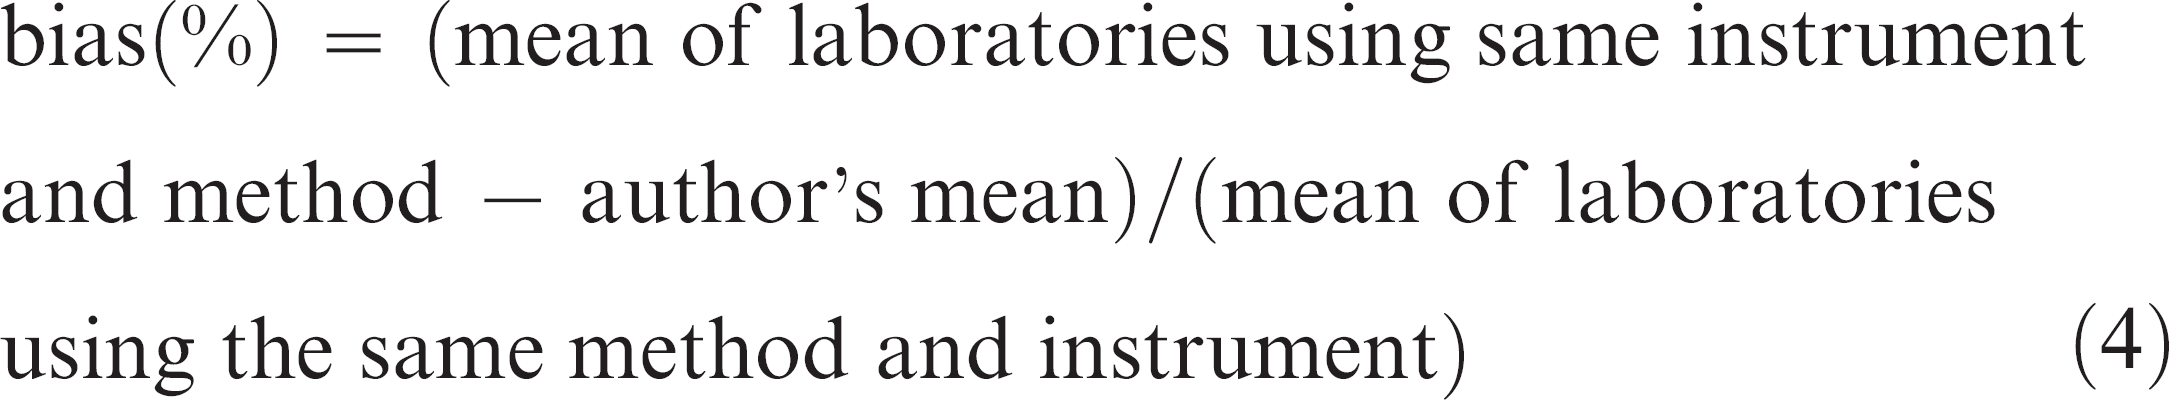
The bias was determined by calculating the mean bias from EQA reports for 6 months for the control material most closely approximating the level of clinical significance with the most stringent quality requirement:
Analysis
Westgard rules are a commonly used system of multiple rule QC developed by Westgard and colleagues in the 1980s. 14 The rules can be used to decide when a control result should be rejected, necessitating additional investigation to determine if accurate results are obtained. The Westgard rules are abbreviated to a shorthand form for simplicity. The number of control data points to be considered is indicated by an Arabic numeral. The acceptable variation (in SD[s]) from the mean is indicated by a subscript. For example, the 13s rule: when a single result is more than 3 SDs above or below the mean (expected value for the control), the 13s rule has been violated. Similarly, the 22s rule is violated when 2 consecutive controls are 2 SDs above or below the mean. There are many variations on these rules, and the rules can be added together to create multi-rules (e.g., 13s/22s/R4s). Multi-rules are applied in sequence and are triggered by a violation of the 13s rule.
When applying any criteria (including Westgard rules) for acceptability of control data, a high probability of error detection and a low probability of false rejection are desirable. Westgard's recommendation for >90% Ped and <5% Pfr as desirable criteria for biochemistry applications was used in the present study.
The EZ Rules d statistics package was used for analysis of the results, and a sigma value was produced for each analyte on each machine. The data are entered into the EZ Rules software using a “startup” design as the most stringent statistical QC requirement. The program is arranged in a series of self-prompting steps. For the section on expected test instability, the <2% option was selected as excellent stability from the authors' experience with the instruments and reagents. Two control materials were indicated to be the preferred option for number of control materials.
An Opspecs (operating specifications) charte is then produced automatically by the program, which shows the operating point for the assay. The sigma metric result, selected QC rule, probability of false rejection (Pfr), and the probability of error detection (Ped) are displayed. The sigma metric result is calculated using Equation 1. A Ped of >90% and a Pfr <5% were considered desirable for the startup QC (Westgard JO: 2006, Good laboratory practices (GLPs) for statistical quality control. Part II: QC limits and limitations. Available at: http://www.westgard.com/essay103.htm. Accessed April 4, 2008).
Results
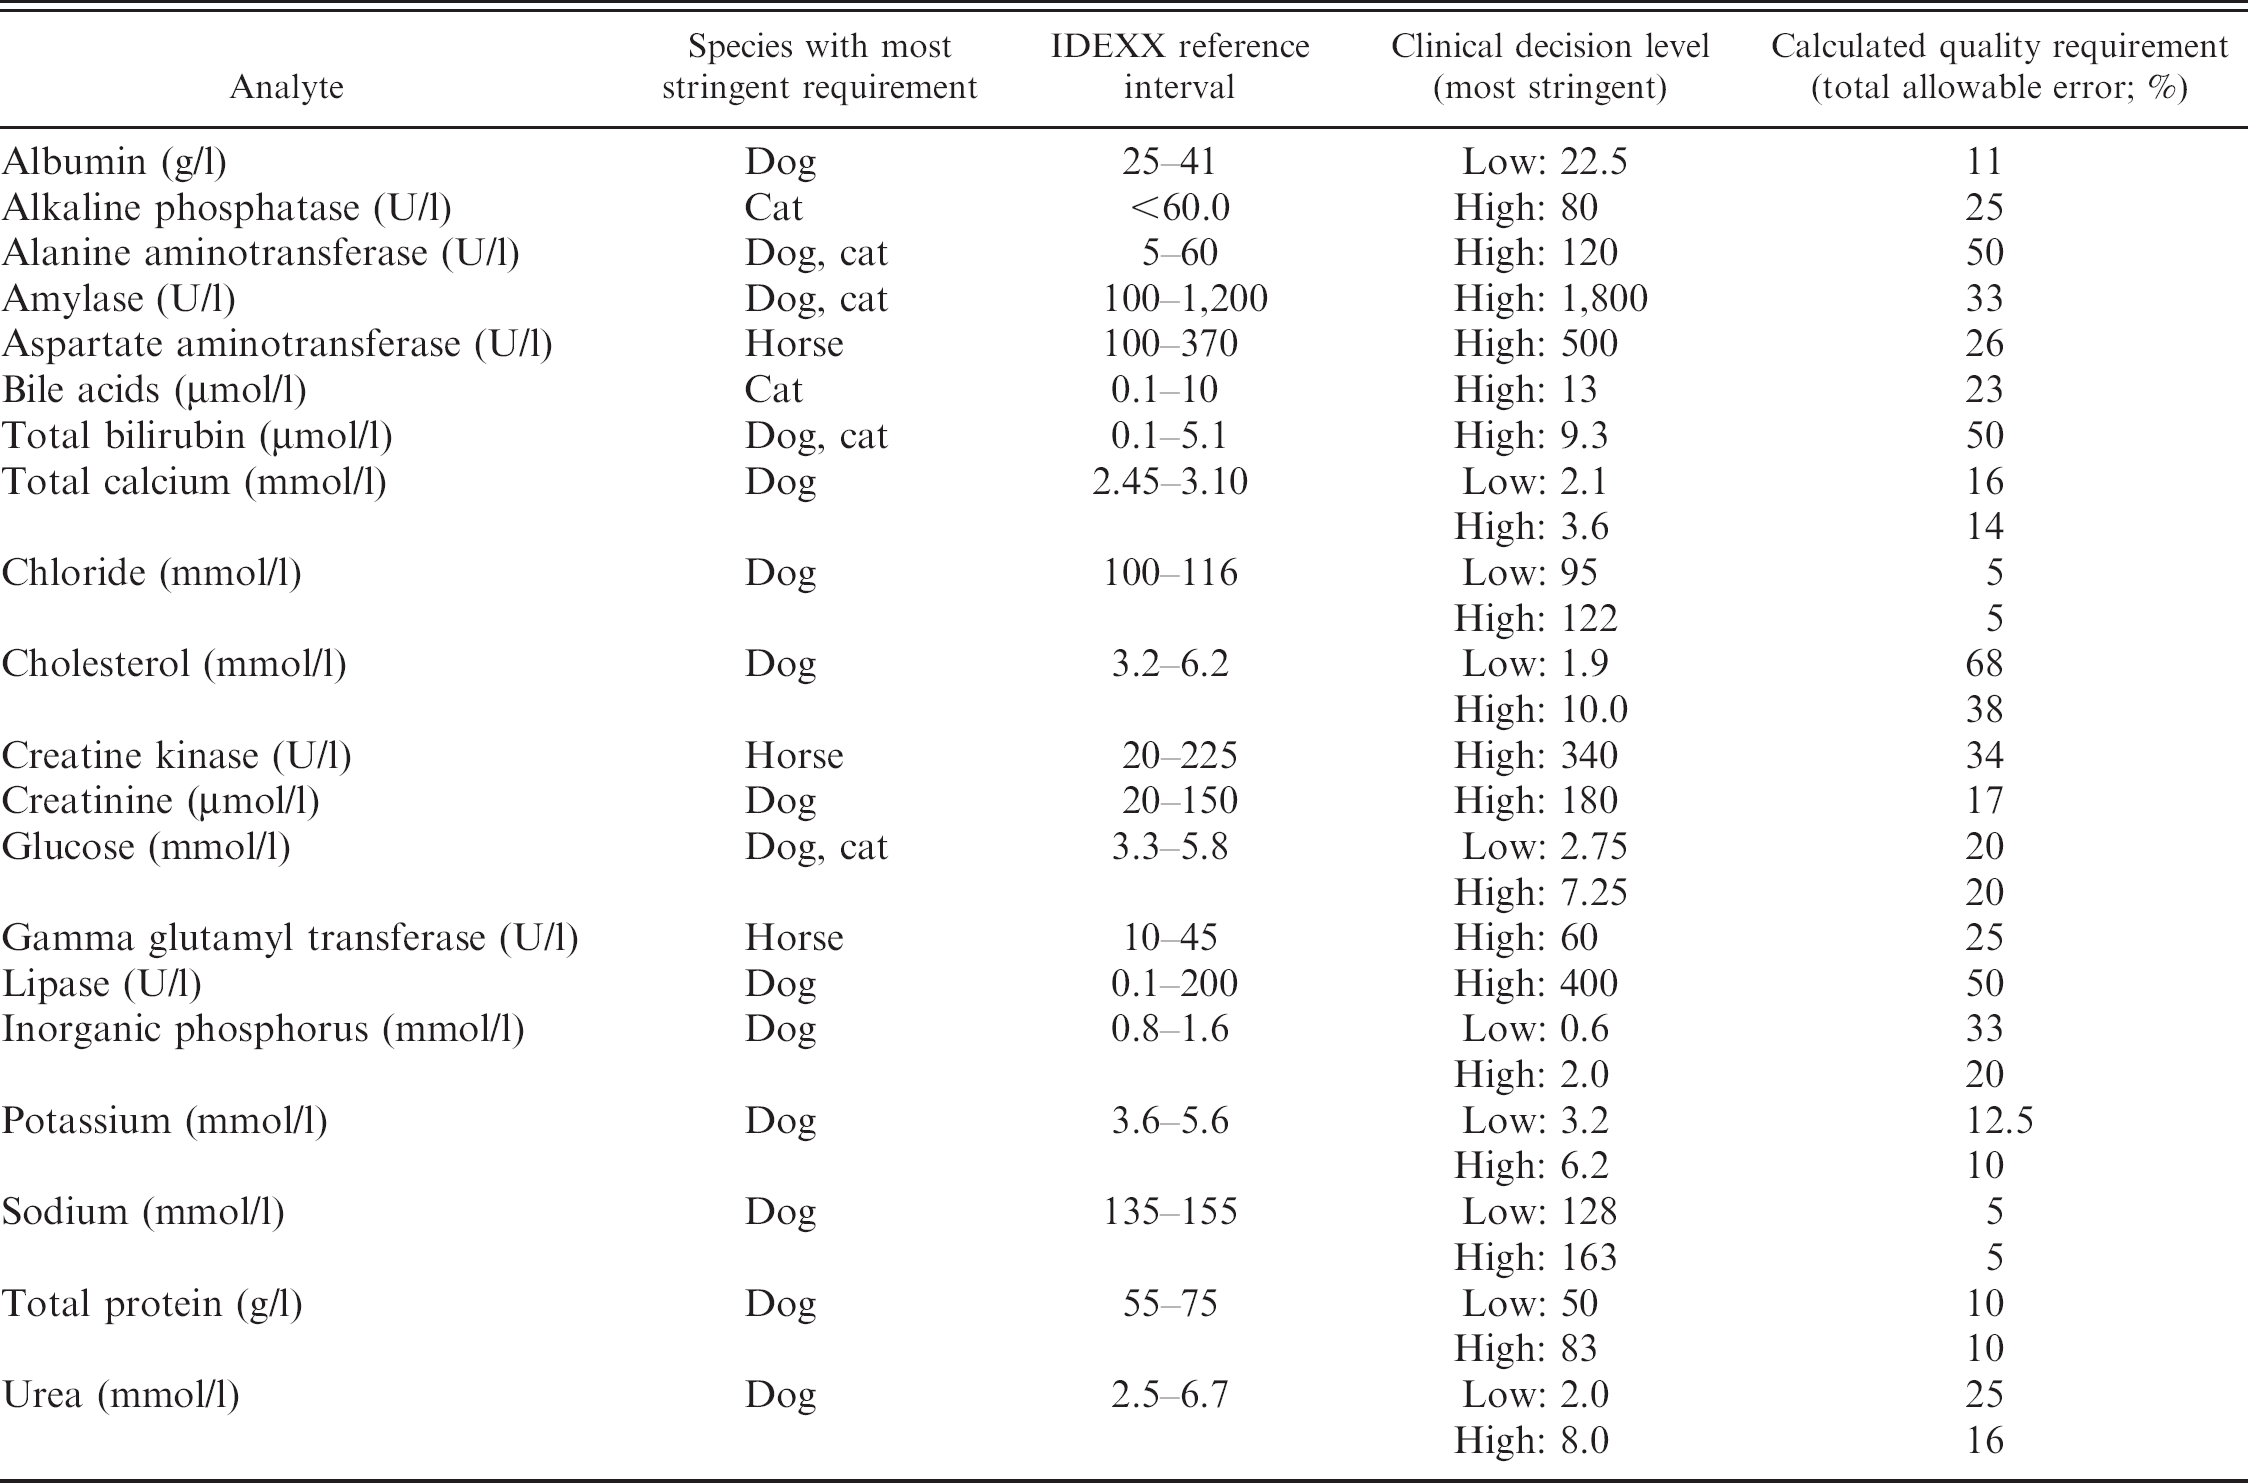
The quality requirements for the biochemistry analytes are presented in Table 2. The most stringent requirements based on review of standard texts for dogs, cats, and horses were chosen. 1,3,4,6,9,11 A summary of the QC validation information for both analyzers is presented in Table 3.
The 13s rule was applied as the starting rule for all assays because it was applicable with >90% Ped and <5% Pfr for 24 out of 29 analytes on the AU640 analyzer, and 21 out of 29 analytes on the AU2700 analyzer. To achieve a Ped of ≥90% and a Pfr of ≤5% for those analytes highlighted in Table 3, different control rules and/or numbers of control material data points would be needed (see Tables 4 and 5).
Discussion
The choice of clinical quality requirements for each analyte, expressed as TEa, was based on a review of the literature and current interpretation of clinical biochemistry profiles for common domestic species seen in the authors' laboratory (dog, cat, and horse). The requirement was selected based on the change in the analyte that would need to be detected in order to make a clinical decision based on that change. For many of the analytes (for example, all of the enzymes), the change that would affect a clinical decision is relatively large (up to 50% for alanine aminotransferase and lipase activities). However, for some of the analytes, a relatively small change will affect the clinical decision in the management of the case. For example very small changes (as little as 5% for sodium concentration) in electrolytes must be detected because they are tightly controlled physiologically. Unless the precision and bias are low, smaller amounts of error are difficult to detect and may require more rigorous IQC using multi-rule(s) and/or larger numbers of control material data points.
Some of the quality requirements decided at the beginning of the study, based on the literature review and desired clinical application, either did not have a statistical QC solution or required extensive QC that was considered too laborious or expensive to be of practical use. For these analytes, the clinical quality requirement needed to be altered. For example, the desired glucose quality requirement at the lower end of the reference interval was the most stringent requirement for glucose, with a total allowable error of 10%. The CLIA guidelines also recommend a total allowable error of 10% in humans. When the instrument performance was determined for the glucose assay over 6 months, the sigma value was extremely low, and Pfr and Ped unacceptable using this total allowable error. Repeating the calculations using different rules was unrewarding, so the decision was made to alter the clinical decision requirement to 20% for this analyte. For similar reasons, the sodium quality requirement was increased from 3% to 5%, total bilirubin was increased from 32% to 50%, and the calcium requirement was increased from 10% to 14–16%. These alterations were considered acceptable in order to achieve a high Ped, low Pfr, and balance with regard to cost and number of control materials.
Knowledge of the achievable clinical quality based on individual instrument performance is important for clinical pathologists and/or clinicians interpreting results. It is important to realize the error that may be present due to bias and/or imprecision, as well as the amount of error that can be detected by the statistical QC used for that analyte.
Analytes that were easily controlled, with a sigma value approaching or exceeding 6, a high probability of error detection, and a low probability of false rejection included alkaline phosphatase, alanine aminotransferase, amylase, aspartate aminotransferase, bile acids, total bilirubin, calcium, cholesterol, creatine kinase, creatinine, gamma glutamyl transferase, lipase, potassium, and sodium (on the AU640 analyzer and for the high result on the AU2700 analyzer). Additionally, although the probability of error detection was slightly less than desired for albumin (AU640 analyzer), chloride (low level), and glucose (high level), it was felt that these results allowed strong confidence in the results obtained when a 13s rule was applied.
Analytes that were difficult to control (based on a low sigma value [<5] and Ped of <95%) included albumin (AU2700 analyzer), low glucose (both analyzers), high glucose (AU640 analyzer), low inorganic phosphorus (AU2700 analyzer), low sodium (AU2700 analyzer), low total protein (both analyzers), and high total protein (AU2700 analyzer). The control rules and number of data points needed to achieve improved Ped and Pfr are presented in Tables 3 and 4. These require multi-rules for QC. This application of multi-rules may require additional technician training and may not be easily flagged by instrument QC software.
Summary of the methodologies used to measure selected analytes
Summary of clinical decision levels and calculated quality requirements
Summary of quality control validation information on the Olympus AU640 and AU2700 analyzers.*
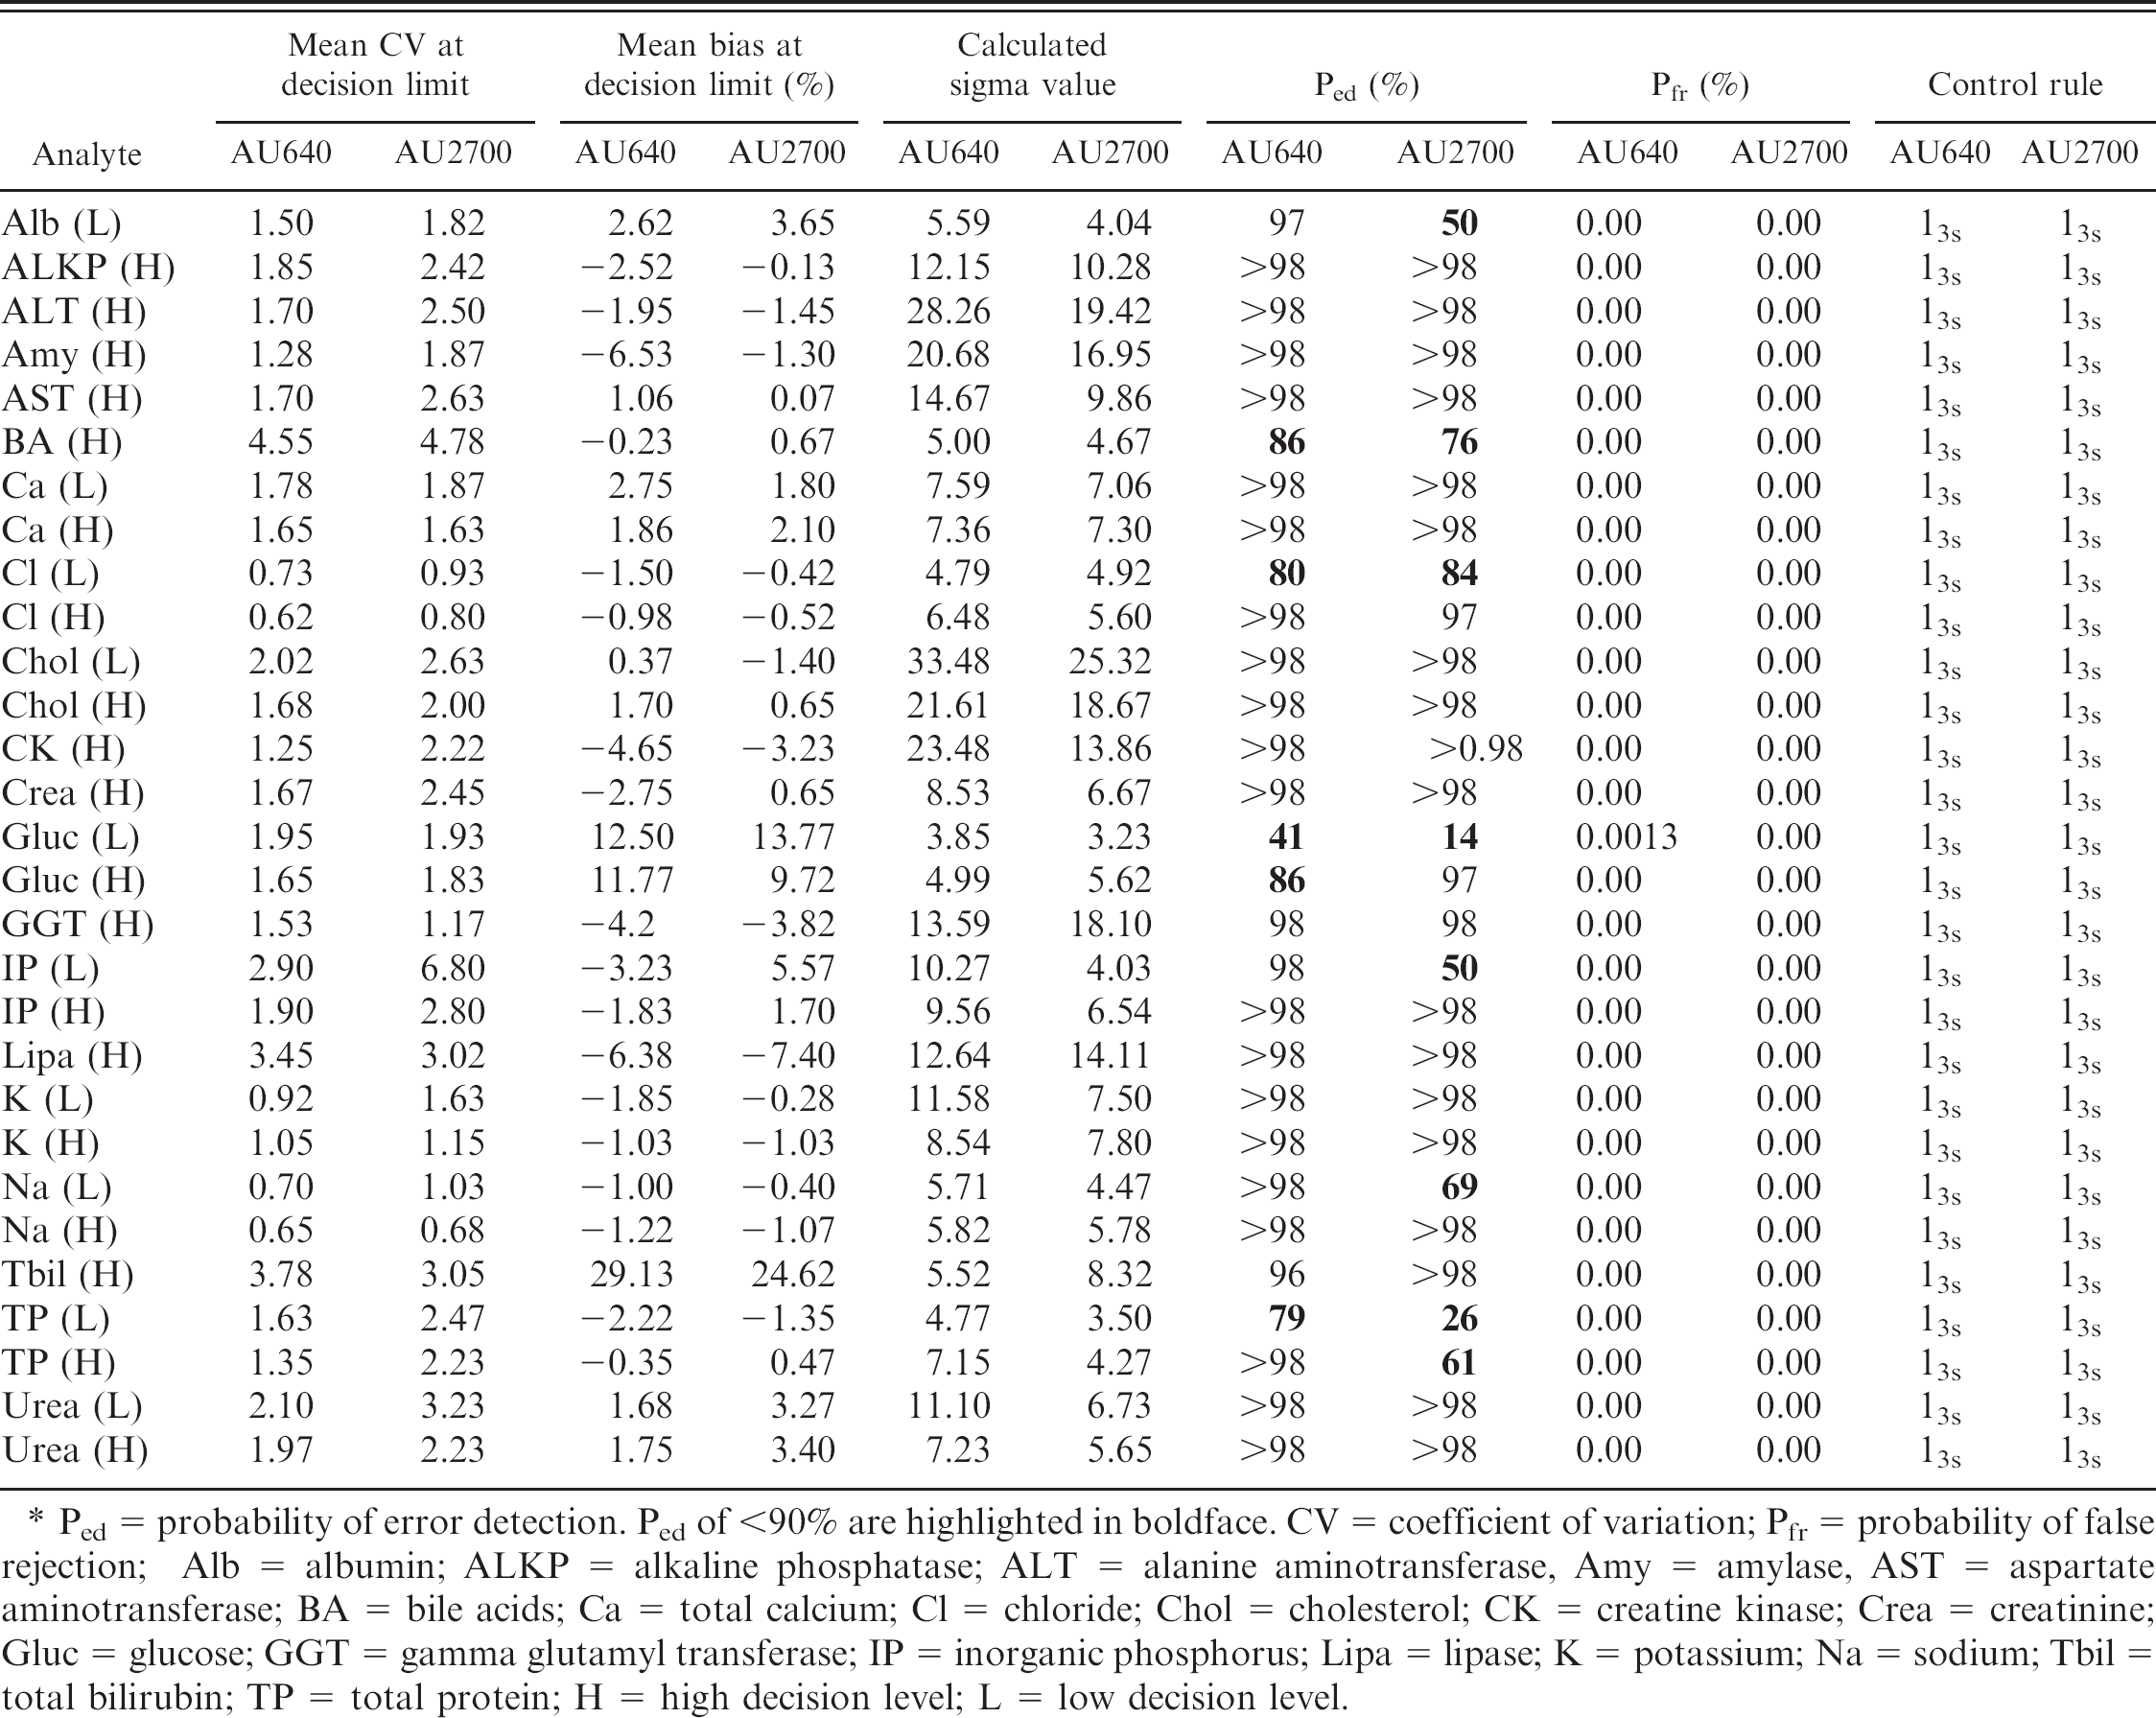
Ped = probability of error detection. Ped of <90% are highlighted in boldface. CV = coefficient of variation; Pfr = probability of false rejection; Alb = albumin; ALKP = alkaline phosphatase; ALT = alanine aminotransferase, Amy = amylase, AST = aspartate aminotransferase; BA = bile acids; Ca = total calcium; Cl = chloride; Chol = cholesterol; CK = creatine kinase; Crea = creatinine; Gluc = glucose; GGT = gamma glutamyl transferase; IP = inorganic phosphorus; Lipa = lipase; K = potassium; Na = sodium; Tbil = total bilirubin; TP = total protein; H = high decision level; L = low decision level.
When comparing the performance and sigma metrics of the analyzers, the 13s rule was acceptable for 24 of 29 analytes on the AU640 machine and 21 of 29 analytes on the AU2700 machine. Sigma metrics for these tests ranged from 5.52 to 33.48 and, as expected, these tests were easily controlled with statistical QC using a single rule. For a small number of analytes (albumin, total protein, and inorganic phosphorus), the performance differed significantly between the 2 analyzers. Based on identification of significant performance differences between the analyzers for measurement of inorganic phosphorus, and subsequent identification of high bias on external QC data for the AU 2700 analyzer, a factor change was introduced. The lamp was also replaced in the AU2700 machine because it had come to the end of its recommended use period. Weekly lamp checks were performed as part of the routine maintenance, so it is unlikely that the aging lamp had any significant impact on the results. Despite excellent technical follow-up, there was a persistent difference in performance between the AU640 and the AU2700 for inorganic phosphorus. No technical reasons for the difference in performance of the 2 analyzers could be identified, even though the same reagents and methods were used for both machines.
Summary of the control rule and number of data points required to achieve an improved probability of error detection (Ped) and probability of false rejection (Pfr) for selected analytes on the Olympus AU640 biochemistry analyzer.
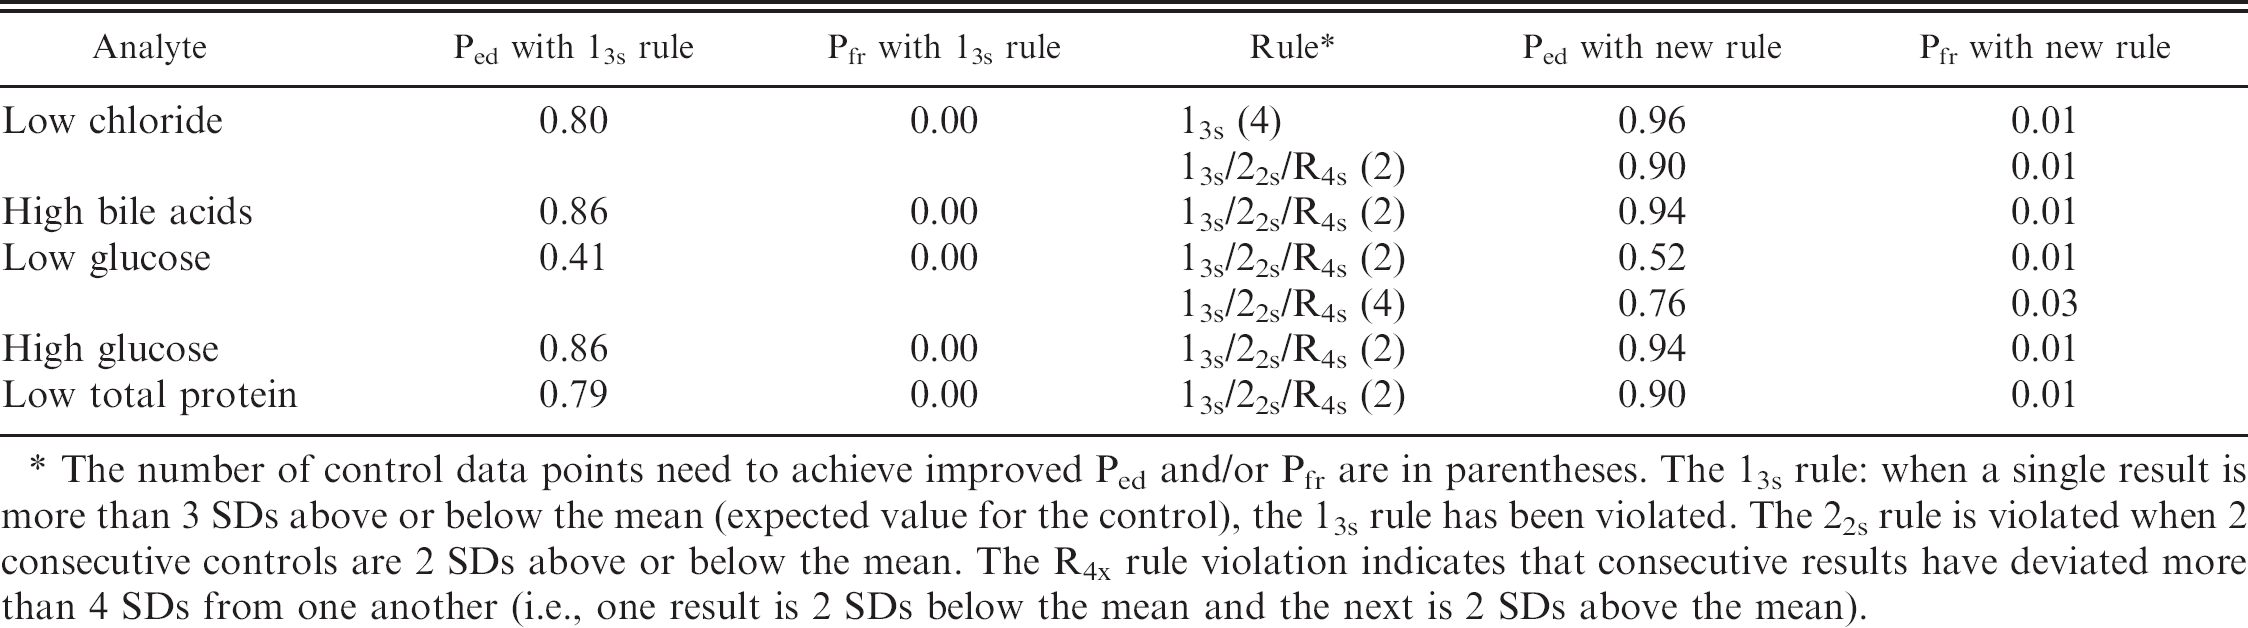
The number of control data points need to achieve improved Ped and/or Pfr are in parentheses. The 13s rule: when a single result is more than 3 SDs above or below the mean (expected value for the control), the 13s rule has been violated. The 22s rule is violated when 2 consecutive controls are 2 SDs above or below the mean. The R4x rule violation indicates that consecutive results have deviated more than 4 SDs from one another (i.e., one result is 2 SDs below the mean and the next is 2 SDs above the mean).
Summary of the control rule and number of data points required to achieve an improved probability of error detection (Ped) and probability of false rejection (Pfr) for selected analytes on the Olympus AU2700 biochemistry analyzer.*
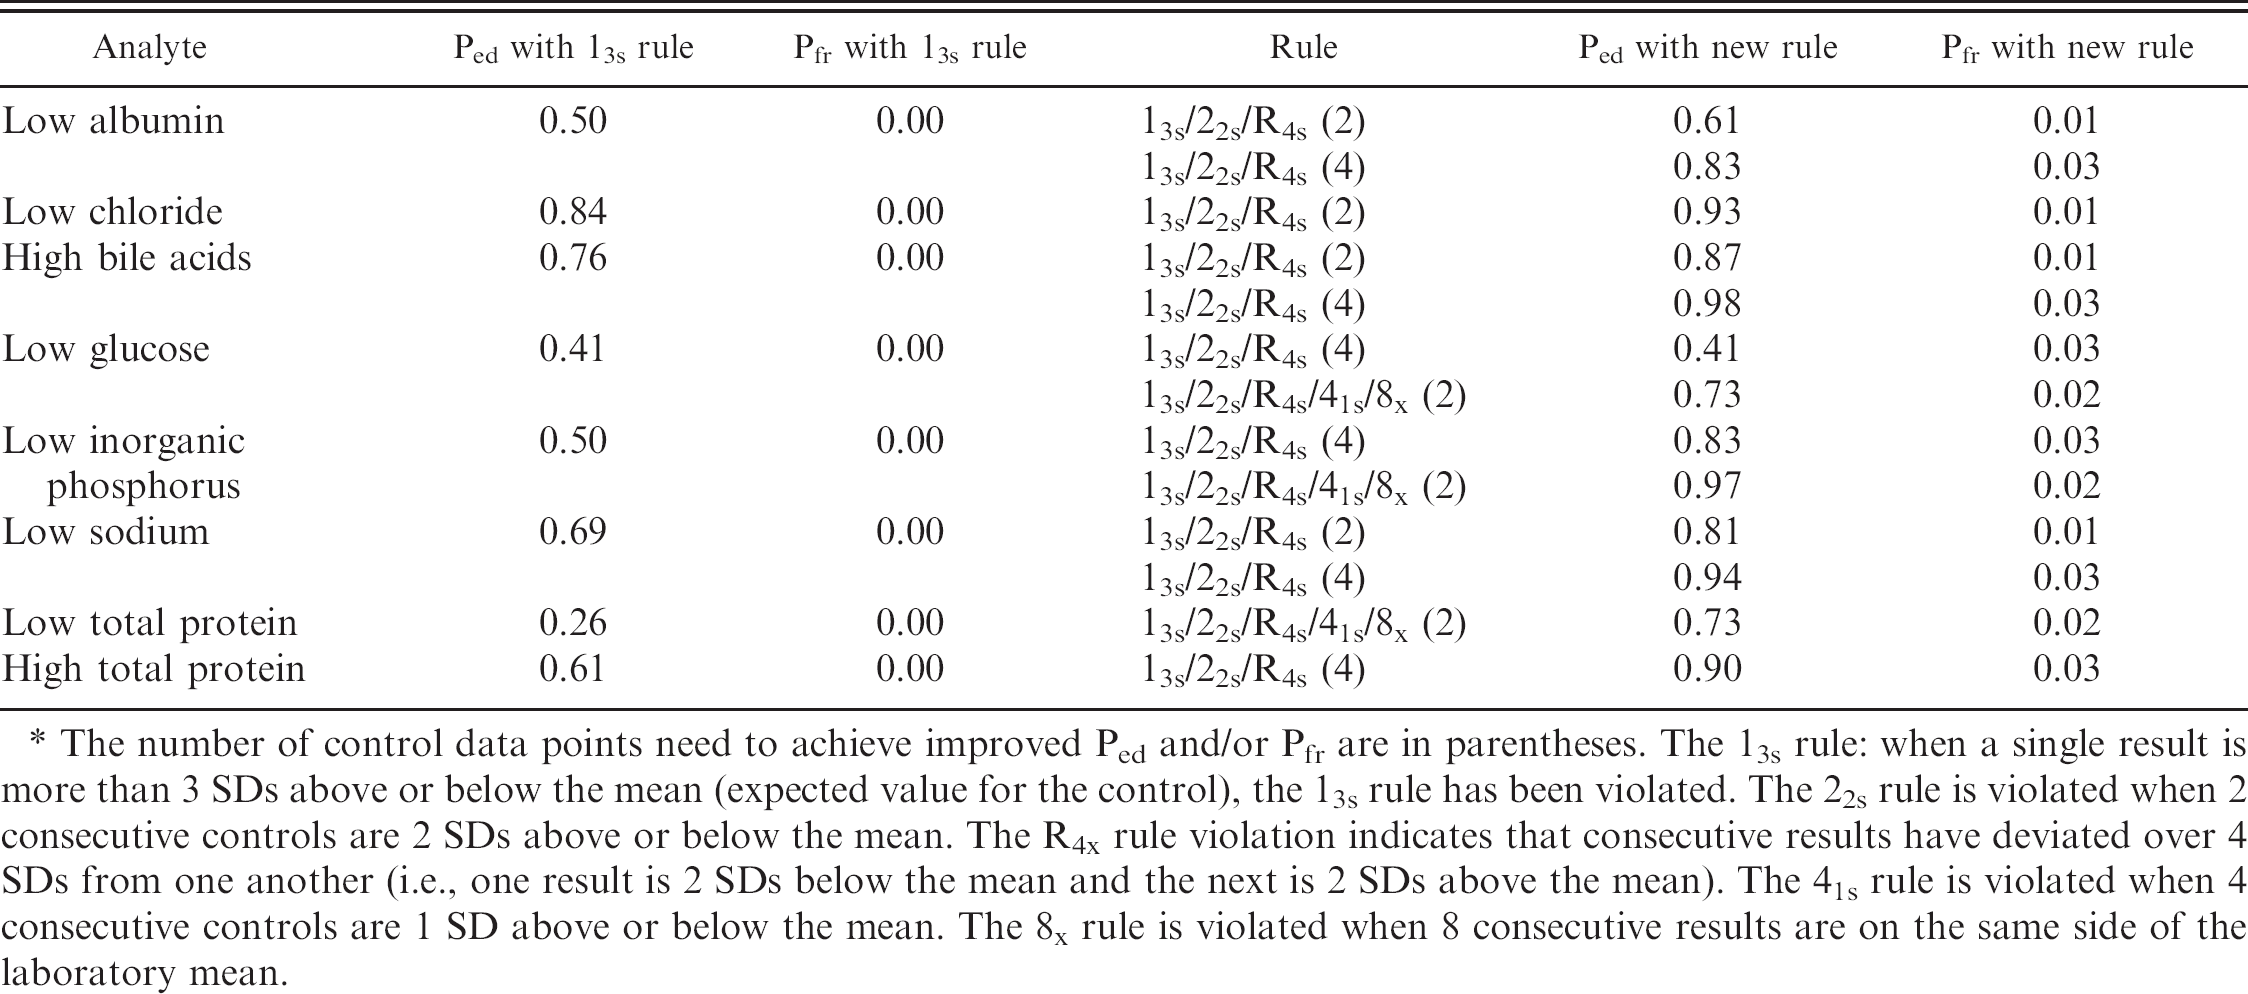
The number of control data points need to achieve improved Ped and/or Pfr are in parentheses. The 13s rule: when a single result is more than 3 SDs above or below the mean (expected value for the control), the 13s rule has been violated. The 22s rule is violated when 2 consecutive controls are 2 SDs above or below the mean. The R4x rule violation indicates that consecutive results have deviated over 4 SDs from one another (i.e., one result is 2 SDs below the mean and the next is 2 SDs above the mean). The 41s rule is violated when 4 consecutive controls are 1 SD above or below the mean. The 8x rule is violated when 8 consecutive results are on the same side of the laboratory mean.
When an analyte is identified as being poorly controlled, the following mitigating steps may be taken.
Limit the assay to the machine on which the statistical control is easier: This option is impractical in the authors' laboratory
Repeat low phosphorus results from the AU2700 on the AU640 machine: This option is also not practical in the authors' laboratory based on a need for rapid turnaround times for biochemistry assays and high volume batch analyses.
Consider the limitations of the assay when providing an interpretation for the result: This option is the most practical for the authors' laboratory. This option and the need for vigilance in interpretation would not have been identified had the study of analyzer performance not been undertaken.
For those analytes highlighted in Tables 3 and 4 (desired Pfr and Ped not achievable), additional nonstatistical QC may be of benefit in increasing confidence in the accuracy of results. Examples of nonstatistical QC include the following:
Correlation with clinical signs that may lead to performing a repeat test if not consistent with the results produced.
Correlation with other analytes that provide support for the result. For example, where a single electrolyte abnormality is detected, additional data such as other electrolytes, albumin, and calculation of an anion gap may provide further evidence regarding the disease process.
Performance of additional diagnostic tests to confirm the result. For example, in an apparently hypercalcemic patient, further tests could include parathyroid hormone (PTH), PTH-related protein, ionized calcium, and diagnostic imaging.
Further characterization of performance using QC materials or reference materials with values closer to levels of clinical significance than the current control materials may also be helpful. Custom-designed control materials can be obtained that are closer to the clinical decision levels of interest are available from some sources. b
The findings in the current study helped to illustrate a need for separate QC validation on every instrument; a need for QC that is specific for the analyte and the clinical decision level; and variation in performance of individual instruments despite uniformity of manufacturer, reagents, preventative maintenance, and age of the instrument. Additional benefits included raising the clinical pathologists' awareness of the actual performance capability of the biochemistry analyzers and level at which statistical QC can detect a change in instrument performance, raising awareness of the difference between the performances of the 2 machines, and increasing confidence in statistical QC.
Acknowledgements
The authors wish to thank Mr. L. Roberts, Mrs. S. Boylan, and Mr. D. Fox of IDEXX Laboratories, Wetherby, UK for their input in this study.
Footnotes
a.
Olympus AU640 and AU2700 clinical chemistry analyzers, Olympus America, Center Valley, PA.
b.
Randox Laboratories Ltd., Crumlin, County Antrim, Northern Ireland.
c.
Technopath, Plassey, Limerick, Ireland.
d.
EZ Rules statistics package version 3, Westgard QC, Madison, WI.