
Abstract
Normative data for plasma chemistry values in pregnant and non-pregnant reproductive age ewes are scant. Availability of data would aid monitoring of ewe health for both research and veterinary medicine. We determined specific plasma chemistry 95% confidence reference intervals (RIs) in non-pregnant and pregnant ewes. Mixed Western-breed ewes were grouped based on phase of ovarian cycle: luteal (n = 15), follicular (n = 17), or late-gestation pregnant (n = 102). Plasma samples were collected for analysis on a commercial biochemical analyzer. For RIs, chemistry panels for the 3 groups of ewes included nutrients and metabolites (glucose, triglycerides, cholesterol, urea, creatinine, total protein, albumin, and bilirubin), enzymes (lactate dehydrogenase, aspartate transaminase, gamma-glutamyl transferase, alanine aminotransferase, and alkaline phosphatase [ALP]), and micronutrients (calcium, phosphorus, iron, sodium, potassium, and chloride). Sample chemistry values for glucose and total protein in pregnant ewes were lower than in follicular ewes; cholesterol was lower in pregnant and luteal ewes than in follicular ewes. In addition, total bilirubin in pregnant ewes differed from that in luteal ewes, and that in follicular ewes also differed from luteal ewes. ALP in pregnant ewes was higher than other groups; phosphorus in pregnant ewes was lower than in luteal ewes. Iron was higher in pregnant ewes than in luteal ewes, with iron in luteal ewes lower than in follicular ewes. These data provide clinical RIs comparing pregnant and non-pregnant ewes for use in monitoring ewe health in both human research and veterinary medicine.
Introduction
The study of maternal–fetal physiology during pregnancy is crucial to understanding fetal development and adaptations that may lead to adult disease. 6 Providing normative data for determination of ewe health and for comparison to fetal values would be important to veterinarians and to researchers of human diseases of pregnancy. Only a limited number of high-quality reference interval (RI) values for plasma chemistry in ewes from North American temperate climates have been reported. 22 RIs for some parameters were found for ewes in arid and warm Middle Eastern and African climates3,4,21,23 but these values can vary by dehydration. 18 A limited number of studies of ewes reared in a Mediterranean climate compared RIs in ewes by pregnancy17,19 or by pregnancy and age. 5 Generally, RIs for plasma chemistry values reported for pregnant late-gestation ewes in more temperate climates were based on small numbers of animals (e.g., 5 ewes 11 or 10 ewes 17 ). Only one large study determined RIs for 15 serum chemistry tests in a large number of late or mid-gestation ewes from North America, 9 but included no non-pregnant comparisons. Easily accessible RIs for plasma chemistry values in sheep were not specific to ewes, such as the Merck Veterinary Manual Serum Biochemical Reference Ranges Appendix, 2 or if specific to ewes of reproductive age, no pregnancy-specific comparison values were reported. 12 This gap in normative plasma chemistry data comparing non-pregnant and pregnant ewes necessitates extrapolating patterns of change from other ruminant species.2,13 Using a commercial analyzer (Cobas Integra 800, Roche Pharmaceuticals, Basel, Switzerland), we determined plasma chemistry RIs during a precisely regulated ovarian cycle for non-pregnant 10 and pregnant ewes.
Materials and methods
The University of Wisconsin–Madison (UW) Research Animal Care and Use Committee of the School of Medicine and Public Health and the College of Agriculture and Life Sciences approved the protocols. Wisconsin has a North American temperate climate. Healthy ewes of mixed white-faced Western breeds (n = 134), previously selected for the Polypay and Booroola genes, were obtained from the UW closed-flock sheep facility. Studies were performed between 2008 and 2014.
The animals were group-housed, provided ample water, and fed a mixture of high-quality hay and corn silage that met daily National Research Council requirements for pregnant sheep. Ewes were monitored closely by trained research staff in the agricultural setting at UW Arlington Farm and were examined by veterinarians immediately before, as well as immediately after, transfer to the research facility. The staff assessed the ewes as healthy, none of which were over-conditioned or obese. Trained personnel checked the animals at least twice daily for signs of illness including pregnancy toxemia, with a veterinary check several times per week. Late-gestation pregnant ewes were never without feed longer than 4 h.
The ewes were classified into 3 groups: follicular phase (non-pregnant), luteal phase (non-pregnant), and pregnant. Categorization was as follows. Follicular was 0–2 d into the cycle (n = 17); luteal was 10–12 d into the cycle (n = 15); and third-trimester pregnant was gestational day (GD) ≥100, term = 147 d (n = 102). The ewes underwent close synchronization and timing of the luteal and follicular phases as per standard agriculture procedures that we validated previously in a research setting. 10 To accurately determine phase or gestational age, 10 this synchronization protocol was performed using an intravaginal controlled internal drug release (Progesterone CIDR, 0.3 g, Pfizer, Auckland, New Zealand) for 10–14 d, followed by intramuscular prostaglandin F2α (15 mg, Pfizer) and equine chorionic gonadotropin (500 IU, EMD Biosciences, San Diego, CA) injections before breeding.15,25 Pregnancy was confirmed using ultrasound by GD 60. Ewes experienced no surgical manipulations, chronic infusions, or experimental interventions, with the exception of a subset of the pregnant ewes that underwent procedures at least 2 mo prior to pregnancy (unilateral tubal ligation, n = 14; unilateral uterine horn ligation, n = 10).
After iodine preparation, all blood collection, occurring immediately before euthanasia, was from the jugular vein after a jugular injection of pentobarbital (50–70 mg/kg). Up to 40 mL of blood total was collected, with 5 mL collected in a lithium heparin Vacutainer tube (Becton, Dickinson, Franklin Lakes, NJ) for plasma chemistry. Blood tubes were immediately placed on ice; plasma was not frozen before assaying. Euthanasia was then performed after an additional pentobarbital dose and either bilateral pneumothoraces with cardiac laceration or by lethal intracardiac injection of saturated KCl.
Within 30 min of collection, lithium heparinized blood was centrifuged for 10 min at 3,600 × g at 4°C and decanted for plasma chemistry. Plasma was sent to the Clinical Chemistry Laboratory at UnityPoint Health Meriter Laboratories (Madison, WI) to perform a comprehensive metabolic panel within 5 h of collection using a commercial biochemical analyzer (Cobas Integra 800, Roche). Anticoagulation by lithium heparin was recommended by the laboratory for clinical chemistry testing. The first category of plasma chemistry panels assessed was nutrients and metabolites, which included glucose by hexokinase (mmol/L), triglycerides by glycerin-3-phosphatoxidase–phenol aminophenazone (mmol/L), cholesterol by cholesterol oxidase–phenol aminophenazone (mmol/L), urea by urease–glutamate dehydrogenase (mmol/L), creatinine by Jaffe (µmol/L), total protein by biuret (g/L), albumin by bromocresol green (g/L), and bilirubin by 2,5-dichlorophenyldiazonium (µmol/L). The second category was panel enzyme activities, all performed by ultraviolet (UV) analysis by International Federation of Clinical Chemistry methodology, including lactate dehydrogenase (LDH; µkat/L), aspartate transaminase (AST; µkat/L), alanine transaminase (ALT; µkat/L), gamma-glutamyl transferase (GGT; µkat/L), and alkaline phosphatase (ALP; µkat/L). The final category included the micronutrients calcium by Schwarzenbach o-cresolphthalein (mmol/L), phosphorus by UV molybdate (mmol/L), and iron by ferrozine (µmol/L). Electrolytes sodium (mmol/L), potassium (mmol/L), and chloride (mmol/L) were evaluated by ion-selective electrode analysis.
Data for each of the clinical tests were examined for normality of distribution, and most were appropriately categorized as nonparametric. Detailed analysis was performed on venous samples only. Differences in the 95% RIs were analyzed by year of assay performance between 2008 and 2014. The data were then categorized by luteal, follicular, and late pregnancy stages. The 95th percentile RIs around the 2.5th percentile and 97.5th percentile for each parameter were established from the distribution of RIs using a nonparametric bootstrap approach in accordance with current guidelines using STATA 14.2 (STATA Corp, College Station, TX) where n > 20. For groups with <20 animals, the mean, minimum, maximum, and median values were calculated. Prior to generating the RIs, histograms of the chemistry values were created to examine for outliers.
Sample size determination was not performed. These cohorts included available sample data without sample size determination. If not normally distributed, log-conversion normalized the distribution. Significance testing included paired t test, unpaired t test, and one-way ANOVA with Fisher post hoc. All t tests performed were 2-tailed. Significance is set at p <0.05, except p < 0.015 for ANOVA.
Results
Ewe age was known for nearly all ewes (range: 1.7–11.0 y). Mean age was 5.6 y for follicular, 5.6 y for luteal, and 4.3 y for pregnant ewes. The mean GD of pregnancy was 126 d. All values were assayed within 5 h of collection. No difference in RIs was appreciated when analyzed by year of assay performance between 2008 and 2014, with the exception of plasma glucose values, which were slightly higher in samples collected in 2008.
Examining for relationships between plasma chemistry values and age by pregnant versus not pregnant in bivariate analysis, we found few relationships. There was an inverse relationship between glucose and age found in non-pregnant ewes (p < 0.0005), but no independent effect of age was supported by multivariate analysis. A direct relationship was found between cholesterol and age in non-pregnant ewes (p < 0.04), but no independent effect was found by multivariate analysis. However, in non-pregnant animals, an independent impact of age was found in both calcium and iron; both calcium and iron were inversely related to ewe age in non-pregnant animals (p < 0.001 for both). In multivariate analysis, both pregnancy (yes/no) and age independently impacted calcium and iron (p < 0.004 for both), and in addition there was an interactive effect between age and pregnancy (yes/no) status (p < 0.006).
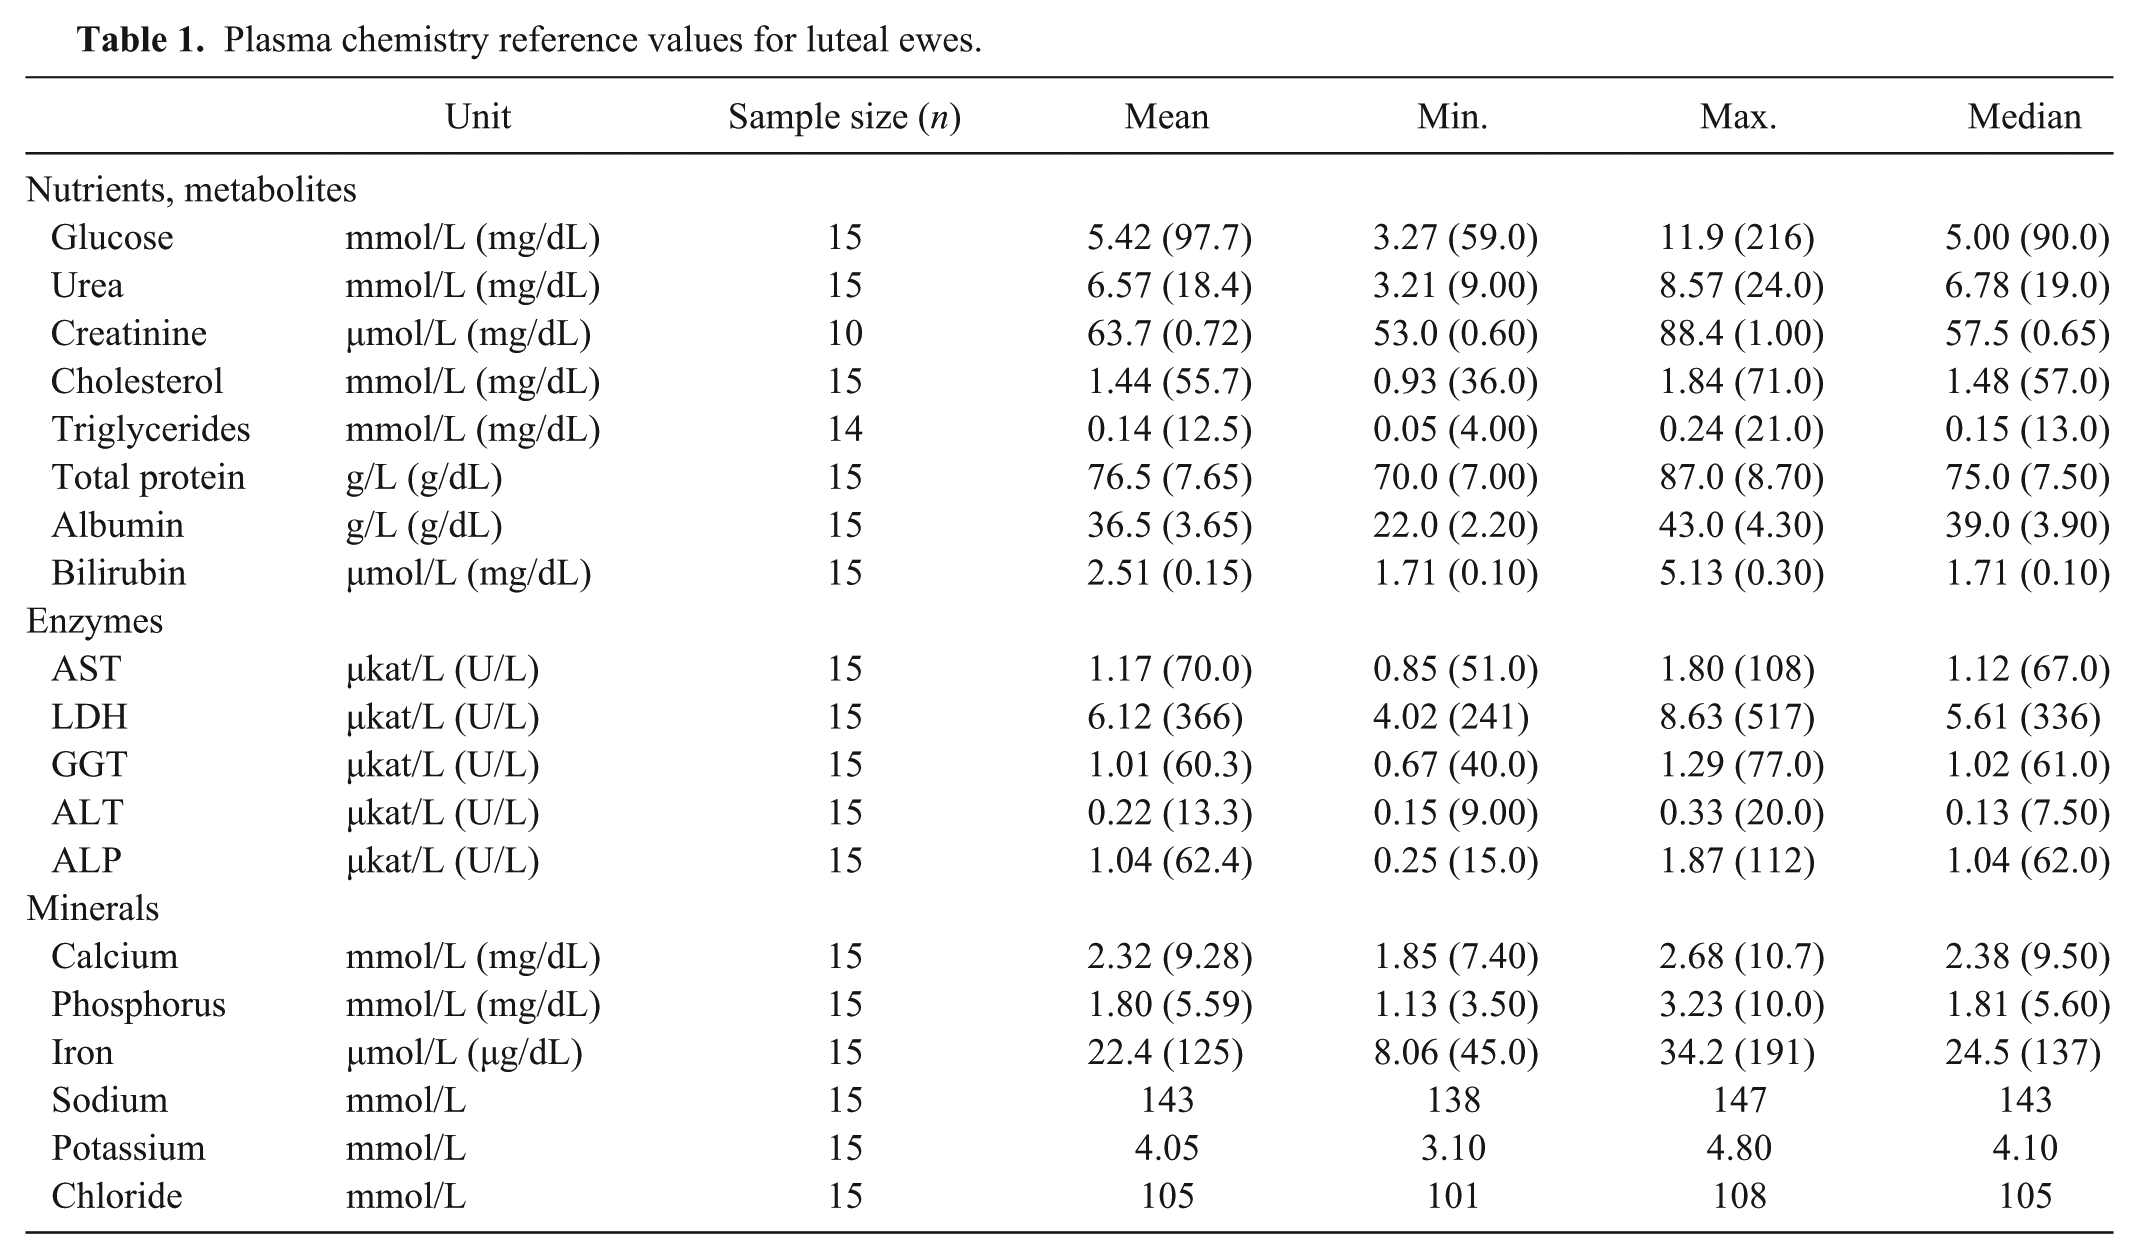
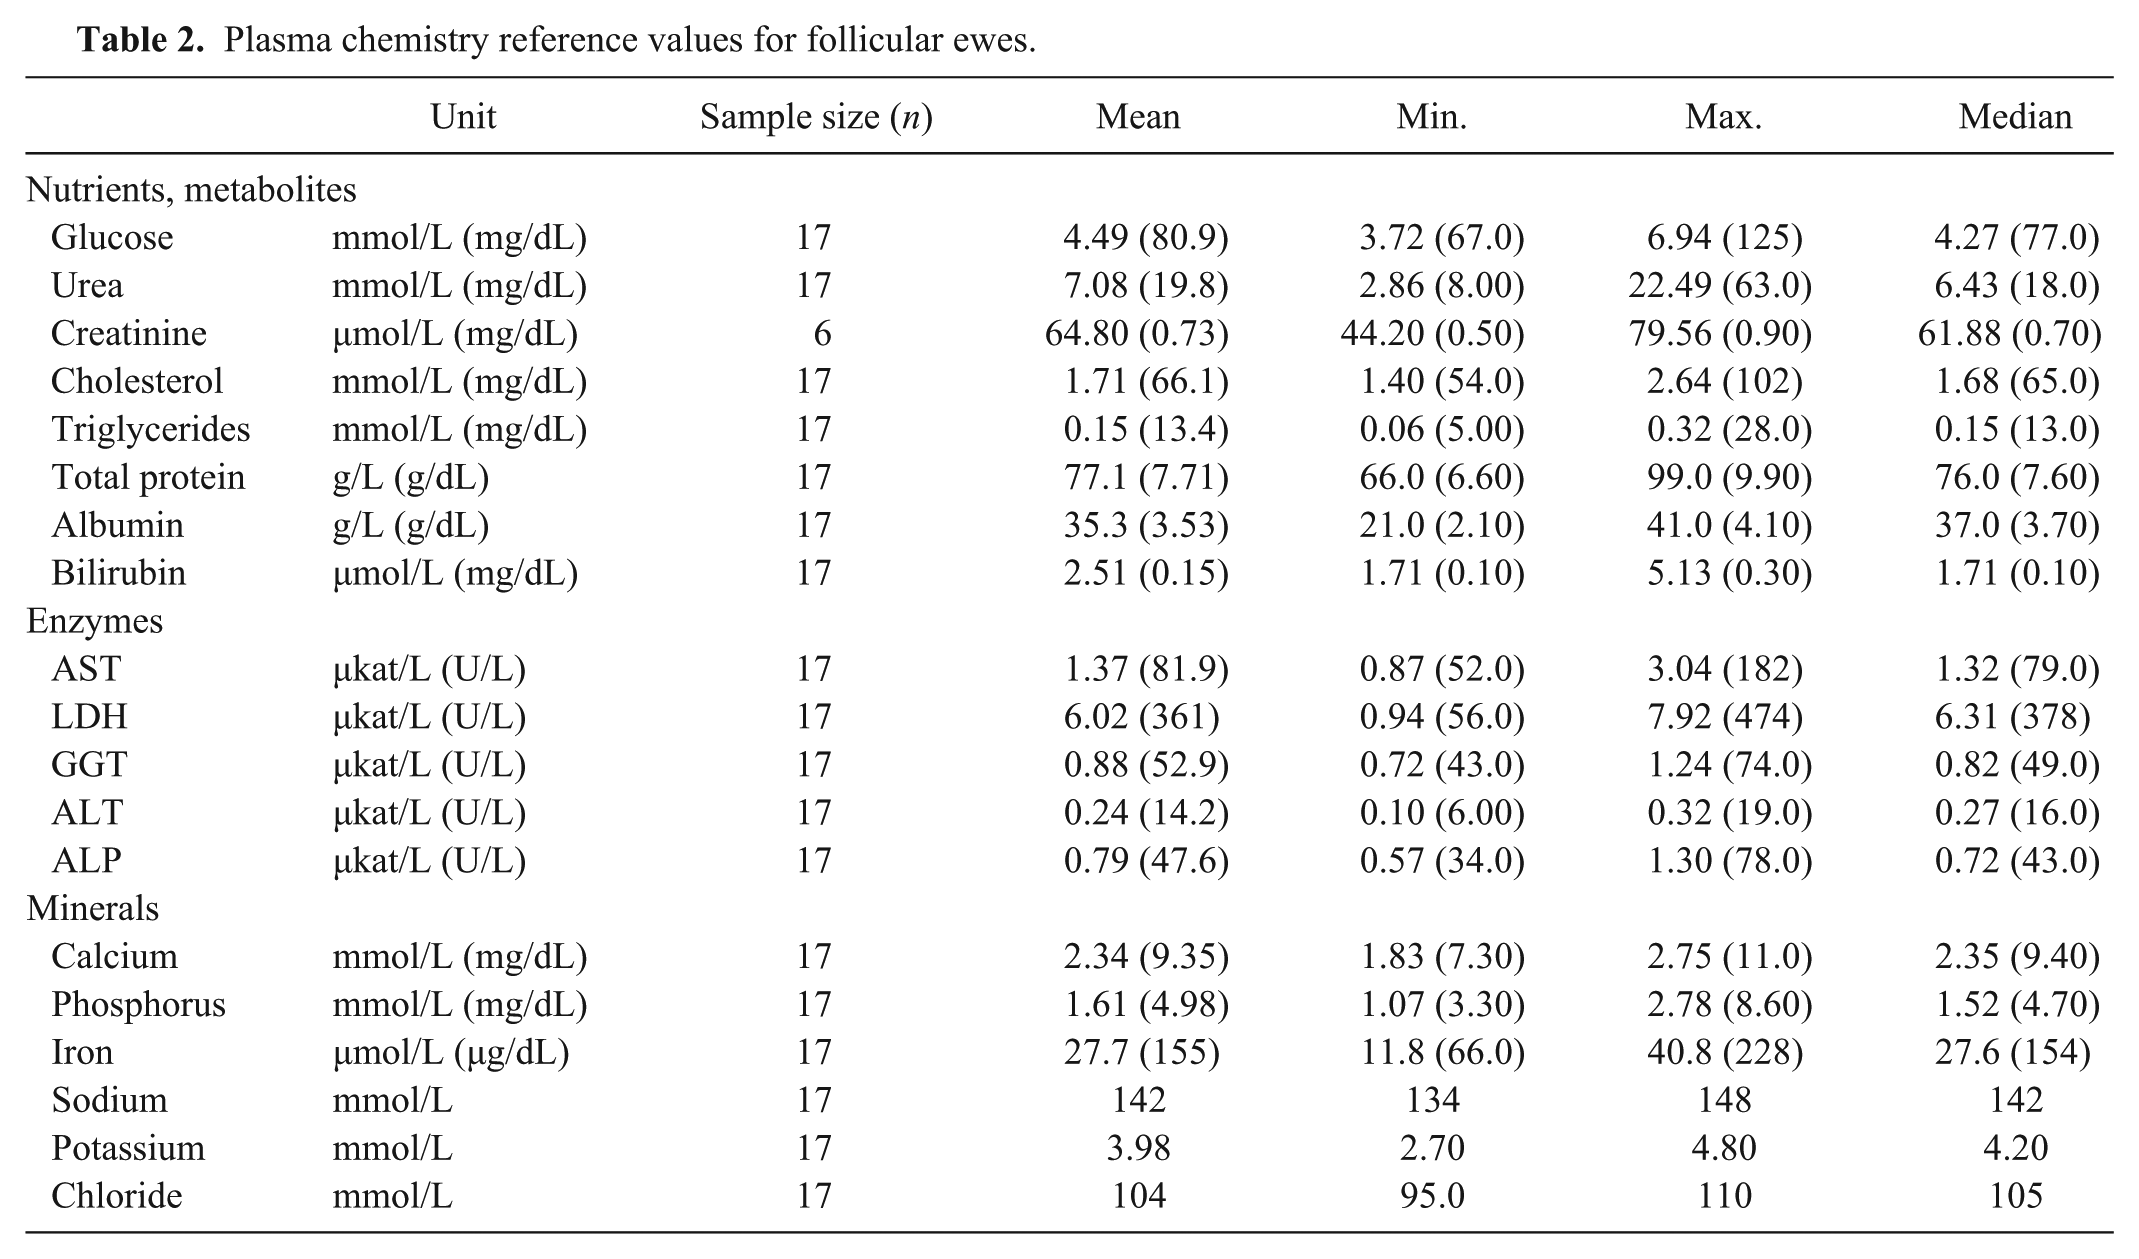
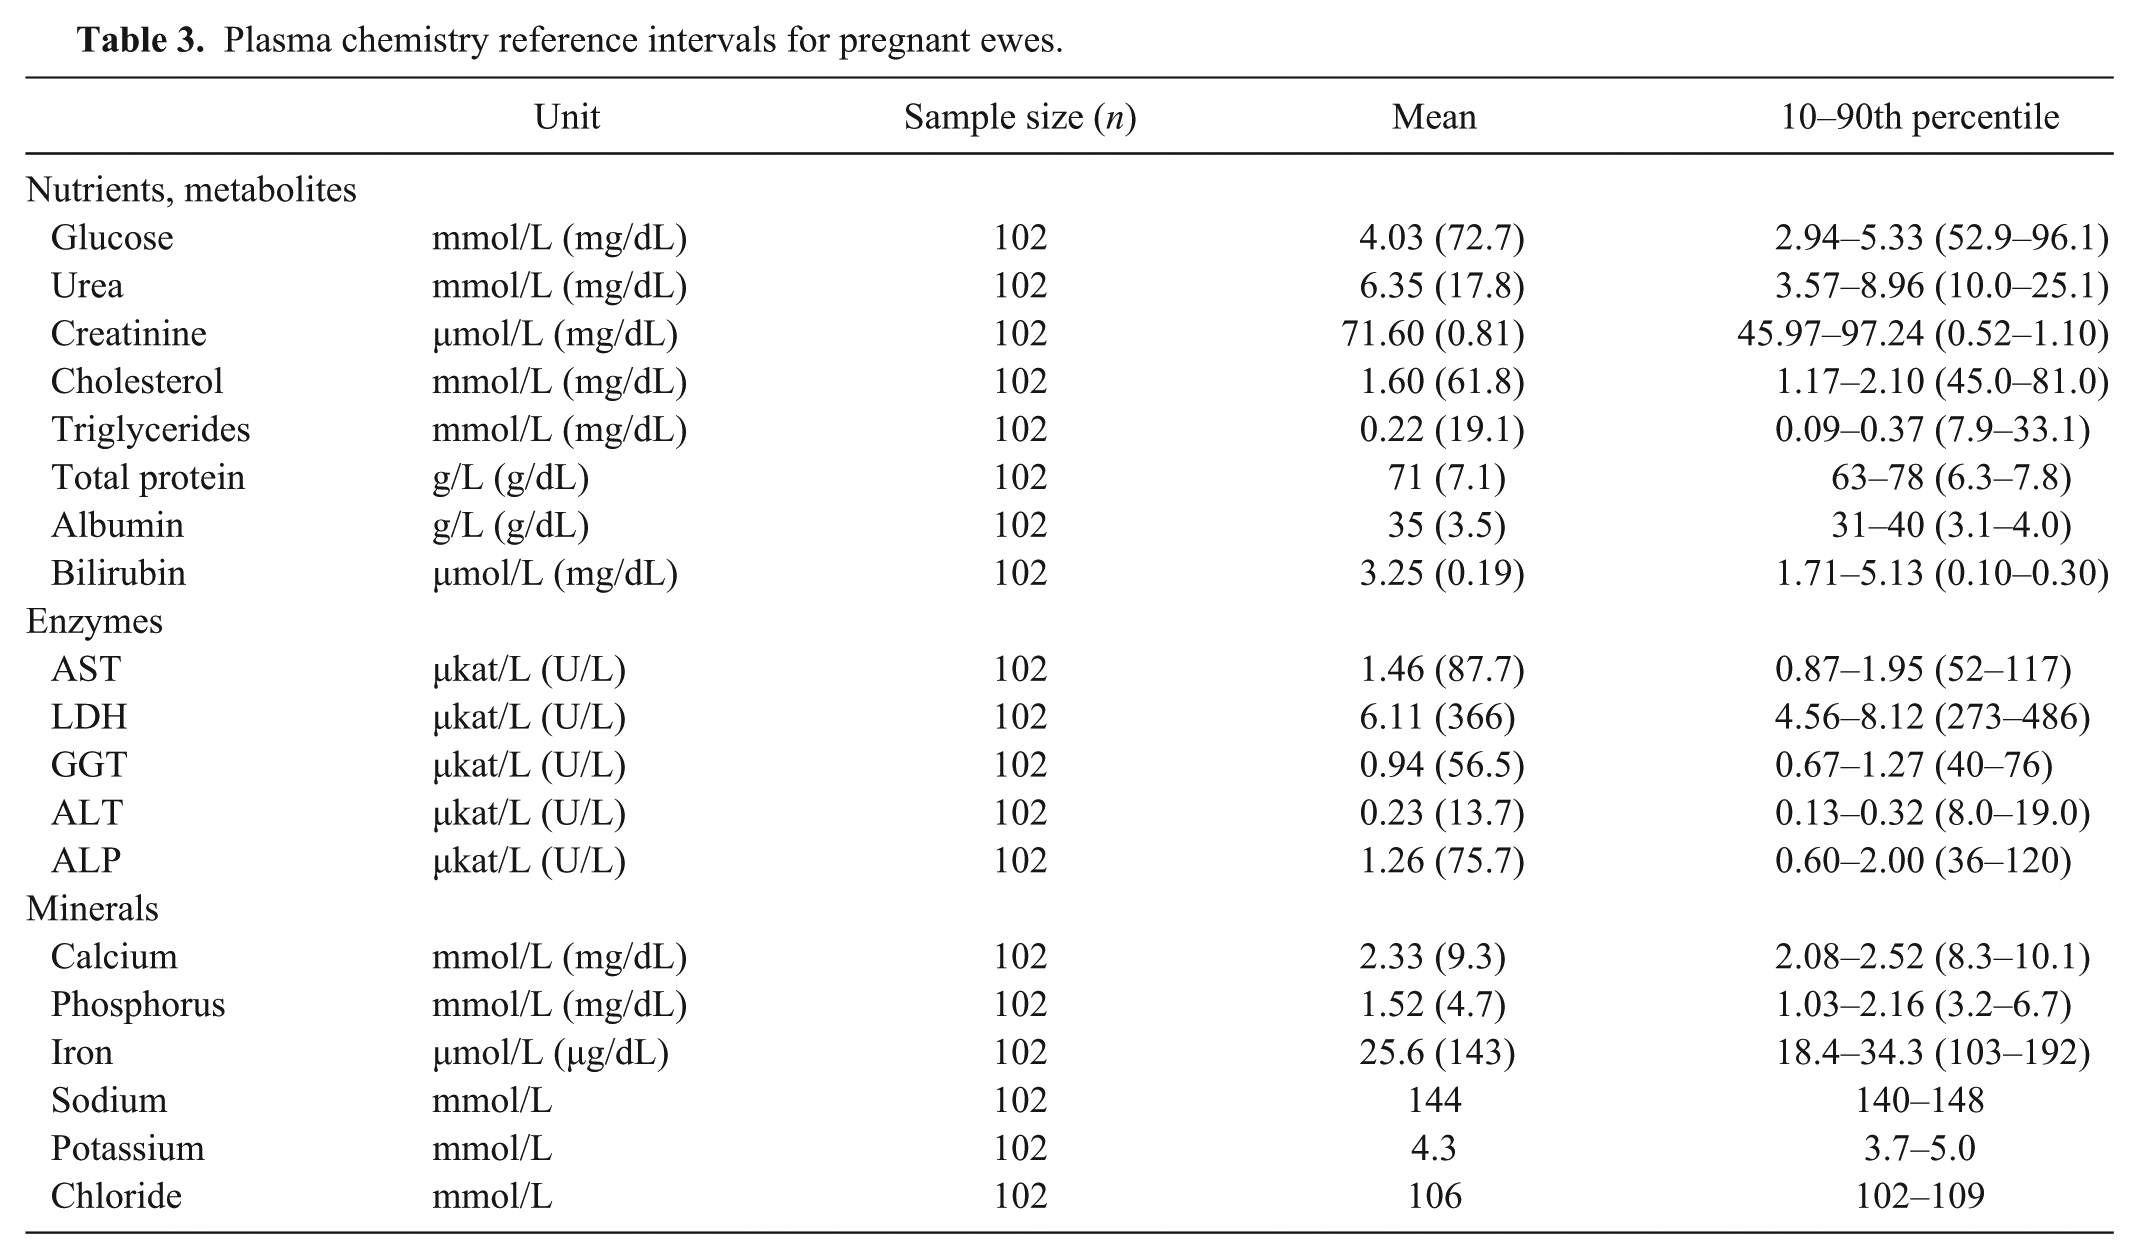
The tables show plasma values for venous samples from luteal ewes (Table 1), follicular ewes (Table 2), and pregnant ewes (Table 3). Mean plasma glucose was lower in the pregnant ewes than the luteal ewes; mean glucose was higher in luteal ewes than in follicular ewes (p < 0.05). Mean plasma cholesterol was lower in luteal and pregnant ewes than the follicular group (p < 0.05). Mean plasma total protein was lower in the pregnant ewes than the follicular group (p < 0.05). Mean plasma bilirubin was lower in follicular ewes, whereas mean bilirubin was higher in pregnant ewes, compared to luteal ewes (p < 0.05). No appreciable patterns were observable in plasma enzyme activities, with the exception of mean plasma ALP, which was higher in the pregnant ewes compared to the other groups (p < 0.05). Mean plasma phosphorus was lower in the pregnant than the luteal ewes (p < 0.05). Mean plasma iron level was lower in the luteal than the follicular ewes, as well as mean plasma iron levels, which were lower in the luteal than the pregnant ewes (p < 0.05).
Plasma chemistry reference values for luteal ewes.
Plasma chemistry reference values for follicular ewes.
Plasma chemistry reference intervals for pregnant ewes.
Discussion
The strengths of our data included the number of animals and known health of the ewes. The values generated in our study are limited by the use of a clinical laboratory biochemical analyzer validated in humans, but not validated in sheep. Therefore, values presented herein are specific to a specific commercial analyzer (Cobas Integra 800, Roche) and the reagents and assays described in the methods as analyzed by the Clinical Chemistry Laboratory at UnityPoint Meriter Health.
From our data, lower plasma glucose levels in pregnant ewes compared to non-pregnant sheep can be attributed to the increased fetal demand and facilitated diffusion of glucose through the placenta during pregnancy. 7 This finding was supported by a previous study, 19 but contrasts with a small study that reported higher glucose in late-gestation pregnant ewes, compared to early-gestation ewes. 11 Although animals with low glucoses in our study were not older, a study comparing reproductive and age effects found that lower glucose was predominantly an age effect in ewes. 5 A reason for our finding could be a larger number of pregnant ewes in our dataset or that ewes from the UW flock were selected for genes that promote multifetal gestation, and most of the pregnancies were twin or higher-order gestation pregnancies with greater fetal demand for glucose. 14
Although plasma triglyceride values did not differ between groups, triglycerides tended higher in the current study and previously were reported to be higher during human pregnancy. 1 However, in contrast, triglycerides were previously reported lower in late-gestation, compared to early-gestation, ewes.11,17 It is well known that plasma cholesterol metabolism differs between pregnant and non-pregnant sheep and that pathways in ewes differ from those in humans. During ovine gestation, cholesterol is a substrate for steroids, first the corpus luteum and then placenta. Unlike women, the ovine placenta has no HMG-CoA reductase and relies solely on cholesterol for progesterone production. In our study, cholesterol was lower in pregnant than in follicular ewes, but levels were previously reported to be relatively higher in human pregnancies 1 and in pregnant ewes from much warmer climates.16,19 Lower total protein in the pregnant ewes could be partially explained by normal pregnancy-induced hemodilution, a finding reported in human pregnancies 1 and also found in a small group of ewes sampled serially, 17 but not otherwise reported in ewes.5,19 Urea and creatinine did not differ and were not previously shown to differ in human pregnancies compared to non-pregnant women. 1 However, urea and creatinine were all reported to be higher in a small number of late-gestation, compared to early-gestation, ewes,11,17 or in serial sampling of a small number of ewes. 17 Our finding of higher plasma bilirubin in pregnant ewes was not previously reported in humans 1 or previously appreciated in ewes. 19
Most plasma enzyme activities did not differ by ewe ovarian cycle or by pregnancy. Finding higher plasma ALP levels during the third-trimester pregnant ewes was anticipated, and was previously seen in late- compared to early-gestation ewes, 11 and shown to rise during gestation in ewes. 5 A rise in plasma ALP has been reported and is likely for provision of calcium for fetal growth in the third trimester of human pregnancy. 1 Differences in other plasma enzymes were not found in our study and were not previously found in human pregnancies. 1 In contrast to our findings, plasma AST values were previously reported to be slightly lower in a small number of late- compared to early-gestation ewes,11,19 or did not differ or were slightly higher in response to pregnancy.5,11 In our cohort, although assayed within hours of collection, AST and ALT values were already very low, limiting the ability to discern differences based on ovarian cycle or pregnancy, or our findings differed from previous reports because of variability in laboratory methodologies utilized. 12
Most micronutrient values did not differ by ovarian cycle. Supporting our data, plasma calcium, phosphorus, and electrolytes in pregnant women did not differ from non-pregnant women, 1 although potassium was higher in pregnancy as part of an interaction between pregnancy and age. 5 It is unclear why plasma phosphorus levels were lower in the pregnant compared to luteal ewes, because this was not previously appreciated during gestation in ewes, 5 but levels in pregnant ewes were comparable to the follicular group. Plasma iron levels vary in a diurnal pattern, but our animals were studied in the morning and not fed 12 h prior to the sampling, so may be comparable to fasting morning human levels. Plasma iron levels were lowest in the luteal group, potentially as a result of acute iron utilization for hemoglobin, compared to the chronic iron utilization in pregnancy. 1
There is potential error given the limited sample size with biological variability between ewes, especially in the luteal and follicular ewes. However, ewes were seen by veterinary staff the day before transport to the research facility and were excluded with recognition of either acute or long-term medical problems. Data were collected on lithium heparinized plasma and values may vary slightly from serum values, including lower potassium and higher total protein, AST, and cholesterol, 8 although this anticoagulant was recommended by the laboratory.
A study limitation was that assays were performed in a clinical hospital laboratory, without species-specific controls. Samples were of high quality; samples with severe hemolysis or lipemia were not assayed. The numbers of follicular- and luteal-phase ewes were small, and conclusions could suffer from insufficient sample size. Potential sources of variability also included other experiments that were performed on these ewes, including collection of slightly more blood than for routine phlebotomy, but cumulative volume did not exceed 1.5% of the total blood volume. For research, barbiturate anesthesia was used before blood was sampled, and barbiturates may cause immediate vasoconstriction, followed by vasodilation at time of sampling, potentially lowering electrolyte concentrations.
Ewes did have close synchronization, which controlled the follicular and luteal phases, 10 as well as close dating of gestation, which created a consistent population. Other advantages of a research flock included close monitoring by trained research staff and veterinarians. No behavioral changes or physical signs of toxemia were appreciated. Good maternal–fetal health was supported by ewe and fetal blood gasses, as well as other laboratory assays and complete fetal tissue harvest (data not shown).14,15,20,25 All ewes and fetuses were in good nutritional status, fed high-quality hay and adequate water, with neither over-conditioning, nor obesity, and had minimal risk for toxemia. In the closed flock with 300 lambings annually, clinical pregnancy toxemia occurs less than once per year. Plasma ketones were not measured, and we were thus unable to compare plasma glucose in relation to ketosis.
Only a few large studies have directly compared late-gestation pregnant and non-pregnant ruminants in breeding season. In a small study of unbred and late-gestation pregnant cattle, serum calcium, phosphorus, sodium, potassium, and chloride in late-gestation pregnant cattle did not appear to differ from unbred cattle, but iron tended to be lower in late-gestation than unbred cattle. 24 In addition, serum values of urea, creatinine, cholesterol, total protein, and albumin in pregnant cattle did not appear to differ from unbred cattle. 24 In addition, serum enzymes AST, ALT, and LDH in pregnant cattle did not appear to differ from unbred cattle, but ALP tended to be higher in pregnant cattle than in unbred cattle. 24 Comparing published values 24 in late-gestation cattle to late-gestation sheep in our study, we found that creatinine and total protein did not appear to differ, whereas urea, cholesterol, and albumin appeared lower in late-gestation sheep than late-gestation cattle. In addition, enzymes ALT and LDH did not appear to differ, but AST appeared higher and ALP appeared lower in late-gestation sheep than late-gestation cattle. 24 Calcium, phosphorus, iron, potassium, and chloride in late-gestation sheep did not appear to differ from late-gestation cattle; sodium appeared higher in late-gestation sheep compared to late-gestation cattle. 24 However, true comparisons are difficult when methods and demographics of the reference population differ.
From a large database, these RI normative data for ewes of reproductive age and during pregnancy have utility for understanding ewe health and for modeling of human maternal–fetal physiology. Our research provides key reference values of nutrients and metabolites, enzymes, and micronutrients.
Footnotes
Acknowledgements
We thank Kling & Magness Laboratories: Bryan C. Ampey, Jason L. Austin, Natalie C. Dosch, James Gannon, Jason M. Habeck, Sheik Omar Jobe, Jill M. Koch, Colin Korlesky, Gladys E. Lopez, Steven J. Marmer, Timothy J. Morschauser, Terrance M. Phernetton, Mayra B. Pastore, Mary Y. Sun, Katie Meyer-Gesch, Jayanth Ramadoss, Zachary Smith, Vladimir E. Vargas, Rosalina Villalon-Landeros, and Hannah R. Zundel. Thank you also to Meghan Hessler and Kristen R. Friedrichs.
Declaration of conflicting interests
The authors declared no potential conflicts of interest with respect to the research, authorship, and/or publication of this article.
Funding
Hilldale Undergraduate/Faculty Research Fellowship (MM Zywicki), UW Department of Pediatrics (PJ Kling), Meriter Foundation (PJ Kling), NIH HL087144 Supplement (PJ Kling), NIH HL079020 (RR Magness, PJ Kling), and PO1 HD38843 (RR Magness), provided financial support.