
Abstract
Antimicrobial resistance is a serious threat to animal and human health worldwide, requiring a collaborative, holistic approach. The U.S. Government has developed a national strategy to address antimicrobial resistance, with one component being to monitor antimicrobial resistance in agricultural settings. We developed a survey to collect information about antimicrobial susceptibility testing (AST) from the veterinary diagnostic laboratory community in the United States, assessing current practices and technologies and determining how AST information is shared. Of the 132 surveys administered, 52 (39%) were returned. Overall, responding laboratories conducted susceptibility tests on 98,788 bacterial isolates in 2014, with Escherichia coli being the most common pathogen tested across all animal species. The 2 most common AST methods employed were the disk diffusion method (71%) and the Sensititre platform broth microdilution system (59%). Laboratories primarily used the Clinical Laboratory Standards Institute (CLSI) VET-01 standard (69%) and the automatically calculated interpretations provided by the commercial AST systems (61%) for interpreting their AST data. Only 22% of laboratories published AST data on a periodic basis, usually via annual reports published on the laboratory’s website or through peer-reviewed journals for specific pathogens. Our results confirm that disk diffusion and broth microdilution remain the standard AST methods employed by U.S. veterinary diagnostic laboratories, and that CLSI standards are commonly used for interpreting AST results. This information will help determine the most efficient standardized methodology for future surveillance. Furthermore, the current infrastructure within laboratories, once harmonized, will help provide a mechanism for conducting national surveillance programs.
Keywords
Introduction
Antimicrobial resistance (AMR) is currently a serious threat to the health of animals and humans worldwide. Controlling the development and spread of antimicrobial resistance is a top national security and public health priority. In September 2014, the President of the United States released a National Action Strategy for Combatting Antibiotic Resistant Bacteria (CARB). The resulting National Action Plan (https://goo.gl/QTifUx) calls for collaborative action by the U.S. Government, in partnership with the U.S. and global communities, to strengthen our resources to address this issue. The U.S. Department of Agriculture (USDA) also responded to this need by releasing a concurrent Action Plan in December 2014 (https://goo.gl/J3fGhh), aligned with the President’s CARB Plan. Both of these plans identify the need for a collaborative approach by human, veterinary, and environmental sectors to address this issue holistically. A main objective of both plans is to develop strategies for monitoring antimicrobial drug susceptibilities of bacteria collected from a variety of agricultural settings, including using antimicrobial susceptibility testing (AST) data generated by State and private veterinary clinics, diagnostic laboratories, and teaching hospitals.
To prospectively monitor antimicrobial resistance in pathogens affecting both humans and animals, the National Antimicrobial Resistance Monitoring System (NARMS) was established in 1996 by the Food and Drug Administration Center for Veterinary Medicine (FDA-CVM) in collaboration with the Centers for Disease Control and Prevention (CDC) and USDA. This surveillance program has expanded to monitor trends in antimicrobial resistance among foodborne bacteria recovered from food-producing animals at slaughter, retail meat products, and human diagnostic specimens. One strength of this program has been, and continues to be, the standardized testing protocols and interpretations of the findings. In 2003, the USDA Agricultural Research Service (ARS), in collaboration with the CDC and the FDA, established VetNet as an adjunct tool for NARMS animal isolate surveillance samples to subtype isolates from slaughter and processing facilities submitted as part of NARMS. This program, modeled after CDC PulseNet Salmonella subtyping database, used subtyping data and antimicrobial susceptibility patterns from Salmonella and Campylobacter isolates collected at these facilities to help drive surveillance and investigations of foodborne illness outbreaks. 21 However, as of the writing of this manuscript, the VetNet program is no longer active. The USDA also conducts surveillance on antimicrobial resistance of bacterial isolates collected from animals and their environment on farms through the National Animal Health Monitoring System (https://goo.gl/HulVMe), with sampling conducted every 5–10 y, depending on the food animal species.
Although the NARMS program is effective for monitoring antimicrobial resistance of potential pathogens of both humans and agricultural animals, it is not designed to evaluate isolates from companion animals or from clinically ill animals in the agricultural sector. Nor is there a national monitoring program available to follow the development of antimicrobial resistance in pathogens associated with companion animals. Thus, there is a gap in knowledge regarding development and prevalence of antimicrobial resistance among isolates from these animal populations. The purpose of our survey was to assess current practices and technologies used by veterinary diagnostic laboratories in the United States to detect antimicrobial resistance in bacterial pathogens of veterinary significance, and to determine how information regarding antimicrobial resistance is shared with the veterinary and scientific community, human and animal health officials, and other interested parties.
Materials and methods
Laboratory selection
Laboratories or veterinary clinics that were part of one or more networks or were members of designated groups were eligible to participate in the survey effort. These networks and groups were USDA-APHIS National Animal Health Laboratory Network (NAHLN), FDA-CVM Veterinary Laboratory Investigation and Response Network (VetLIRN), laboratories accredited by the American Association of Veterinary Laboratory Diagnosticians (AAVLD), and laboratories or clinics represented by members of the AAVLD Bacteriology Committee.
Survey development and delivery
A survey (Supplementary Figure 1) was developed in collaboration with AAVLD veterinary diagnostic laboratories, the Clinical and Laboratory Standards Institute (CLSI), FDA-CVM VetLIRN, and USDA-APHIS Center for Epidemiology and Animal Health, National Veterinary Services Laboratories (NVSL), and NAHLN to collect various information related to AST. This included the methods and capacities to test bacterial isolates for susceptibility to antimicrobial agents commonly prescribed in veterinary medicine, the sources of bacterial isolates, how isolates were selected for testing, test methods available in the laboratory, selection of breakpoints to interpret the test results, and guidelines used for quality control. In addition, laboratories were asked to report on bacterial pathogens most commonly tested for antimicrobial susceptibility by source species. With regard to genotypic resistance determinants, laboratories were asked to report on the availability of molecular evaluation of isolates in their facilities. Finally, laboratories provided information on bacterial isolate archival practices, as well as data collection and storage and sharing of AST results.
The survey was distributed by AAVLD to the laboratories as an electronic fillable form via email on September 9, 2015. A return of the completed forms was requested by September 25, 2015. Completed forms were returned to AAVLD for aggregation.
Data analysis
Data from the electronic fillable forms were exported and converted to a dataset to be analyzed (SAS v.9.4., SAS Institute, Cary, NC). The data were validated by checking for outliers and indicators of internal validity. Descriptive analysis of the data used a variety of procedures within the SAS software package.
Results
Among the 132 veterinary diagnostic laboratories and clinics sent the survey tool, 52 (39%) laboratories located in 35 states throughout the United States returned the completed form. Of these 52 laboratories, 3 (6%) responded that they did not routinely perform AST on clinical isolates of animal origin.
For bacterial identification, 46 of 52 laboratories (88%) reported using conventional biochemical tube tests. Most also reported using commercially available strip tests (75%). Automated bacterial identification systems were used by 52% of the laboratories, with 44% of laboratories using matrix-assisted laser desorption/ionization time-of-flight mass spectrometry technology. Sequencing or other molecular-based methods were used for bacterial identification by 50% of the laboratories.
Nearly all (94%) of the responding laboratories performed AST on some bacterial isolates from clinical cases, with 51% performing AST as part of a research project and 47% conducting AST as part of a monitoring or surveillance program. The majority of laboratories (83%) reported performing AST when the submitter or clinician requested it, and over half (62%) performed AST on isolates identified as possible pathogens. One-third of the laboratories (33%) performed AST only on pathogens most likely to be responsible for the clinical presentation, whereas a minority (16%) routinely performed AST on all bacterial isolates. In 2014, laboratories reported performing susceptibility tests on a total of 98,788 isolates, with 2 laboratories not responding to this question. The number of isolates subjected to AST by an individual laboratory was 54–17,125 (median: 814 isolates; mean: 2,016 isolates).
There were no laboratories that reported performing AST on all categories of animals listed in the survey. Of the 47 respondents to this question, most laboratories conducted AST on isolates from cattle (85% of all laboratories), swine (79%), sheep and/or goats (83%), poultry (77%), horses (87%), dogs (87%), and cats (77%) (Table 1). Although not as common, 32% of laboratories reported performing AST on isolates from aquatic species, 47% tested isolates from wildlife, and 28% reported doing AST on pathogens recovered from zoological collections. Dogs were the top source for all bacterial isolates (51%), followed by cattle (14%), swine (9%), horses (8%), and cats (8%). The percentages for other animal sources are listed in Table 1.
Animal source of isolates tested for antimicrobial susceptibility in 2014 by 47 veterinary diagnostic laboratories in the United States.*
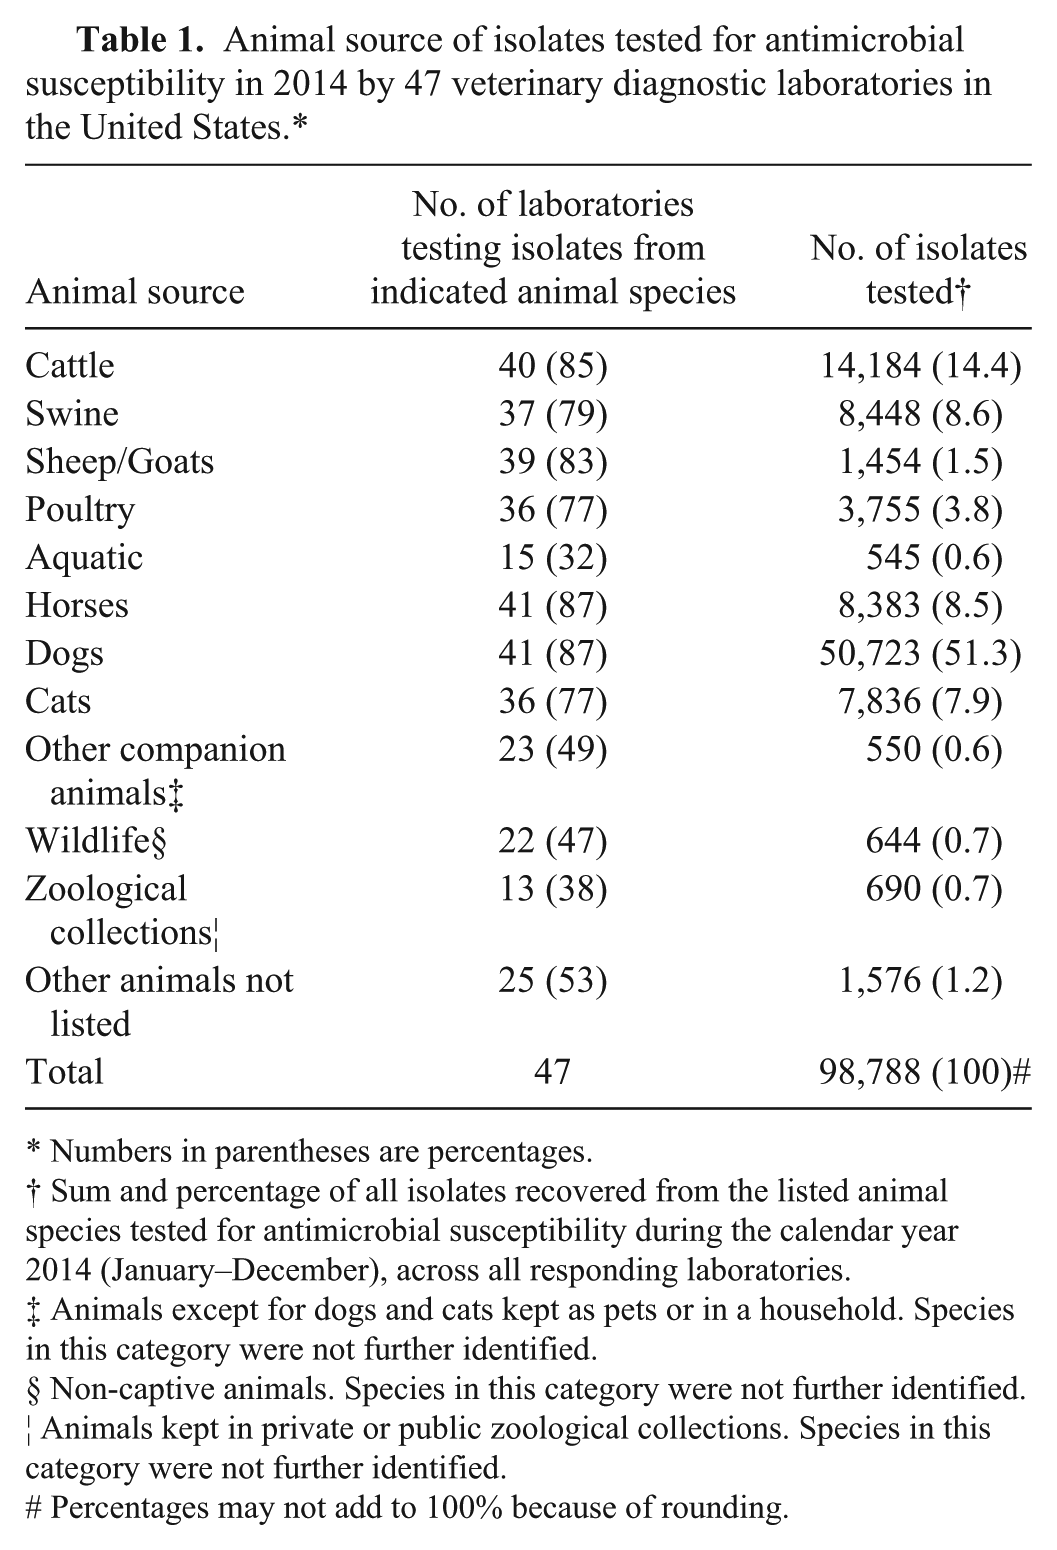
Numbers in parentheses are percentages.
Sum and percentage of all isolates recovered from the listed animal species tested for antimicrobial susceptibility during the calendar year 2014 (January–December), across all responding laboratories.
Animals except for dogs and cats kept as pets or in a household. Species in this category were not further identified.
Non-captive animals. Species in this category were not further identified.
Animals kept in private or public zoological collections. Species in this category were not further identified.
# Percentages may not add to 100% because of rounding.
Laboratories were asked to provide an ordered list of the 10 most common bacterial isolates on which they performed AST across all animal species (Table 2, Supplementary Table 1). Escherichia coli was listed by all 48 laboratories (100%), with 43 of these laboratories ranking E. coli as either the first or second most common pathogen subjected to AST. The second most frequently cited pathogen was Pseudomonas aeruginosa (33 of 48 laboratories, 69%), followed by Staphylococcus spp. and Salmonella spp., each being reported by 28 laboratories (58 %), then Pasteurella multocida (reported by 27 laboratories, 56%).
Bacterial pathogens most frequently tested for antimicrobial susceptibility, by animal species.
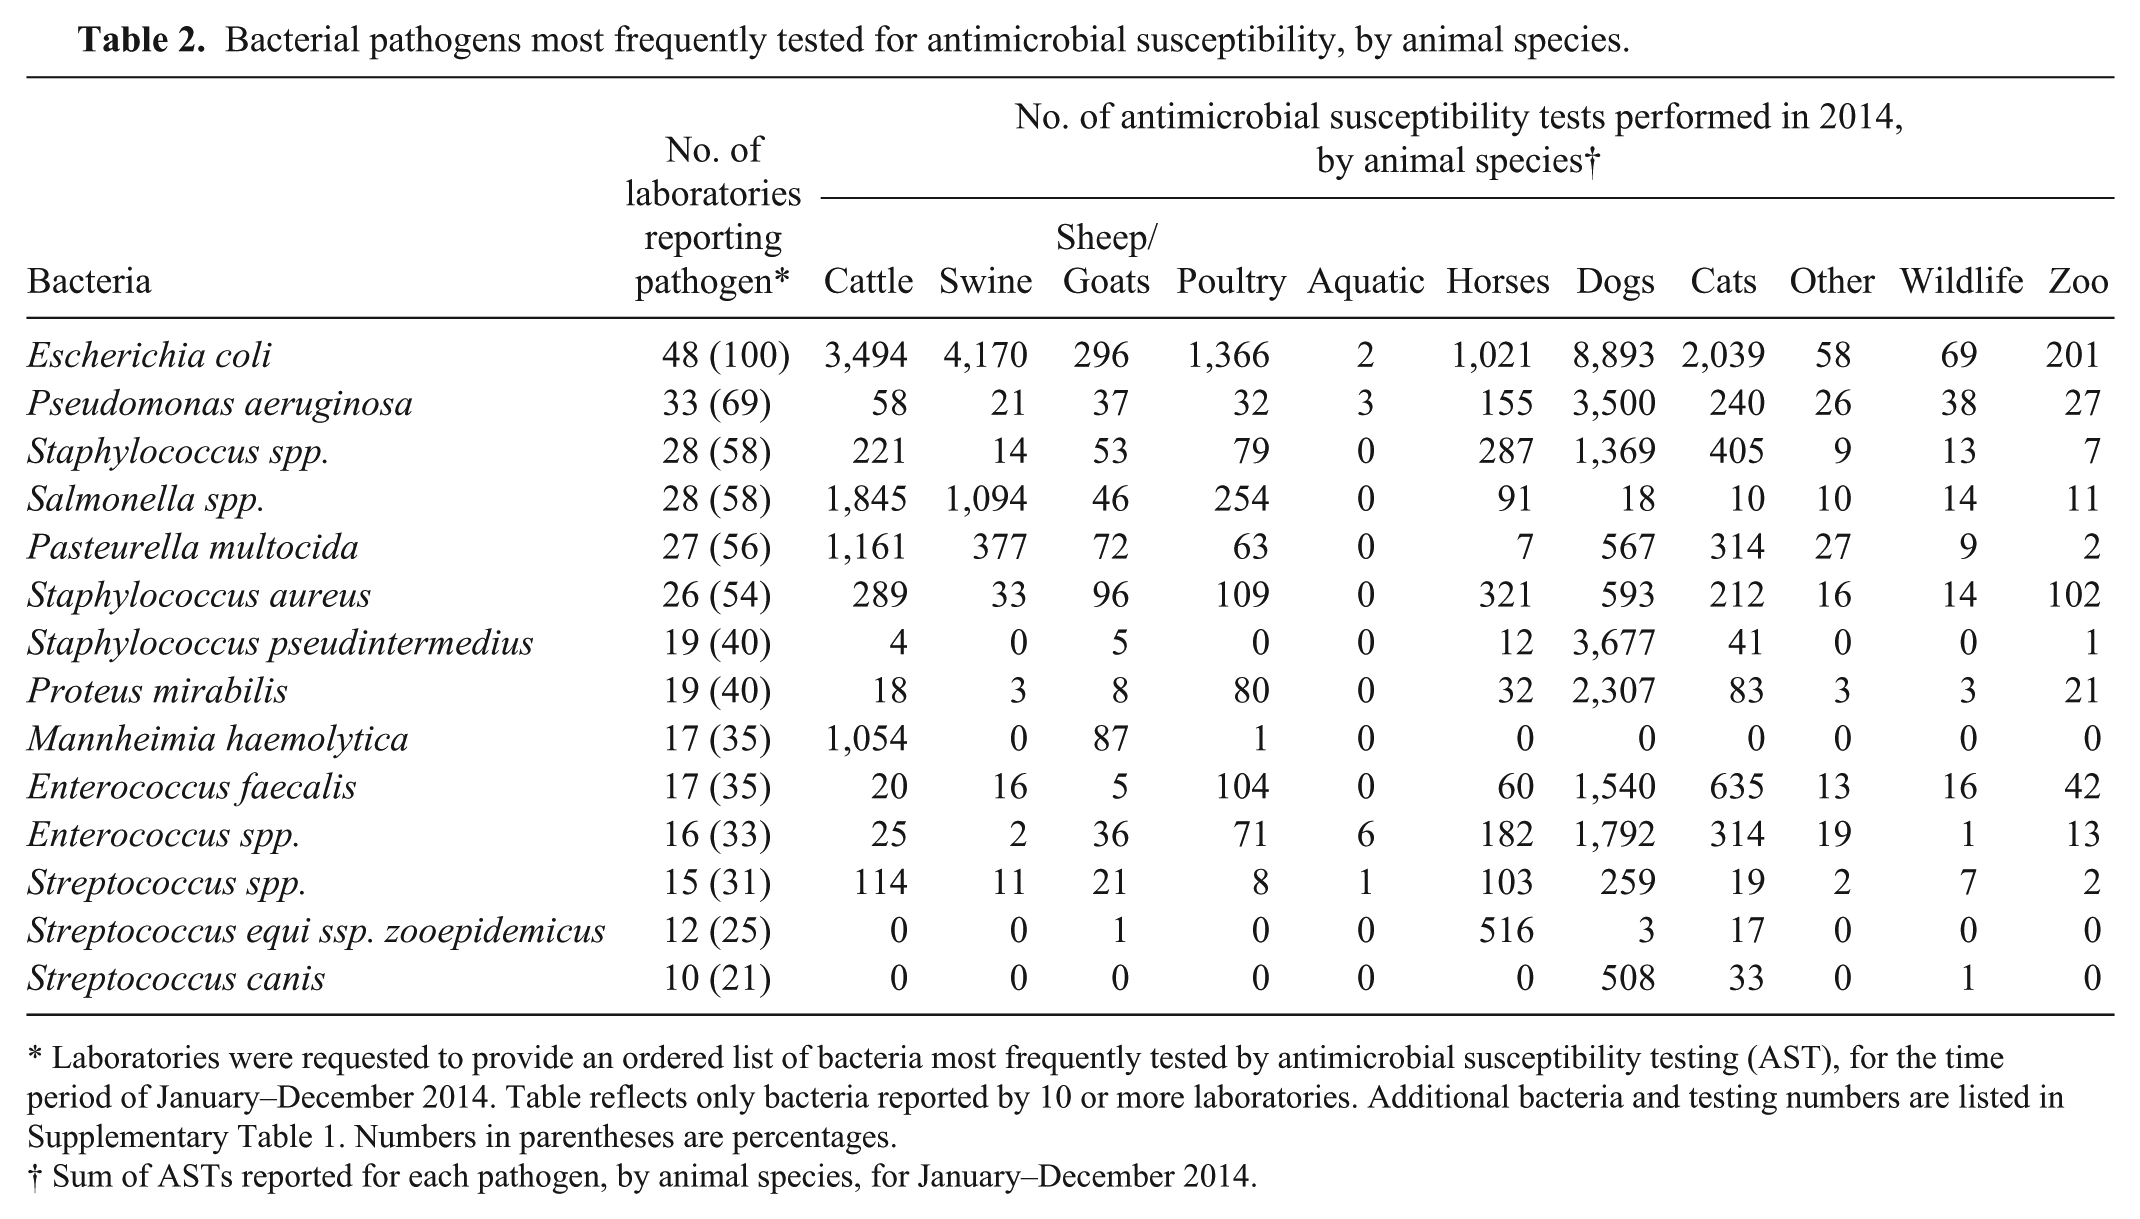
Laboratories were requested to provide an ordered list of bacteria most frequently tested by antimicrobial susceptibility testing (AST), for the time period of January–December 2014. Table reflects only bacteria reported by 10 or more laboratories. Additional bacteria and testing numbers are listed in Supplementary Table 1. Numbers in parentheses are percentages.
Sum of ASTs reported for each pathogen, by animal species, for January–December 2014.
AST information was also requested for individual animal species. Seven laboratories did not respond to this question in the survey; thus data in Table 2 and Supplementary Table 1 are cumulative totals for 42 laboratories. Again, E. coli was the most frequently tested pathogen for every animal species category except the aquatic category. Salmonella was the second most commonly tested pathogen for cattle, swine, and poultry; the third most tested were P. multocida (cattle), Streptococcus suis (swine), and Staphylococcus aureus (poultry). For horses, the second and third most commonly tested pathogens were Streptococcus equi ssp. zooepidemicus and beta-hemolytic Streptococcus spp. For dogs, the next most frequently tested bacteria were Staphylococcus intermedius and S. pseudintermedius; for cats, these were Enterococcus faecalis and Staphylococcus spp., Aeromonas hydrophila, A. salmonicida, and, for aquatic species, Aeromonas spp. were the most frequently tested. Additional animal species, pathogens, and number of isolates tested are listed in Table 2 and Supplemental Table 1.
The survey requested laboratories to focus specifically on isolates from clinical cases and monitoring and/or surveillance programs when responding to questions about techniques used for AST. Most laboratories (71%) use the disk diffusion method, with commercial systems also being frequently employed (61%). Twenty-one laboratories (43%) reported using both methods. The most commonly used commercial broth microdilution system was the Sensititre platform (59%; Thermo Fisher Scientific, Oakwood Village, OH). Alternative AST platforms reported included eTests (18%; bioMérieux, Hazelwood, MO), Vitek (12%; Vitek 2, bioMérieux), and BIOMIC (6%; BioMIC V 3 , Giles Scientific, Santa Barbara, CA). Molecular-based methods (6%) were also utilized for specific testing such as identifying the mecA gene, which confers methicillin resistance in Staphylococcus and Streptococcus.6,15 No laboratories reported using broth macrodilution or agar dilution methods for susceptibility testing.
For the Sensititre platform, 29 laboratories (59%) used commercial veterinary plates configured to provide relevant data for various animal species. Four laboratories used the plate developed for the NARMS program, and 3 laboratories used JustOne plates from Sensititre. Two laboratories used custom-designed plates. Laboratory-determined customized selection of antimicrobials used with the Kirby–Bauer disk diffusion method were most often used for diseases such as bovine mastitis, or for specific antibiotics not found on commercial plates.
Laboratories employed several CLSI guidance documents for AST data interpretation (http://clsi.org/standards/). The most commonly cited guideline was CLSI VET-01 A-4 7 (69%), which provides interpretive criteria for veterinary use. Automatically calculated interpretations provided by the commercial AST systems were used by 61% of the laboratories; 35% of the laboratories used CLSI M100-S25 8 developed for human isolates for interpreting AST results. Less than 20% of the laboratories used CLSI VET-03A 9 and/or CLSI VET-04 A2, 10 which provide guidelines for aquatic animal pathogens. A few individual laboratories used standards developed for NARMS, the CLSI M-45 11 standard for testing infrequently isolated or fastidious bacteria, or another standard.
Overall, 43% of all labs participated in an annual AST proficiency test (PT), with most taking part in an external or commercial test (41%), and a minority participating in an internal PT (6%). Of the external PTs available, 14 laboratories participated in the Internal Bacteriology Quality Assurance Survey prepared by NVSL and administered through AAVLD, 8 laboratories took a PT from the Animal and Plant Health Agency (formerly the Veterinary Laboratories Agency) in Great Britain, 1 laboratory participated in a PT offered through the College of American Pathologists, and 1 laboratory participated in a panel offered through the World Health Organization.
Only 50% of the laboratories reported routinely archiving bacterial isolates. Of these laboratories, 39% archived isolates indefinitely, and another 6% saved isolates for 1–5 y, with isolates being maintained by long-term storage methods (frozen at −70°C or lyophilized). However, not all isolates from every clinical case were archived; most laboratories only saved specific isolates on request or those that were rare or unusual strains from clinical cases.
In comparison, nearly all (98%) laboratories archived their AST results, with 88% maintaining data between 3 y and indefinitely. In most cases (92%), qualitative data on AST interpretation was archived using various automated testing platforms such as Sensititre (49%) and VITEK (12%). Over two-thirds of the laboratories (69%) stored AST data in their Laboratory Information Management System (LIMS), but only 57% of the LIMS are capable of exporting data to another system.
Accumulative or summary AST data were made available through public avenues only a minority of the time. Only 22% of laboratories compiled and published their AST data on a periodic basis, most commonly via annual reports published on the laboratory’s website or through peer-reviewed journals for specific pathogens.
Over one-third (39%) of laboratories reported in-house sequencing capabilities. Among these laboratories, Sanger sequencing technology was most frequently employed (20%), followed by next-generation sequencing using the Illumina MiSeq (18%; Illumina, San Diego, CA). Laboratories primarily used sequencing for bacterial identification or to identify a specific gene or genome segment. Relatively few laboratories (29%) reported having in-house bioinformatics staff or capabilities.
Discussion
The CARB action plan outlines 5 interrelated goals for action by the U.S. Government in collaboration with partners in healthcare, public health, veterinary medicine, agriculture, food safety, and academic, Federal, and industrial research. The second goal of this plan calls for federal agencies to strengthen national surveillance efforts of AMR in bacterial pathogens, and to integrate public health, animal health, food safety, and environmental arenas into a single combined effort. The plan also urges federal departments and agencies to collaborate via appropriate data sharing to enhance, expand, and coordinate existing surveillance systems, and to create a regional laboratory network that provides a standardized platform for AST and advanced capacity for genetic characterization of bacteria including whole genome sequencing (WGS).
The lead regulatory agency in the United States with respect to antimicrobial use and resistance in animals is the FDA; the USDA supports the FDA mandate through an in-depth knowledge of management practices and technologies associated with animal health, welfare, productivity, and food safety. As such, the USDA Action Plan proposes several initiatives that address recognized knowledge gaps related to AMR, including national cross-sectional and longitudinal studies to assess relationships between antimicrobial use in animals, AMR patterns, and livestock management practices. Monitoring AMR profiles in animal pathogens via public and private veterinary diagnostic laboratories is one way to help inform policymakers developing guidelines on prudent use, and producers and veterinarians when making treatment decisions.
Our survey was developed to elucidate essential background knowledge on current practices and technologies used by veterinary diagnostic laboratories in the United States in support of the role of both the USDA and the FDA in addressing antimicrobial resistance in animal populations. Responses from this survey provide a snapshot of AST in veterinary diagnostic laboratories, and many opportunities and challenges for addressing AMR surveillance in the animal health sector have been identified. For this survey, only one commercial laboratory responded, providing AST information for the majority of the canine and feline data reported herein, whereas information on production animals was reported from 48 public diagnostic laboratories. Thus, information on companion animals provided by this survey may not accurately reflect the current U.S. situation.
The majority (49 of 52) of veterinary diagnostic clinics and laboratories provide AST as a service for their clientele, consistent with a previous survey of veterinary diagnostic laboratories. 4 A slight downward trend in the average number of isolates subjected to AST per laboratory was noted; a 2003 study determined veterinary laboratories averaged ~2,567 tests per laboratory, 4 whereas this decreased slightly to 2,016 tests performed in our survey. However, because fewer laboratories responded to the 2015 survey, this average may be conservative.
Our results also confirm that disk diffusion and broth microdilution methods remain the preferred AST methods employed by most laboratories. These methods are generally considered to be interchangeable, given that disk diffusion zone diameters correlate inversely with minimum inhibitory concentrations (MICs) from broth microdilution tests. 16 However, some caveats must be considered when comparing results between these 2 methods. Regression analysis, even though mathematically correct, is not recommended by the CLSI for extrapolating MIC values from disk diffusion zone of inhibition measurements, as it cannot be considered comparable to an MIC derived by actual dilution testing for a given isolate. 7 In 2 separate studies, broth microdilution consistently underestimated E. coli resistance to antimicrobials in isolates derived from bovine clinical mastitis cases 28 and feedlot cattle. 3 Therefore, care must be taken to ensure that consistent methodology is used when comparing AST results between laboratories when developing a national surveillance plan.
Our survey indicates that veterinary laboratories generally use standardized interpretive criteria for evaluating AST results. Laboratories reported either using CLSI standards directly, or relying on automated software for interpreting AST data. The Sensititre, VITEK, and BIOMIC V 3 systems were most frequently employed; all of these manufacturers base AST interpretations on CLSI guidelines. Still, some variability between laboratories in AST interpretation is likely to exist, primarily because of delays in laboratories obtaining the most recent guidelines from CLSI or receiving software updates by manufacturers once new guidelines are released.
A significant advantage to partnering with veterinary clinics and diagnostic laboratories for a national surveillance program is the wide range of bacterial isolates routinely tested from many different animal species. This provides a consistent source of information for longitudinal studies and temporal trend analyses of AMR patterns. In 2014, dogs were the single most frequent animal source of bacterial isolates, with cattle, swine, horses, and cats also in the top 5 animal species, consistent with the previous report. 4 Similarly, the pathogens most frequently tested by laboratories were the same over time; E. coli, Pseudomonas spp., Staphylococcus spp., and Salmonella spp. remain significant pathogens of concern for both production and companion animals. 4 Thus, longitudinal surveillance programs using data from veterinary laboratories will undoubtedly yield valuable temporal information on AMR trends for the animal health community.
The utility of WGS for characterizing AMR means that this approach is rapidly gaining popularity in laboratory testing given that WGS provides rapid, accurate identification of resistance determinants and corroborates traditional epidemiologic information while identifying previously unsuspected transmission events. 26 Several studies have confirmed that WGS can accurately predict resistance phenotypes in veterinary pathogens, as well.1,20,30 As WGS and partial sequencing of specific genes gains momentum in clinical medicine, guidelines and standards to interpret these data will be needed. Despite these drawbacks, WGS is a viable tool that must be leveraged for AMR surveillance. Sequencing costs are currently ~US$50 per genome, 22 making this a feasible tool for veterinary medicine.
Retrospective studies of antimicrobial susceptibility patterns for various pathogens and host species have long provided the veterinary diagnostic community with invaluable information on resistance trends to selected antimicrobials over time. This literature helps inform clinicians and other scientists working in AMR about appropriate treatment options,5,12,13,17,18,24,25,27 previously obscure epidemiologic links between cases in outbreaks, 14 and detecting transmission events of resistance genes both within and across bacterial species.2,19 When information from AST is shared, it is usually through avenues such as the annual report of a diagnostic laboratory that is posted to the laboratory website, or via peer-reviewed scientific journal articles. To this end, ~25% of the laboratories in our survey reported providing summary data routinely, either through their annual reports or in refereed journal articles.12-14,18,19,23-25,27,29
A nationwide study analyzing AMR trends using retrospective data would also provide much needed information on resistance trends in multiple animal populations. However, prior to conducting such a study, resources in the form of either retrospective data or archived isolates must first be available. Our findings indicate that laboratories generally archive data and bacterial strains for several years, providing options for limited retrospective AST surveillance testing. Furthermore, at least some infrastructure is in place in the form of laboratory electronic databases that could provide a resource for conducting surveillance programs on a national level. However, studies such as these, which rely on voluntary contributions of data and funding provided through the annual federal budget process, must be carefully designed to minimize potential bias caused by a limited number of laboratories participating over time.
Prior to developing a nationwide surveillance program based on animal diagnostic laboratory data, several variables must be taken into consideration. First, bacterial AMR data obtained from only sick animals may not accurately reflect true resistance profiles of bacteria within animal populations as a whole. Therefore, other surveillance streams should be concurrently used to investigate antimicrobial usage with AMR in animal-associated bacterial populations. Conversely, this surveillance stream may be a preferred source for identifying the emergence of new resistance phenotypes and genotypes. Second, supplementary information associated with a bacterial isolate, such as source, animal age, production type, or previous antimicrobial usage, is often lacking when specimens are submitted to a diagnostic laboratory for testing, and laboratories may not have an efficient method for gathering this information. Similarly, data formats for electronic messaging requirements will need to be standardized to rapidly and efficiently exchange data between the laboratories performing the service and the agencies or institutions performing the data analysis. To this end, the CDC has developed a format following the Health Level (HL7) Clinical Document Architecture (https://goo.gl/lFk0VO). Finally, client confidentiality concerns will need to be addressed by both participating laboratories and government agencies using this information to ensure that the necessary policies and agreements are in place prior to initiating this surveillance stream.
Footnotes
Acknowledgements
We thank the members of the joint USDA-AAVLD antimicrobial resistance working group, comprised of representatives from AAVLD veterinary diagnostic laboratories, CLSI, the Center for Veterinary Medicine (FDA), and the Center for Epidemiology and Animal Health and the National Veterinary Services Laboratories (both part of USDA-APHIS Veterinary Services), for their input and critical review of the survey questions. We also thank AAVLD for their assistance with distributing and compiling survey results.
Authors’ note
The views and conclusions contained in this document are those of the authors and should not be interpreted as representing official policies of the U.S. Department of Agriculture.
Declaration of conflicting interests
The authors declared no potential conflicts of interest with respect to the research, authorship, and/or publication of this article.
Funding
The authors received no financial support for the research, authorship, and/or publication of this article.
References
Supplementary Material
Please find the following supplemental material available below.
For Open Access articles published under a Creative Commons License, all supplemental material carries the same license as the article it is associated with.
For non-Open Access articles published, all supplemental material carries a non-exclusive license, and permission requests for re-use of supplemental material or any part of supplemental material shall be sent directly to the copyright owner as specified in the copyright notice associated with the article.