
Abstract
Every day, thousands of samples from diverse populations of animals are submitted to veterinary diagnostic laboratories (VDLs) for testing. Each VDL has its own laboratory information management system (LIMS), with processes and procedures to capture submission information, perform laboratory tests, define the boundaries of test results (i.e., positive or negative), and report results, in addition to internal business and accounting applications. Enormous quantities of data are accumulated and stored within VDL LIMSs. There is a need for platforms that allow VDLs to exchange and share portions of laboratory data using standardized, reliable, and sustainable information technology processes. Here we report concepts and applications for standardization and aggregation of data from swine submissions to multiple VDLs to detect and monitor porcine enteric coronaviruses by RT-PCR. Oral fluids, feces, and fecal swabs were the specimens submitted most frequently for enteric coronavirus testing. Statistical algorithms were used successfully to scan and monitor the overall and state-specific percentage of positive submissions. Major findings revealed a consistently recurrent seasonal pattern, with the highest percentage of positive submissions detected during December–February for porcine epidemic diarrhea virus, porcine deltacoronavirus, and transmissible gastroenteritis virus (TGEV). After 2014, very few submissions tested positive for TGEV. Monitoring VDL data proactively has the potential to signal and alert stakeholders early of significant changes from expected detection. We demonstrate the importance of, and applications for, data organized and aggregated by using LOINC and SNOMED CTs, as well as the use of customized messaging to allow inter-VDL exchange of information.
Keywords
Introduction
Every day, thousands of samples from diverse species and populations of animals, which represent many hundreds of cases, are submitted to a veterinary diagnostic laboratory (VDL) for testing. Submission of samples for testing occurs for many reasons, including the need to establish a definitive disease diagnosis; detect, quantify or characterize specific agents or analytes; and support monitoring or surveillance of populations for agents of interest. The processes of sample submission and laboratory testing need to generate accurate information that can be used by submitters for clinical decisions affecting animal health. Moreover, collated veterinary laboratory data can be used by both official and unofficial programs to inform the detection of endemic, emerging, or epidemic pathogens in a specific region, state, or nation.
Different VDLs use different tests and testing procedures for the detection and quantification of various analytes. There is considerable variation between VDLs in the particular assays used to perform tests, in definitions of the boundaries of test results (i.e., positive or negative), and in reporting results, as well as the capture of case history, signalment, and demographic information. Each VDL has a generally unique laboratory information management system (LIMS) responsible for capturing, storing, and managing data from submission documents, testing processes and procedures, reporting results, and accounting, all of which generate vast quantities of data.
Recovery and usage of intra-VDL data are usually straightforward, given that personnel understand their unique data structure and the format available in their own VDL LIMS. However, inter-VDL data communication and integration of anonymized laboratory data are challenging given the VDL-specific data structure, variation in technologic capabilities available, extent of implementation of data management technology, stage of technologic maturity present within each VDL, and different terminology and methods to identify and report samples, analytes, tests, and test results. 13 Adopting universally recognized veterinary diagnostic data standards 22 can facilitate the process of data transfer across VDLs.
Data standardization can be achieved by mapping VDL-specific test procedures and results by using universal standard codes. 13 The Logical Observation Identifiers Names and Codes (LOINC; https://search.loinc.org/searchLOINC) is a universal code system that enables laboratory testing and testing procedure data standardization.9,12,27 Another terminology available is the Veterinary Terminology Services Laboratory (VTSL; https://vtsl.vetmed.vt.edu/default.cfm), which is an extension of the Systematized Nomenclature of Medicine–Clinical Terms codes (SNOMED CT; https://www.snomed.org/). SNOMED CT provides practical application of standardized medical terminologies to facilitate the recording and analysis of clinical information and can be used to standardize the recording of specimens used for analyte type testing. Together, LOINC and SNOMED CT allow precise recording of test measurements or observations that have clinically different meanings, allowing VDLs to exchange data.
In March 2018, the USDA discontinued the Swine Enteric Coronavirus Disease (SECD) Situation Reports, which were in place since 2014 (https://www.aphis.usda.gov/aphis/newsroom/news/sa_by_date/sa-2018/secd-reporting). The reports provided information about porcine epidemic diarrhea virus (PEDV) and porcine deltacoronavirus (PDCoV), which are transboundary diseases that had been introduced recently into the United States. PEDV was first detected in the United States during early 2013. 26 PDCoV emerged in 2014, affecting the U.S. swineherd.14,31 The estimated losses caused by PEDV during 2013 were 3 million pigs, 15 and the total estimated losses as a result of PEDV and PDCoV since their entry into the United States are >7–9 million pigs.6,16 The devastating impact of these diseases underscores the need to implement efficient surveillance programs to assist in the management of the circulation of these disease agents in the swine industry. Thus, there was an urgent need and stakeholder demand to continue monitoring swine enteric coronaviruses in the United States.
During 2017, we initiated the Swine Disease Reporting System (SDRS), a program to perform aggregation and monitoring of testing data for porcine reproductive and respiratory syndrome virus (PRRSV; Betaarterivirus suid 1, Betaarterivirus suid 2) from 4 U.S. swine-centric VDLs.29,30 This program aggregated data from multiple VDLs to monitor PRRSV as well as other agents or diseases that are detected on a large scale. Moreover, it also allowed the tabulation, characterization, and visualization of patterns of agent detection or disease diagnosis over time, geographic space, species, age groups, sample type, and other relevant factors. 29 The aggregation of PRRSV test data from 4 VDLs with high swine caseloads allowed us to create a structured platform that can be easily adapted and replicated to report the detection of other agents from other species as well. Thus motivated, the SDRS project was expanded to incorporate and inform stakeholders of rates, trends, and geographic distributions of enteric swine coronaviruses detected by reverse-transcription PCR (RT-PCR). Using swine enteric coronaviruses as a model, our objective here is to describe the methods and application of tools to standardize laboratory data using SNOMED CT, LOINC, inter-VDL data transmission (health level 7 [HL7] messaging, and comma-separated values [CSV] transfer), and data integration and monitoring capabilities.
Materials and methods
Four participating VDLs (Iowa State University Veterinary Diagnostic Laboratory, ISU-VDL; University of Minnesota Veterinary Diagnostic Laboratory, UMN-VDL; South Dakota State University Animal Disease and Research Diagnostic Laboratory, SDSU-ADRDL; Kansas State University Veterinary Diagnostic Laboratory, KSUU-VDL), agreed to share data on swine enteric coronavirus detection. To consistently and concisely recover submission information, test procedure, and categorical testing results interpretation (i.e., positive, suspect, inconclusive, negative) for PEDV, PDCoV, and transmissible gastroenteritis virus (TGEV) detection by RT-PCR, queries were created to recover, download, save, and share VDL data from the 4 LIMS in a CSV format. Collection of data started in 2018, data were retrospectively recovered from 1 December 2009 to 28 February 2018 and prospectively collected from 1 March 2018 to 31 May 2020. PEDV and PDCoV data started at the first detection of these agents at participating VDLs in 2013 and 2014.
The participating VDLs, owner information, and submitter were anonymized. CSV files were shared with the SDRS project coordination office located at ISU to implement data-wrangling procedures to clean, map, organize, and prepare the data to a collated format allowing integration. Different informatics platforms can easily connect collated data. 32 In November 2018, ISU-VDL and UMN-VDL started sharing their information by using Health Level Seven International (HL7; http://www.hl7.org/; i.e., real-time connectivity for the exchange, integration, sharing, and retrieval of electronic animal health information); KSU-VDL and SDSU-ADRDL continued to use the CSV format. A data warehouse was structured to receive and store the shared data on a server hosted at ISU. IT personnel from the 4 VDLs collaborated to set connectivity and messaging capabilities. Messaging capabilities were structured at the 4 VDL LIMS to daily message newly generated data. Secure electronic password-protected SQL connections using an SQL script (SAS v.9.4; SAS Institute) allowed access to the data warehouse database and recovery of data. Daily runs of all SAS scripts using the Windows Task Scheduler (Microsoft) feature were programmed in this application. This allowed automation of the processes of connecting to the databases, recovering data, and processing the data to a standardized format. Historical (CSV format) and newly generated data were integrated using a proc merge SAS built-in procedure.
Data were organized to report information at a submission level using the submission accession ID as the unique identifier. The received date at VDLs was used as the time identifier. The site state was used as a geographic location identifier. To report only information coming from samples collected at commercial swine facilities, a SAS script was written with procedures to “clean” the data by removing information that represented research, testing for export, testing for exhibition, vaccine sample testing, truck samples, or non-porcine samples (Suppl. Table 1).
Data mapping procedures to report the test categorical interpretation result as positive, negative, suspect, or inconclusive, according to the reports by participating VDLs, were implemented. For the data shared in CSV format, different VDL-specific scripts were implemented to map test interpretation data. Up to 3 distinct column identifiers in an intra-VDL database were used to recover the analyte and the scale of the test result. Preferred LOINC codes were used. However, in cases in which the VDL database was not mapped and structured to inform LOINCs, the information on VDL-specific test ID and test type was used to map test results. On the other hand, mapping of data shared in the HL7 format was straightforward and took advantage of LOINC codes (Suppl. Table 2).
Similarly, specimen mapping procedures using SNOMED CT and sample types were implemented. To facilitate specimen data visualization, those specimens representing <5% of all submissions within an analyte, during the summarized period, were renamed, grouped, and reported as “other.” Submissions having >1 specimen tested for each analyte type had the specimen reported as “multiple” (Suppl. Table 3).
In preparation for data visualization, new variables were created: season, year, and age category. Briefly, the month information extracted from the received date of June–August had the season assigned as “summer”; September–November as “fall”; December–February as “winter”; March–May as “spring.” For the SDRS purpose, a year corresponds to a full 4-season cycle that starts on 1 December and ends on 30 November of the subsequent year; 2019 started on 1 December 2018 and ended on 30 November 2019. Currently, there is no standard terminology available to capture and report the farm type from which the samples had been collected. To report farm type, a new variable named “age category” was created by combining and mapping available information from age, age unit, and farm type (Suppl. Tables 4.1–4.3).
The final intra-VDL processed and mapped datasets in a collated format were integrated to form the inter-VDL database by using a SAS data merge step. The final integrated dataset was exported from SAS into a CSV format and stored on an ISU computer. The dataset was then connected to a visualization platform, Power BI (Power Business Intelligence; Microsoft), to construct dynamic dashboards for data visualization using the Power BI built-in add-in features. Dynamic charts allow for the exploration of patterns of the number of submissions tested over time, percent of positive submissions, specimens, and age categories.
The monitoring of overall analyte detection was assessed by monitoring the percentage of positive submissions. Weekly counts of the total submissions tested, positive submissions, and percent of positive submissions (positive/total × 100%) were recovered from the data. The overall weekly percent of positive submissions was monitored using a cyclic regression model. 30 Weekly percentages of positive submissions were used to construct a historical baseline and to forecast the following 52 points, each corresponding to 1 of the 52 wk in the following year, expected percentage of positive submissions, and the predicted 95% confidence interval (CI). The cyclic regression model compares the observed percentage of positive submissions with the predicted percentage of positive submissions and its predicted 95% CI. 30 PEDV and PDCoV epidemic years of 2013 and 2014 were not used to construct baseline periods for these agents.
Monthly overall state-level changes in the percentage of positive submissions were assessed by using exponential smoothing models (ESMs) to forecast the expected 12-mo period. Model-recovered residuals (i.e., predicted values discounted of observed values) were scanned by an exponential weighted moving average (EWMA) model to monitor and inform of potential changes from the expected baseline. Because of potential confidentiality issues, only states in which the participating VDLs are located and the states that had a swineherd inventory ≥2 million pigs were included. 17 Retained states were Illinois (IL), Indiana (IN), Iowa (IA), Kansas (KS), Minnesota (MN), Missouri (MO), Nebraska (NE), North Carolina (NC), Ohio (OH), Oklahoma (OK), and South Dakota (SD). The state of NE was excluded from PDCoV monitoring because historical information on the percentage of positive submissions was not enough to construct baselines.
State monthly counts of the total, positive, and percentage of positive submissions (positive/total × 100%) were recovered from the data. Early detection of changes in a monitored parameter is most effectively detected by first preprocessing the data to remove systematic events, and then use a detection method on the residuals. 10 The assumption behind smoothing models is that the data are locally stationary, and the process that generates observed data is roughly constant over a short period. 10 To remove the systematic effects of the data, an ESM with optimized smoothing weights and considering smoothing models (simple, double, linear, damped trend, seasonal, winters additive, and winters multiplicative) were implemented to preprocess the data. Additional modeling, considering log or square root transformation of the data, was implemented before the preprocessing. Modeling was implemented in SAS using ESM available in the SAS built-in PROC ESM procedure. The year 2015 was the first to be included to construct PEDV and PDCoV baselines, and the first forecast was performed for the year 2018 using 2015–2017 as the baseline. TGEV was not included in the analysis given the very few positive submissions detected after 2014.
Given that more years were available to be incorporated in the baseline for the upcoming yearly prediction, a model selection was performed considering 3, 4, or 5 y in the historical data. The number of years that had the lowest root mean square error, along with the smallest Akaike information criterion (AIC), was chosen to preprocess the data. The model with the chosen baseline period was reapplied to the ESM procedure to forecast the upcoming predicted 12 points (i.e., next year 12 mo) for the percentage of positive results (lead = 12; interval = month). Historical residuals were recovered from the predicted model and scanned by an EWMA algorithm to construct the EWMA baseline (lambda 0.3). The residual for the upcoming 12 mo (i.e., the observed percentage of positive minus previous forecast results) were then scanned by the EWMA algorithm. The EWMA findings were reported as changes in standard deviations (SDs) from the expected baseline. Changes from baseline were reported as 1) no change when results were <2 SD from baseline; 2) changes of 2–3 SD from baseline; 3) changes of >3 SD above or below the baseline. Information for each state regarding the change from baseline, the number of total and positive submissions, and percentage of positive results were recovered from the models and transferred to Power BI for geographic visualization using a colored map.
Results
Data integration of porcine enteric coronaviruses among 4 swine-centric VDLs continues to be executed and monitored successfully. Recovered data from each VDL were submitted to data-wrangling procedures and transformed into a collated format allowing integration and connection with a data visualization platform and summarization across participating VDLs. The generated and aggregated information was transferred to a visualization platform and is available publicly online at http://www.fieldepi.org/SDRS. Monthly relevant findings from this project are compiled in reports, available at the Iowa State University Library Digital repository at https://lib.dr.iastate.edu/swinedisease_reports.
A total of 242,811 submissions were tested for PEDV. After the start of testing in 2013, the number of submissions tested for PEDV peaked during the spring of 2014 at 11,784, and had the smallest number of submissions tested during the fall of 2017 at 7,418 (Fig. 1A).
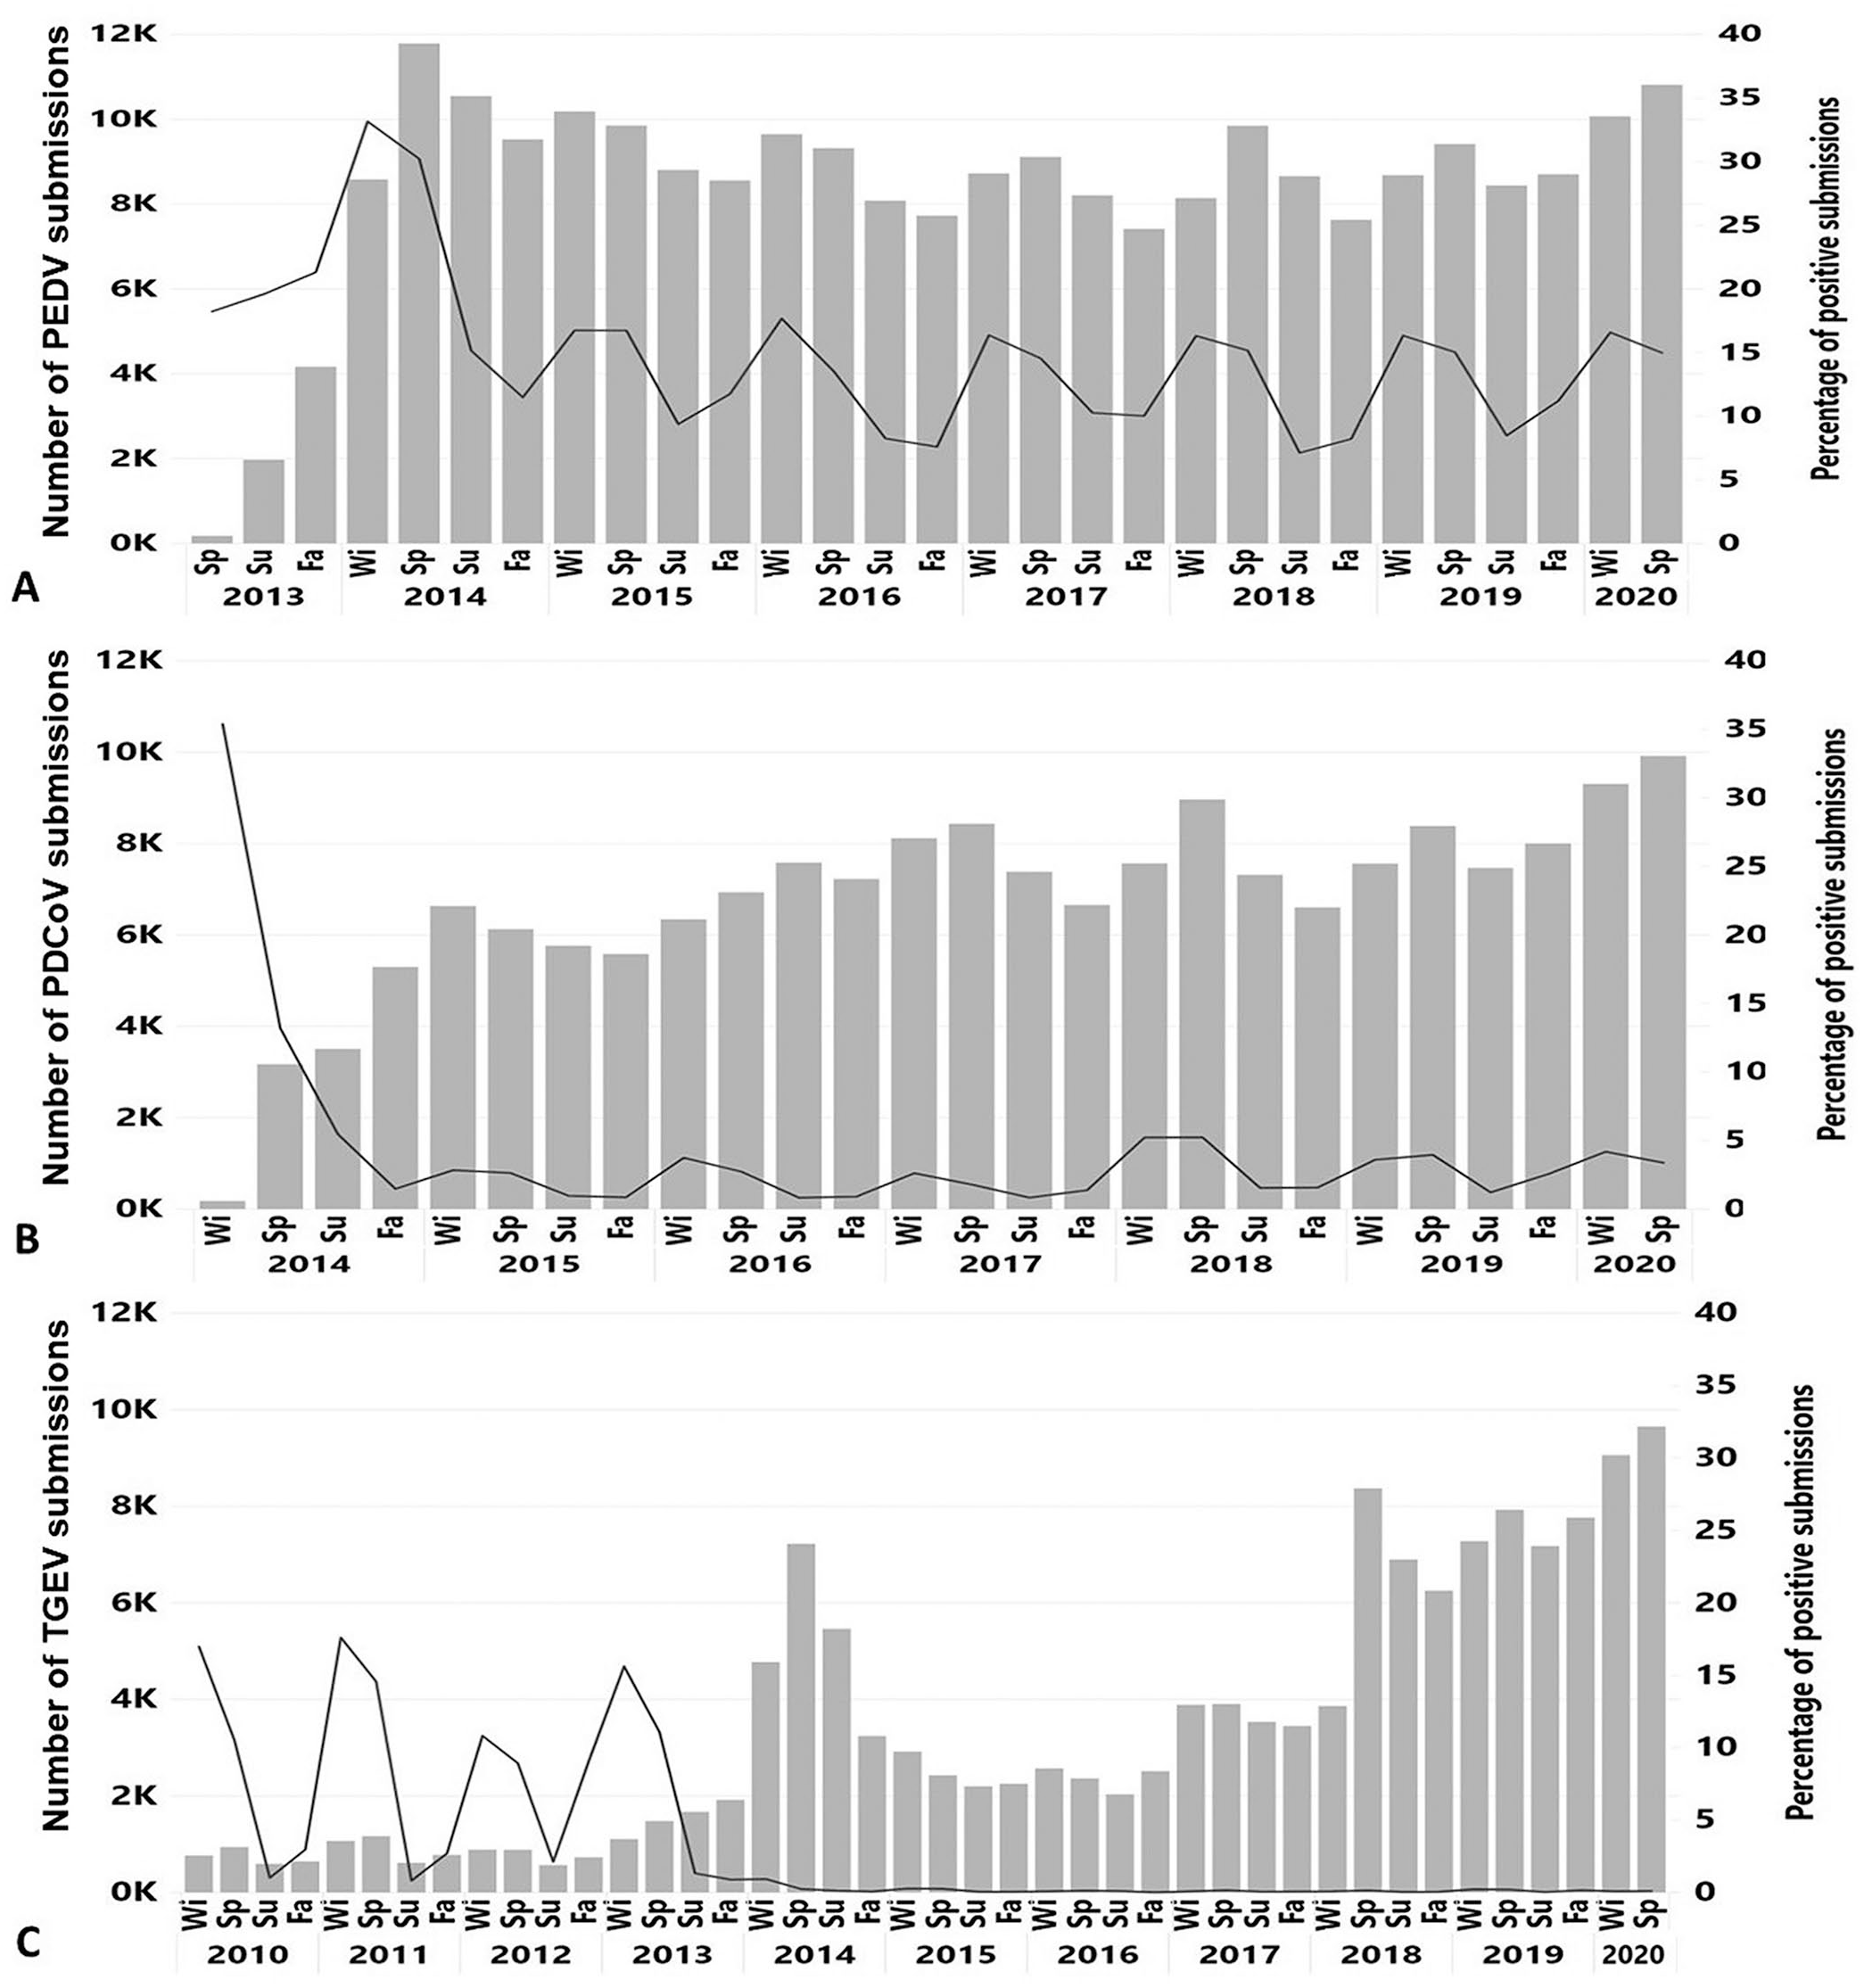
Number of submissions tested for
A total of 176,059 submissions were tested for PDCoV. During the fall of 2016, the number of submissions tested for PDCoV (n = 7,585) was close to the number of submissions tested for PEDV (n = 8,082; Fig. 1B), and this closely matches the beginning of PCR testing using a multiplex 5 assay at one participating VDL, whereby submissions were concomitantly tested for PEDV and PDCoV.
A total of 144,855 submissions were tested for TGEV since 1 December 2009. A 101% increase in the number of submissions tested for TGEV was observed from 2012 (n = 3,068) to 2013 (n = 6,180), and dramatically increased by 235% from 2013 to 2014 (n = 20,704). In 2014, 2 of the 4 participating VDLs started to offer, for the first time and on a fee-for-service basis, testing for TGEV 8 concomitantly with PEDV and PDCoV testing. Another significant increase in the number of submissions tested for TGEV was observed during the winter of 2017 (n = 3,890), and spring of 2018 (n = 8,372; Fig. 1C) when the other 2 participating VDLs started to offer the possibility to test the submissions for all 3 agents by using commercial or in-house developed multiplex or triplex PCR assays.
A consistently recurrent seasonal pattern with the highest percentage of positive submissions detected during winter (December–February) was observed for TGEV and PEDV. PDCoV followed a similar pattern of detection with the exception of 2018 and 2019, when the highest percentages of positive submissions were detected during spring (March–May; Fig. 1B). PEDV had a detection pattern with a lower percentage of positive results for the second half of 2014 and for the years afterward compared with the second half of 2013. A similar scenario was revealed for PDCoV with the highest detection observed during the first year (2014), lowering afterward. From 2014 to 2019, a very restricted number of submissions (mean = 29, median = 18) tested positive for TGEV within a given year.
Oral fluids, feces, and fecal swabs were the specimens used most commonly for enteric coronavirus testing. Oral fluids were 111,696 of 242,811 (46.0%), feces 45,040 of 242,811 (18.5%), and fecal swabs 32,147 of 242,811 (13.3%) of the submissions tested for PEDV (Fig. 2A). Oral fluids were 88,072 of 176,059 (50.0%), feces 30,201 of 176,059 (17.2%), and fecal swabs 20,178 of 176,059 (11.5%) of the submissions tested for PDCoV (Fig. 2B). Oral fluids were 62,000 of 144,855 (42.8%), feces 33,349 of 144,855 (23.0%), tissues 14,433 of 144,855 (10%), and fecal swabs 13,037 of 144,855 (9%) of the submissions tested for TGEV (Fig. 2C). From 2010 to 2013, TGEV testing was performed mostly on feces (7,391 of 15,819; 46.7%) and tissue samples (6,339 of 15,819; 40.1%). From 2014 to 2020, oral fluids were used more frequently for TGEV testing and 61,521 of 129,036 (47.7%) submissions were tested for TGEV (Fig. 2C).
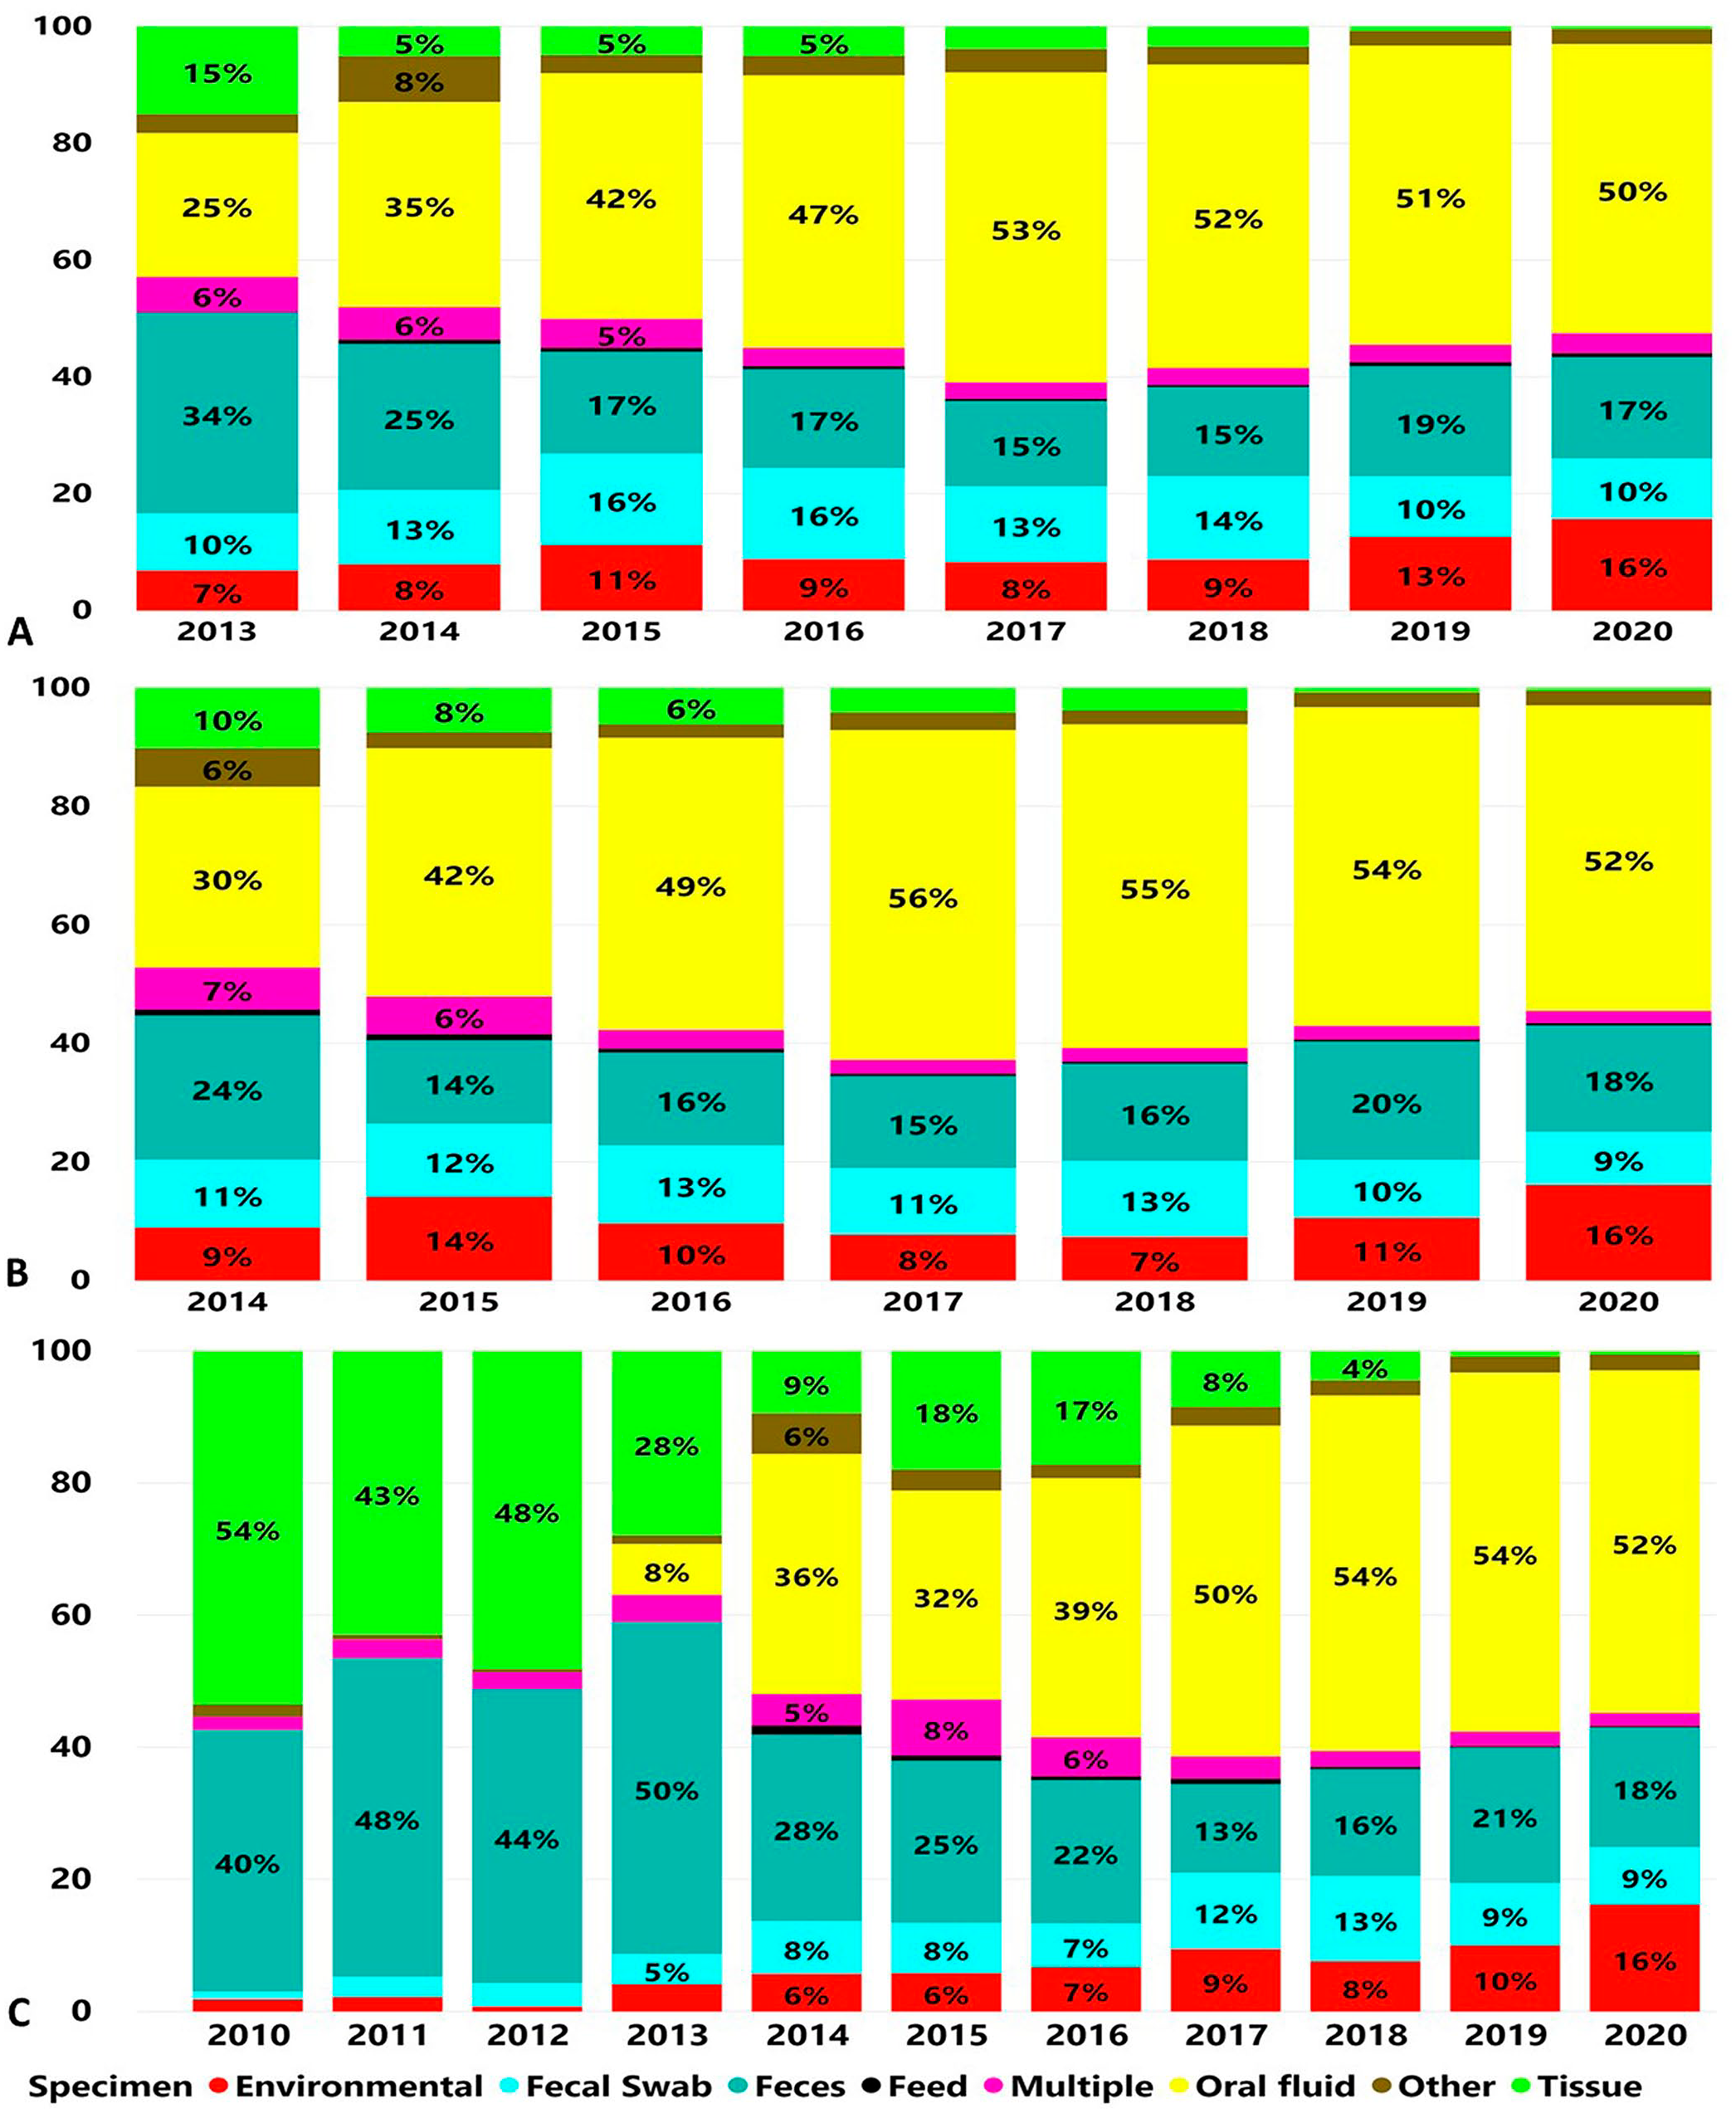
Proportions of specimen types according to number of cases submitted for testing by RT-PCR over time.
Unrecovered age category information represented by the age category “unknown” represented the highest number of submissions tested for enteric coronaviruses PEDV: 98,040 of 242,811 (40.4%; Fig. 3A), PDCoV: 76,751 of 176,059 (43.6%; Fig. 3B), and TGEV: 66,438 of 144,855 (45.9%; Fig. 3C). From the identified age category, “grow-finish” and “nursery” were the 2 age categories selected most frequently for enteric coronavirus testing. Age category grow-finish was 51,837 of 242,811 (21.34%) and nursery 31,073 of 242,811 (12.8%) of the submissions tested for PEDV (Fig. 3A). Age category grow-finish was 30,634 of 176,059 (17.4%) and nursery 22,272 of 176,059 (12.6%) of the submissions tested for PDCoV (Fig. 3B). Age category grow-finish was 25,131 of 144,855 (17.4%) and nursery 20,253 of 144,855 (14%) of the submissions tested for TGEV (Fig. 3C).
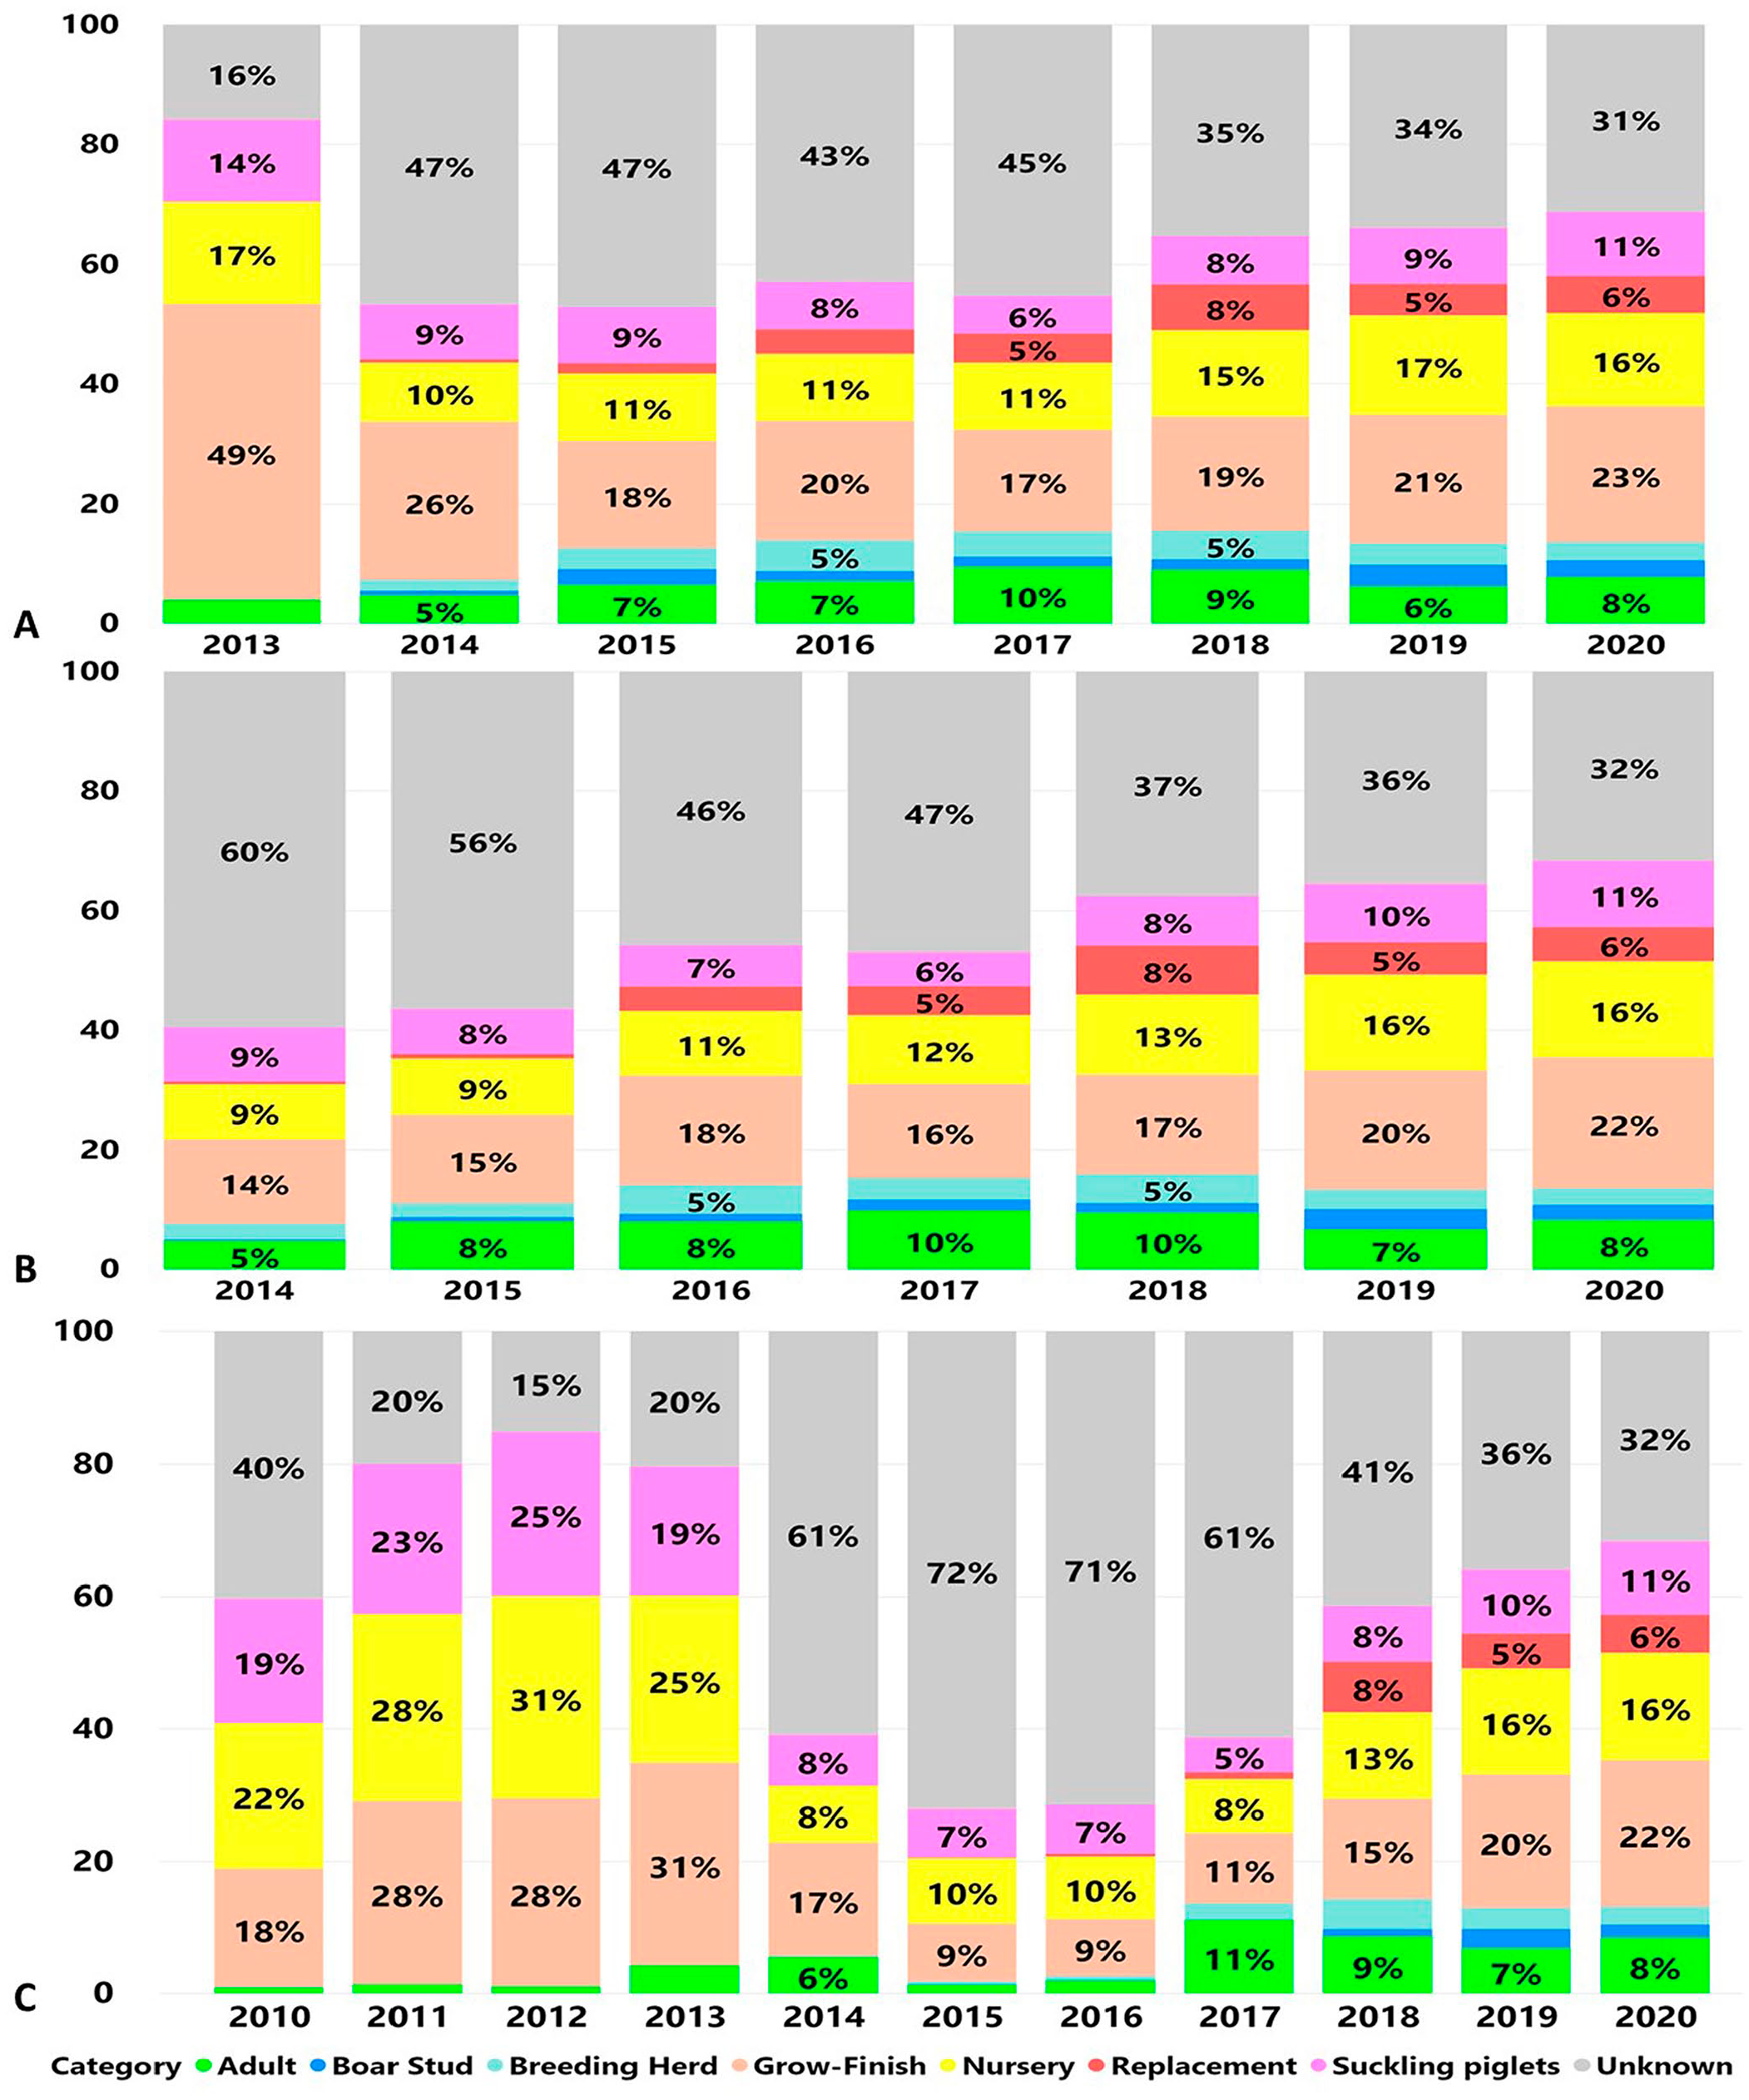
Proportions of submissions by age category according to the number of cases submitted for testing by RT-PCR over time.
The observed yearly cyclic pattern of the percentage of positive submissions was scanned and monitored by the cyclic regression model (Fig. 4). Monitoring the detection of PEDV (Fig. 4A) and PDCoV (Fig. 4B) by monitoring the percentage of positive submissions is informative by providing information on the expected detection and changes from the predicted baseline of these agents. The percentage of positive submissions tested for PEDV and PDCoV decreased during the first and increased during the second half of the monitored years. At week 17 of 2020, PEDV detection was outside the 95% CI, mostly because of increased detection in the “wean-to-market” age category. At week 9 of 2013, detection of TGEV was outside the 95% CI, mostly because of increased detection in the wean-to-market age category. TGEV detection was within the 95% CI for the weekly predicted percent positivity until week 46 of 2013 (Fig. 4C), and then declined sharply. The monitoring of TGEV after 2014 could not be performed because of a very limited number of positive submissions.
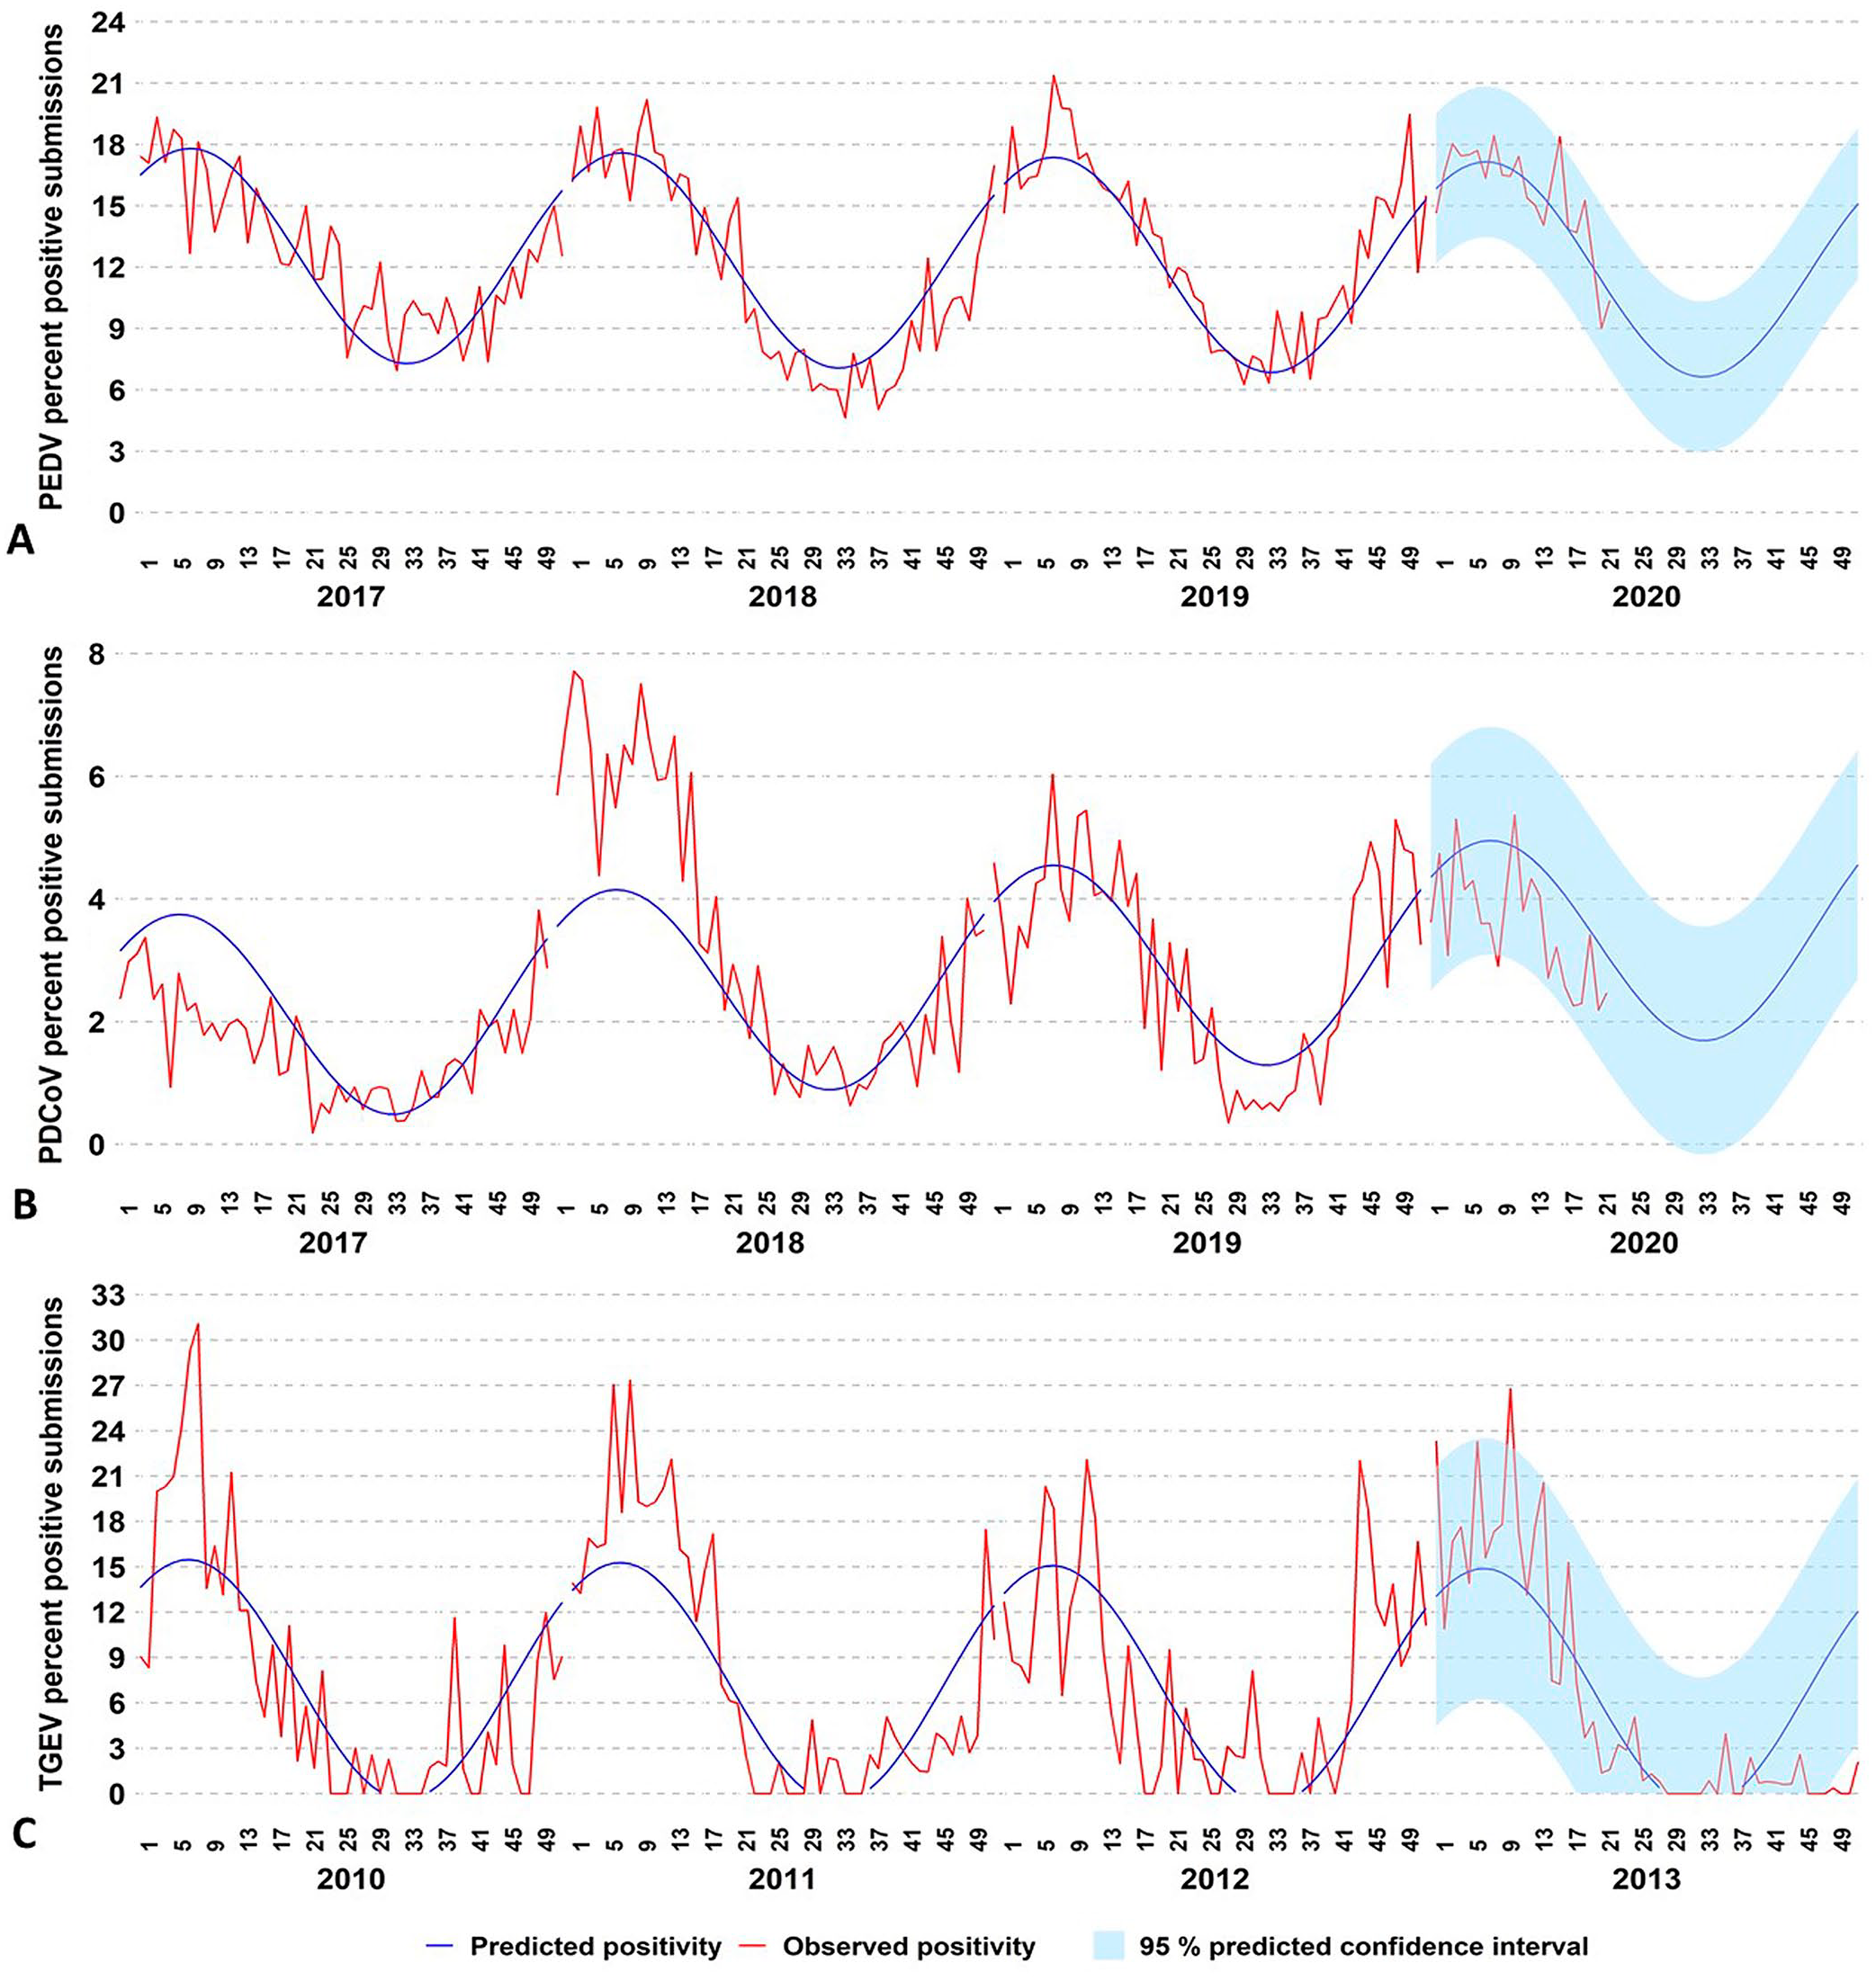
Monitoring enteric coronavirus percentage of positive submissions obtained by testing samples with RT-PCR testing.
The integration of algorithms to scan and monitor the state-specific level of the percentage of positive submissions with a data visualization tool allowed us to look into specific regional changes from the expected baseline patterns of detection. For 2020 and at state-level specific baselines, PEDV was above 3 SDs in NE during February and March. PDCoV was above 3 SDs in OK in January and February, NC in April, and NC and OH in May (Fig. 5). Each state required a different baseline period and algorithm (Suppl. Table 5).
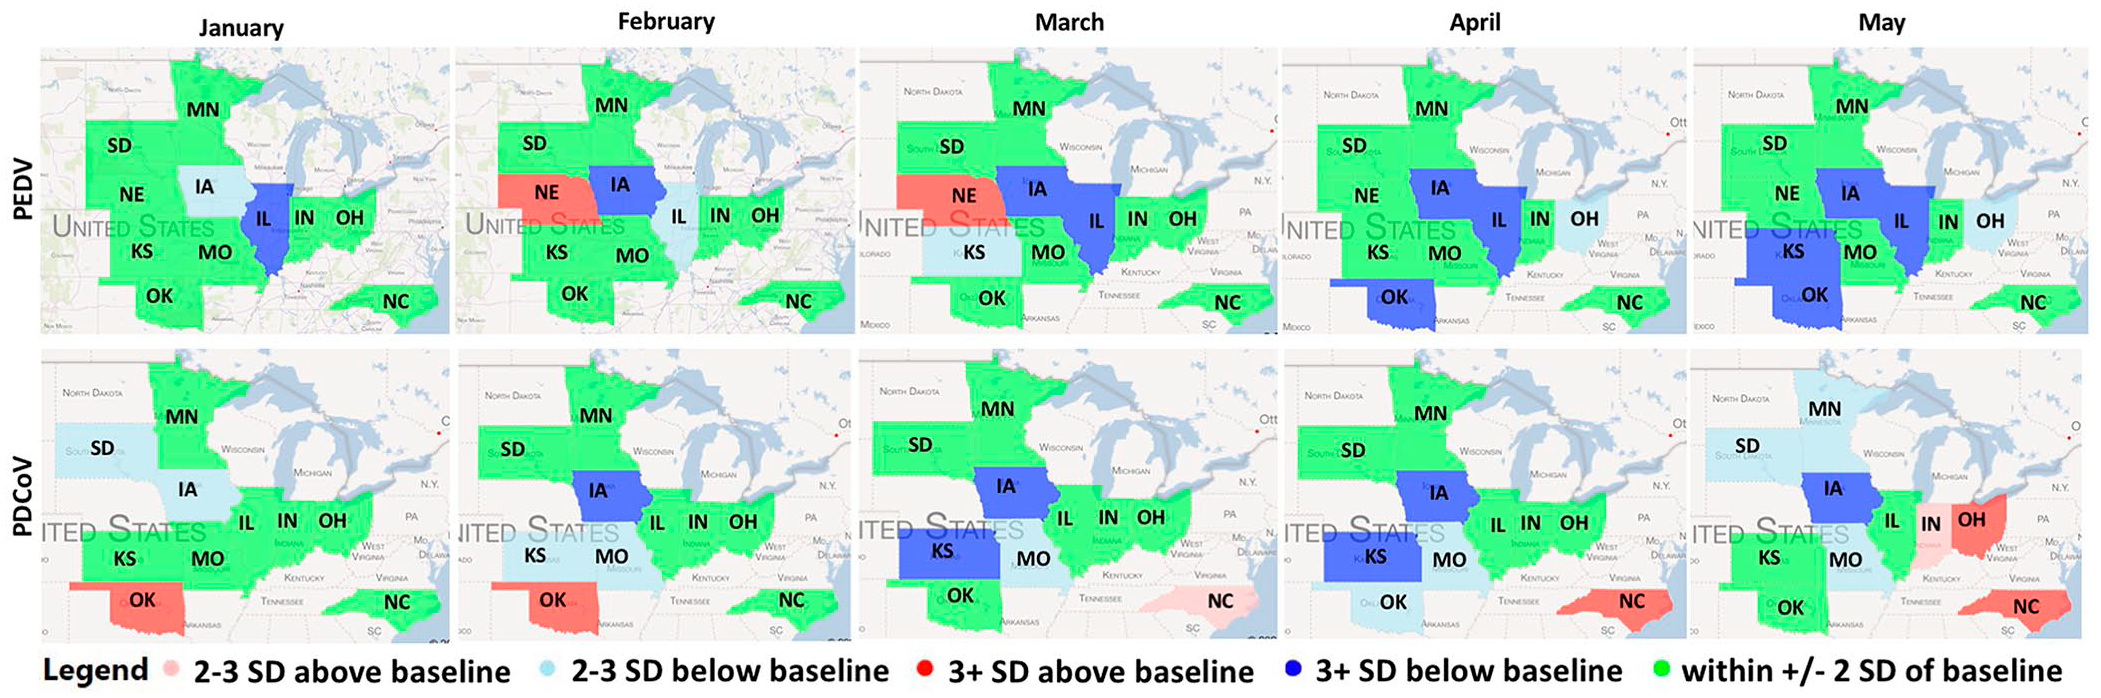
Porcine epidemic diarrhea virus (PEDV) and porcine deltaconavirus (PDCoV) state-level monitoring for January–May 2020. Each color-filled state represents the changes in SD from the predicted state-specific percentage of positive submissions baseline. Baselines were state-specific and constructed using at least 3 y of monthly historical results.
Discussion
We have presented here the macroepidemiologic aspects of enteric coronavirus detection at 4 U.S. swine-centric VDLs. To standardize the laboratory data integration process, we used SNOMED CT, LOINC, and 2 mechanisms (HL7 messaging and CSV transfer) to transfer data successfully from 4 swine-centric participating VDLs. Additionally, we applied overall and state-level monitoring capabilities to monitor veterinary laboratory data, and these capabilities continue to be used proactively to alert stakeholders to changes.
We found that as PEDV and PDCoV infections transitioned from an epidemic to an endemic pattern from 2014 to 2018, a repetitive pattern of enteric coronavirus detection became apparent, with the highest detection during winter. Lower detection of PEDV after 2014 agrees with the reporting of the lower incidence of PEDV during the second half of 2014 by others who attributed the lower incidence to the presence of “herd immunity” in the infected population, as well as increased and improved farm and feed biosecurity.11,18,23 The highest percentage of positive submissions during the winter from this VDL data work can be attributed to the ability of the virus to survive better outside the pig during colder temperatures.3,21 In addition, cold weather hinders the process of cleaning and disinfecting facilities, thus viable residual virus is more likely to remain present in facilities and transport vehicles. 11 Our higher detection of TGEV during colder months agrees with findings reported previously. 4
The ability to monitor veterinary laboratory submissions provides useful animal health data. 19 The applied capability to monitor and then predict the overall percentage of positive submissions for PEDV and PDCoV by a cyclic model informed changes from the expected baseline detection of these agents. PEDV at week 17 of 2020 and TGEV at week 9 of 2013 were outside the expected levels of detection. Both events were time unrelated but occurred as a result of increased detection in the wean-to-market age category. When test results cross the 95% CI boundaries of expected positives, these significant changes in the detection pattern deserve further investigation for the potential contributing reasons. As an example, the increased detection of TGEV in 2013 agrees with the presence of significant concern in the U.S. swine industry of TGEV infection in late finishing pigs. 28 At a state-specific level, the detection of PDCoV in OK, NC, and OH, and of PEDV in NE during 2020 above expected baselines were aligned with personal communications from practitioners in those regions of a field-perceived increased activity of those agents in those states at that time contributing to additional farm breaks.
The value of monitoring overall detection relies on quickly identifying changes and alerting stakeholders. The situation awareness informed by such monitoring can be used by veterinarians who can benchmark their data and the aggregated results to self-position as a contributor or to better deal with the threat caused by the change. PEDV epidemiologic studies have reported a significant association between cases co-occurring in space and time, with a higher proportion of positive farms observed in pig-dense areas. 1 Having state-specific information about changes in patterns of agent detection can help design and implement biocontainment practices. Biosecurity programs need to consider herd, premises, surrounding areas, and connection characteristics to be effective. 24
Our collated data revealed a decrease in detection of PEDV and PDCoV during summer, which may be attributed to lower virus survivability during warm weather. A decrease in the slope for the percentage of positive submissions may signal a lowering in the pressure of infection during and after spring. Implementation of new control and elimination programs may take advantage of this information by implementing herd closure practices and enhancing biosecurity and biocontainment procedures at this time.
Not surprisingly, oral fluid and feces were the samples submitted most commonly for enteric coronavirus testing. The use of these 2 specimens for enteric coronavirus testing is acceptable and recommended.2,33 We found that nursery and grow-finish animals were the age categories from which samples were most often submitted for testing, in part because of the practicability of collecting samples in these age categories and the utility for monitoring infection status.
We found that 31% of the submissions tested for enteric coronaviruses during 2020 had no information about age or farm type and were reported as an unknown age category. Efforts still need to be made to require submissions to capture age category information given that this is important information for epidemiologic investigation and studies. Improvement is achievable by making the farm type and age of animals sampled mandatory by the submitter on the submission forms for testing to be completed.
The introduction of PEDV in 2013 changed the approach to TGEV testing, with more tests being performed in years after PEDV emerged in the United States than during years prior. Epidemics of diarrhea not attributable to PEDV occurred in the second half of 2013, which resulted in more proactive testing for TGEV. A detection rate below what was expected for TGEV by the nature of clinical signs was observed during the second half of 2013. When a decrease in test positivity occurs for a known disease, it may suggest that a new disease agent is emerging in the population. 20 The potential unknown presence of PDCoV since August 2013, 25 which has a clinical presentation similar to TGEV, may have contributed to more TGEV testing requests. Tracking the higher number of TGEV testing requests with an increased proportion of negative results with statistical models, such as the one we described here, has the potential to signal and alert for the possible activity of another agent with a clinical presentation similar to TGEV. This example reinforces the importance of differentiating unknown agent activity from known factors affecting the usual pattern of testing over time.
Another reason for the increased numbers of tests performed for enteric coronaviruses in 2017 and 2018 was the availability and routine implementation by participating VDLs of a multiplex RT-PCR5,34 to test simultaneously for all 3 viruses. Such a data “step change,” derived from changes in laboratory procedures, does not indicate a re-emergence or emergence of another pathogen and should be taken into consideration as the first step during any investigation process. A useful insight, perhaps, is that the very low proportion of submissions with positive TGEV test results suggests a low level of circulation of TGEV among the herds submitting samples for testing at participating VDLs. The very low detection of TGEV also suggests that this agent may be a candidate for eradication from the United States.
Although the example we used to describe the process and value for the standardization, integration, and monitoring of anonymized laboratory data within and between VDLs used porcine enteric coronavirus data, these methods can be replicated or adapted to other animal species, infectious agents, or analytes tested for by VDLs. VDL stakeholders and regulatory officials can take advantage of such data integration capability to acquire knowledge of megatrends in agent detection, monitor detection techniques, and make benchmarking comparisons. Additionally, although samples had been submitted for testing at 4 different VDLs, our reporting of aggregated anonymized test results occurred on a single integrated platform. Our procedures for data collation and analysis have flexibility for continuous improvement of quality of information and analytical capability to promptly provide a meaningful and usable format of collated data.
There are several caveats to be aware of when aggregating laboratory data. Test results represent findings only on the samples submitted for testing and do not represent disease occurrence, prevalence, or incidence in a specific region, given that information is passively collected at the VDLs. Laboratory data should not be used to infer incidence or prevalence with any confidence because populations sampled are not defined nor is sampling random. VDL data are generally regarded only as the frequency of detection, and are driven by the number of submissions or tests performed, the context in which sampling and sample types are obtained, the purpose of submission, the economics of a particular disease, and the cost of testing. Detection of an analyte, particularly if endemic or a background level of an analyte, does not equate to disease causation. Disease status is usually conferred by attending veterinarians, who consider history, clinical signs, signalment, epidemiology, and laboratory findings (including pathology examinations) to infer the presence of one or more disease processes and etiologies. Currently, there is no standardized or widely adopted terminology and format to report inter-VDL disease diagnosis findings. Reported elsewhere in this journal issue is a standardization and reporting scheme being prototyped by the application of these tools for aggregation of disease diagnostic data. 7
Supplemental Material
sj-pdf-1-vdi-10.1177_10406387211002163 – Supplemental material for Data standardization implementation and applications within and among diagnostic laboratories: integrating and monitoring enteric coronaviruses
Supplemental material, sj-pdf-1-vdi-10.1177_10406387211002163 for Data standardization implementation and applications within and among diagnostic laboratories: integrating and monitoring enteric coronaviruses by Giovani Trevisan, Leticia C. M. Linhares, Kent J. Schwartz, Eric R. Burrough, Edison de S. Magalhães, Bret Crim, Poonam Dubey, Rodger G. Main, Phillip Gauger, Mary Thurn, Paulo T. F. Lages, Cesar A. Corzo, Jerry Torrison, Jamie Henningson, Eric Herrman, Rob McGaughey, Giselle Cino, Jon Greseth, Travis Clement, Jane Christopher-Hennings and Daniel C. L. Linhares in Journal of Veterinary Diagnostic Investigation
Footnotes
Acknowledgements
We thank VDL clients for submitting samples for testing. We also thank current and former SDRS advisory group members for their valuable input and volunteered time: Drs. Clayton Johnson, Emily Byers, Hans Rotto, Jeremy Pittman, Mark Schwartz, Paul Yeske, Pete Thomas, Rebecca Robbins, Tara Donovan, Matthew Turner, Deborah Murray, Scott Dee, Melissa Hensch, Scanlon Daniels, Brigitte Mason, and Randy Jones.
Availability of data and materials
Restrictions apply to the availability of additional data, given VDL confidentiality, and are not publicly available.
Declaration of conflicting interests
The authors declared no potential conflicts of interest with respect to the research, authorship, and/or publication of this article.
Funding
This project was co-funded by the American Association of Swine Veterinarians Foundation award 018743-00001, by the Swine Health Information Center (SHIC) awards 17-210 and 19-155 SHIC, and by the USDA National Institute of Food and Agriculture Animal Health and Disease Research Capacity Funds project 1017372 to D.C.L. Linhares.
Supplementary material
Supplementary material for this article is available online.
References
Supplementary Material
Please find the following supplemental material available below.
For Open Access articles published under a Creative Commons License, all supplemental material carries the same license as the article it is associated with.
For non-Open Access articles published, all supplemental material carries a non-exclusive license, and permission requests for re-use of supplemental material or any part of supplemental material shall be sent directly to the copyright owner as specified in the copyright notice associated with the article.