
Abstract
The Vet Fluidlab 1 (Anvajo), a new urine sediment analyzer for use in veterinary medicine, uses holographic microscopy to detect urine sediment particles in uncentrifuged urine. We compared the performance of the Fluidlab to manual microscopy and Idexx SediVue analysis for the detection of RBC, WBC, epithelial cells (EC), struvite crystals (STR), all crystals (CRY), and casts (CST) in urine samples from cats and dogs. The performance of the Fluidlab for the detection of bacteria was compared to bacterial culture. We included 624 urine samples from feline (238; 38%) and canine (386; 62%) patients; 227 samples had been submitted for bacterial culturing. The sensitivity of the Fluidlab compared to manual microscopy was 92.1% for RBC, 90.1% for WBC, 87.5% for EC, 67.6% for STR, 53.9% for CRY, and 12.5% for CST. Specificity was >97% for STR and CST, 90.0% for CRY, 78.4% for WBC, 59.4% for EC, and 55.1% for RBC. Sensitivities and specificities of the Fluidlab for analytes compared to manual microscopy were found to be similar to those obtained by the Fluidlab compared to SediVue analysis. Miscellaneous materials (e.g., lipid droplets, sperm, cell detritus) seemed to be the main reason for the high false-positive rate in RBC and EC classification by the Fluidlab. Detection of bacteria by the Fluidlab compared to bacterial culture had a sensitivity of 89.8% and a specificity of 72.3%. The performance of the Fluidlab is acceptable for the detection of WBC and bacteria; sensitivity for the detection of CRY and CST, and specificity for the detection of RBC and EC, require improvement.
Urinalysis is an important laboratory examination used in the diagnosis of diseases of multiple organ systems in cats and dogs. A complete urinalysis includes physical and biochemical analysis of the urine and examination of the urine sediment to detect formed elements such as cells, crystals, casts, or bacteria.4,8 Examination of the urine sediment via manual microscopy is still considered the gold standard,8,11 although preanalytical preparation steps can lead to significant variations in the results of the microscopic examination. Centrifugation, which has been found to cause an unpredictable loss of cells, 10 and decanting of the supernatant followed by mixing of the urine sediment into the residual volume, are additional factors that can lead to discrepancies in results.5,25 Even if the preanalytical influences are minimized by introducing a standardized protocol in a laboratory, the interpretation of the urine sediment by different observers leads to variations.16,24 Automatic urine sediment analysis is a less time-consuming and more cost-effective method, 5 especially in laboratories with high-sample throughput. The turnaround time for each sample is lower,3,5,26 less laboratory staff is needed, 18 and the preanalytical preparation steps are standardized.3,12,26 Precision in automated analyzers is higher than precision in manual microscopy.9,12,26
The first automated urine sediment analyzer on the veterinary market was the SediVue Dx (Idexx). Two studies compared the performance of this device to manual bright-field microscopy for the detection of cells, struvite crystals (STR), and calcium oxalate dihydrate crystals (CaOxDi) in cats and dogs, and for the detection of casts (CST) in dogs.12,22 For RBC, WBC, STR, and CaOxDi, the sensitivities and specificities of the SediVue compared to manual microscopy ranged from moderate (70.0–84.9%) to excellent (95–100%), and the performance of the device was considered acceptable. 12 The performance for squamous (sqEPI) and non-squamous epithelial (nsEPI) cells was unsatisfactory. 12 The SediVue had excellent (95–100%) specificity for the detection of CST in dogs, but low sensitivity. 22 A third study compared the SediVue performance for the detection of bacteria in cat urine to bacterial culture. 14 When the SediVue and the human observer agreed on the presence or absence of bacteriuria, sensitivity and specificity were high; if agreement was not reached, then the results were not reliable. 14 We did not find publications for evaluations of other urine sediment analyzers on the veterinary market (Vetscan SA sediment analyzer, Abaxis; BW-2000 VET, Bioway Biological Technology) in a literature search in PubMed in June 2021.
A small, automated urine sediment analyzer for veterinary medicine, the Vet Fluidlab 1 (Anvajo), was introduced in May 2021. For particle analysis, it uses the technique of holographic microscopy, which has not been used before in urine sediment analyzers in human or veterinary medicine. Our objective was to compare the performance of the Vet Fluidlab 1 (Fluidlab) to manual microscopy and to SediVue analysis for urine sediment analysis of cats and dogs. Categories for which calculations were conducted were RBC, WBC, epithelial cells (EC), STR, all crystals (CRY), CST, and bacteria.
Material and methods
Study overview
Upon arrival at the laboratory, a routine urinalysis was performed for each urine sample, including physical examination of the urine (determination of urine color, urine transparency, urine specific gravity [USG]), a chemical test strip analysis, and a urine sediment examination with the SediVue. Each sample was then examined simultaneously by the Fluidlab 3 consecutive times and by manual microscopy. Fluidlab analysis and manual microscopy were performed by the same first observer within 2 h of SediVue analysis to prevent alteration of the urine sediment over time. If requested by the attending clinician, the sample was submitted for aerobic bacterial culture after completing the previous steps.
Urine specimens
We included in our study 624 urine samples that were submitted to the laboratory at the Clinic of Small Animal Medicine of Ludwig Maximilian University (LMU; Munich, Germany). All specimens were collected between July 2020 and June 2021 and obtained from feline (n = 238) and canine (n = 386) patients of the Clinic of Small Animal Medicine or the Clinic for Small Animal Surgery and Reproduction of LMU. Urine samples from cats and dogs of all ages, sexes, breeds, and health states were admitted to the study. We acquired 91 samples from female cats, of which 69 were spayed, and 145 samples from male cats, of which 101 were castrated; the sex of 2 cats was unknown. We acquired 84 samples from castrated male dogs, 92 samples from intact male dogs, 101 samples from spayed bitches, and 109 samples from bitches. Included samples were obtained by cystocentesis, catheterization, free-catch, or puncture of the subcutaneous shunting port of a ureteral bypass system (Table 1). Repeat samples from the same patient were allowed if the samples were obtained and examined on different days. The urine samples were not refrigerated. For inclusion in our study, a residual volume of ≥600 µL after routine urinalysis was necessary. The use of the urine samples was approved by the ethics committee of the veterinary faculty of LMU Munich (reference 200-08-02-2020).
Number of urine samples by species and acquisition method.
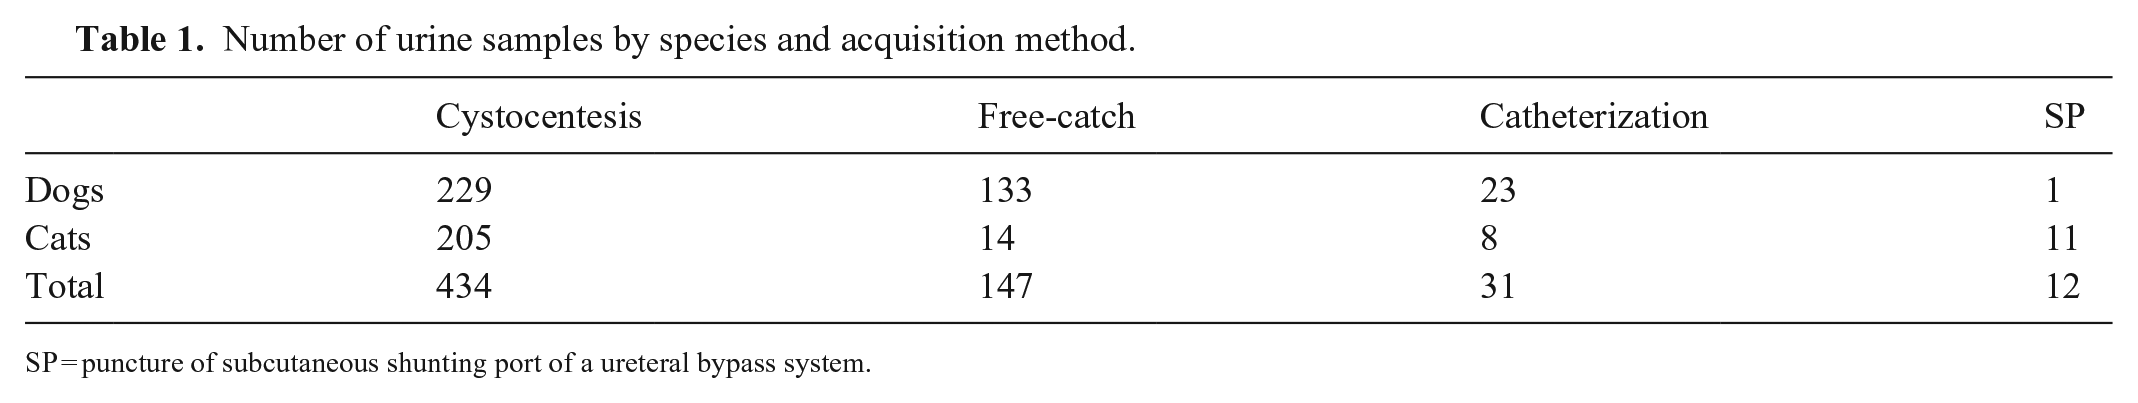
SP = puncture of subcutaneous shunting port of a ureteral bypass system.
Routine urinalysis
The initial urinalysis was performed by trained laboratory staff. The examination included assessment of urine color and transparency, refractometric measurement of USG, a chemical test strip analysis, and examination of the urine sediment. For the determination of USG, a 2-scale refractometer (RUR5-ATC; refraktometer-eshop.eu) was used. The chemical analysis was performed using UA strips (Idexx) read with an automated test strip reader (VetLab UA; Idexx).
In examination of the urine sediment with the SediVue Dx urine sediment analyzer (software v.4.2.33.654; Idexx), 165 µL of uncentrifuged, well-mixed urine were pipetted into a single-use cartridge. After starting the analysis, the sample was centrifuged for 30 s on low speed, and 70 high-resolution digital images equaling 45 hpfs were taken. The generated images are analyzed by a convolutional neural network and the identified elements classified. Categories provided by the SediVue are RBC, WBC, nsEPI, sqEPI, hyaline casts (hCST), non-hyaline casts (nhCST), STR, CaOxDi, ammonium biurate crystals, bilirubin crystals, unclassified crystals, cocci, and rods. The SediVue provides semiquantitative results using the units “per high power fields” (hpf) and “per low power field” (lpf). Results for bacteria are given as “present,” “none detected,” or “suspected.” Eleven SediVue images are provided to the observer for review. The images were reviewed manually by the first observer after the completion of manual microscopy, and the presence of mislabeled and miscellaneous elements (e.g., sperm, parasites, lipid droplets) was noted, but for calculation of sensitivity and specificity, only the automatically generated data were used.
Urine sediment analysis using the Fluidlab
For the Fluidlab analysis, 20 µL of the uncentrifuged, well-mixed urine were pipetted into a proprietary single-use sample carrier that generates a thin layer of fluid. With the technology of holographic microscopy, an image is generated by sending a light beam through the sample. The light is bent by the inner and outer textures of the elements present, which are then classified by the device. The analyzed area contains 1 µL of urine. Detected elements are categorized as RBC, WBC, sqEPI, nsEPI, hCST, nhCST, STR, CaOxDi, and unclassified crystals. The presence of bacteria is flagged by the device if suspected. Depending on the freely adjustable settings, the device provides the results in the units “per hpf” and “per lpf” or “per µL.” The results are shown in intervals that can also be freely adjusted by the user. The measurement was repeated 3 times for each urine sample to determine the repeatability of the results. Samples were run with software v.21.20.03. The Fluidlab provided all results in numbers per µL.
Urine sediment analysis using manual microscopy
If possible, the formed elements in the urine were analyzed both in uncentrifuged samples and in centrifuged sediments. In 466 of 624 samples, both analyses were carried out. Given the high element counts in the native sample, urine centrifugation was not performed in 157 samples. For one sample, examination of the uncentrifuged urine was not performed.
We diluted 29 samples with saline solution because the initial density of formed elements was too high for analysis. In these cases, we aimed for a dilution of 1:10 in all 3 examination methods (SediVue, Fluidlab, and manual microscopy) for better comparison. In 13 of 29 diluted urine specimens, this target was reached. For 16 specimens, dilution was higher or lower (1:2, 1:3, 1:6, 1:7, 1:20, 1:100) or the dilution factors of the 3 examination methods varied.
All samples were examined using counting chambers (FastRead 102; Kova International) and bright-field microscopy (BX43; Olympus). Each counting chamber has a volume of 10 µL and an integrated grid (10 large squares with 16 subsquares each) containing 1 µL of fluid. The examinations were carried out using a 20× objective, and all elements in the complete grid were counted and categorized by a trained first observer who was blinded to the results of the Fluidlab. Categories for manual microscopy were RBC, WBC, nsEPI, sqEPI, hCST, nhCST, bacteria (cocci and rods), STR, CaOxDi, ammonium biurate crystals, bilirubin crystals, amorphous crystals, and unclassified crystals. Lipid droplets and miscellaneous elements (e.g., sperm, cell detritus, mucus, or other notable findings) were noted if present. Bacteria were specified as “present,” “none detected,” or “suspected.”
For the sediment, 500 µL of well-mixed urine were centrifuged in a 1.5-mL Eppendorf tube at 630 × g for 5 min (Universal 320 R centrifuge; Hettich). After centrifugation, 450 µL of the supernatant were removed with a pipette and the urine sediment resuspended in the remaining fluid by gentle tapping of the tube. The concentrated fluid was immediately analyzed in the counting chamber. The number of elements per µL was calculated for each category using the formulas provided by the counting chamber manual for all diluted or concentrated samples.
All manual microscopic examinations were performed by the same first observer, who took 10 images covering the complete counting chamber grid using a microscope camera (Moticam S6; Motic). The pictures were assembled into a high-resolution image (Image composite editor; Microsoft) so that the complete grid could be analyzed by a second observer who was blinded to all previous results. In case consensus between the first and second observer could not be reached, a third observer was consulted to review the images and reach a majority decision.
Bacterial culture
Of 624 urine specimens, 227 (83 samples from cats, 144 samples from dogs) were submitted for aerobic bacterial culture. The samples were refrigerated after urinalysis and were sent to the Institute of Infectious Diseases and Zoonoses, Faculty of Veterinary Medicine, LMU, on the same campus within 24 h. Significant bacterial growth was defined as ≥103 cfu/mL for all urine samples.
Statistical analysis
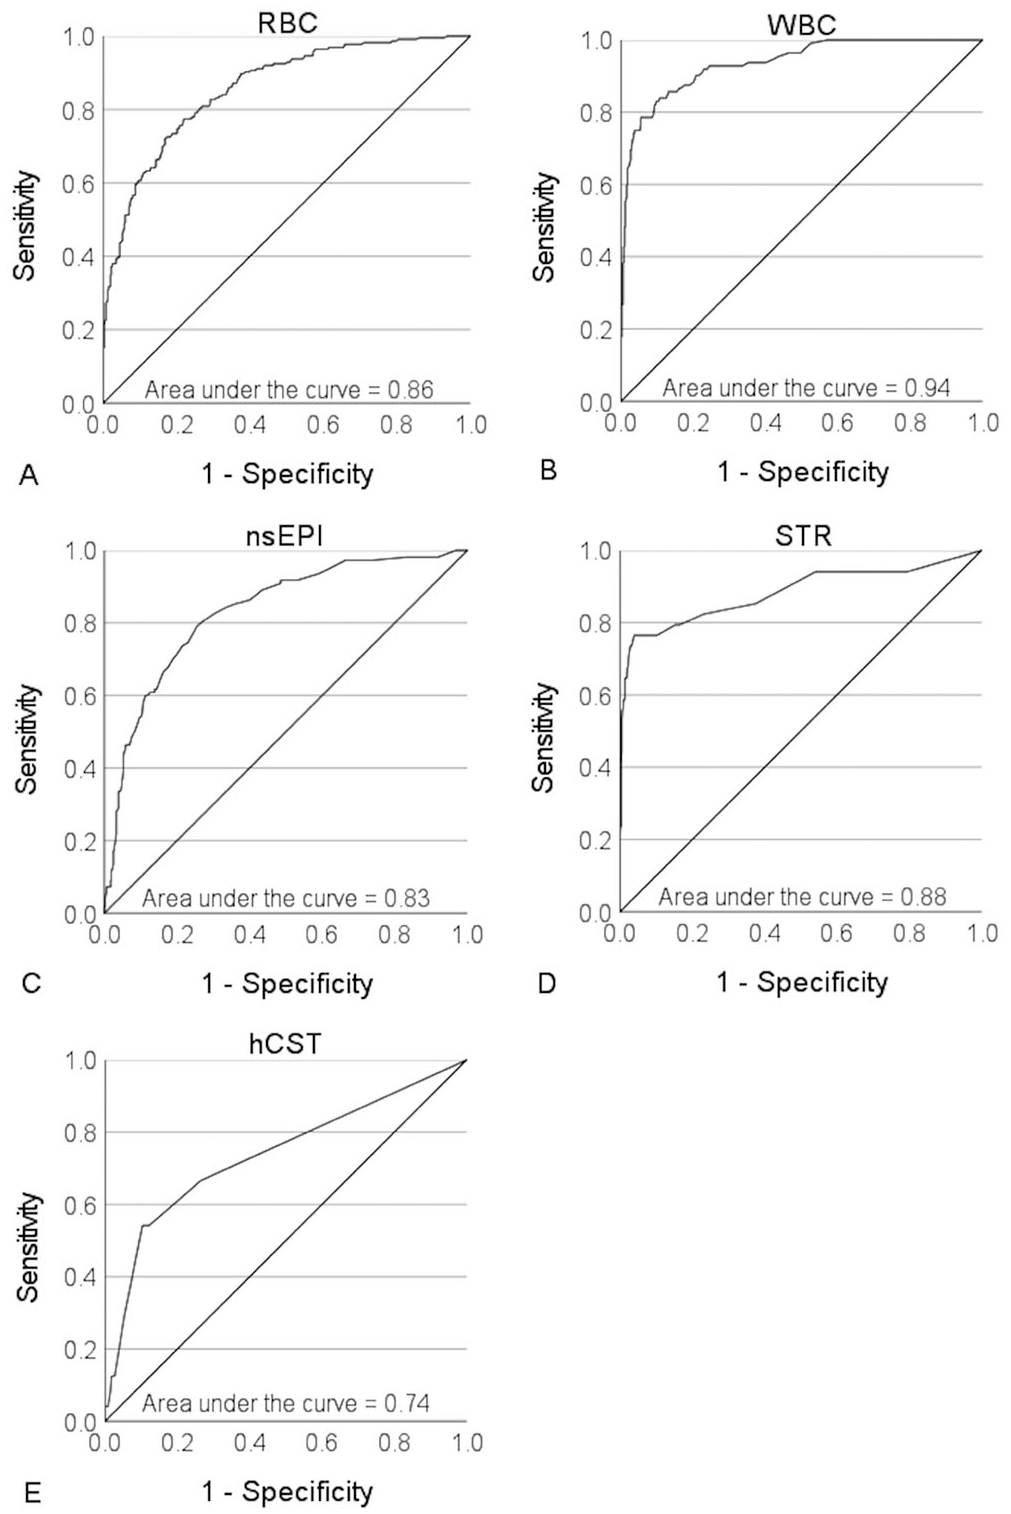
Data collection and statistical analysis were performed using Excel 2016 (Microsoft), SPSS Statistics 28 (IBM), and Prism 9.2.0 (GraphPad). Repeatability of the Fluidlab was calculated for RBC and WBC based on the 3 Fluidlab measurements that were conducted for all urine samples. Receiver operating characteristic curves (ROC curves) were generated for the Fluidlab in comparison to manual microscopy for RBC, WBC, nsEPI, STR, and hCST.
Sensitivity and specificity were calculated for the detection of formed urine particles by the Fluidlab compared to manual microscopy and SediVue analysis. For those calculations, superordinate categories for formed urine particles were generated. For all 3 urine sediment examination methods, nsEPI and sqEPI were summarized to the category EC, hCST and nhCST to the category CST, cocci and rods to the category bacteria, and all crystal types to the category CRY. A positive result in one of the subcategories was considered a positive result for the superordinate category (e.g., if a urine sample was positive for nsEPI and negative for sqEPI, it was overall positive for EC).
Sensitivity and specificity were calculated and scaled as excellent (95.0–100%), good (85.0–94.9%), moderate (70.0–84.9%), fair (60.0–69.9%), or poor (≤59.9%) using the same scale as the 2 SediVue studies mentioned earlier.12,22
The Cohen kappa coefficient κ was calculated to determine the level of qualitative agreement between manual microscopy and Fluidlab analysis and between SediVue and Fluidlab analysis. κ demonstrates to what degree 2 methods agree in classifying a urine sample as “positive” (above cutoff) or “negative” (below cutoff) for a specific urine particle based on their respective cutoff values; it does not provide information regarding the agreement of particle counts. κ was scaled as almost perfect (0.81–1.00), substantial (0.61–0.80), moderate (0.41–0.60), fair (0.21–0.40), slight (0.00–0.20), or poor (<0.00). 13 Sensitivity, specificity, and κ were calculated for the categories RBC, WBC, EC, STR, CRY, CST, and bacteria.
Bland–Altman plots and Deming regressions were generated for the Fluidlab in comparison to manual microscopy for RBC and WBC. In contrast to κ, the Bland–Altman plots and Deming regressions compare the particle counts of both methods directly and give quantitative results.
Cutoff values
Cutoff values for SediVue analysis were selected based on 2 performance studies,12,22 and cutoff values for manual microscopy were selected based on 2 studies in human medicine with a study design comparable to ours (Table 2).17,27 Samples were defined as “bacteria detected” in manual microscopy and SediVue analysis if bacteria were present or suspected and “bacteria negative” if bacteria were not identified.
Selected cutoff values for manual microscopy, SediVue analysis, and Fluidlab analysis.
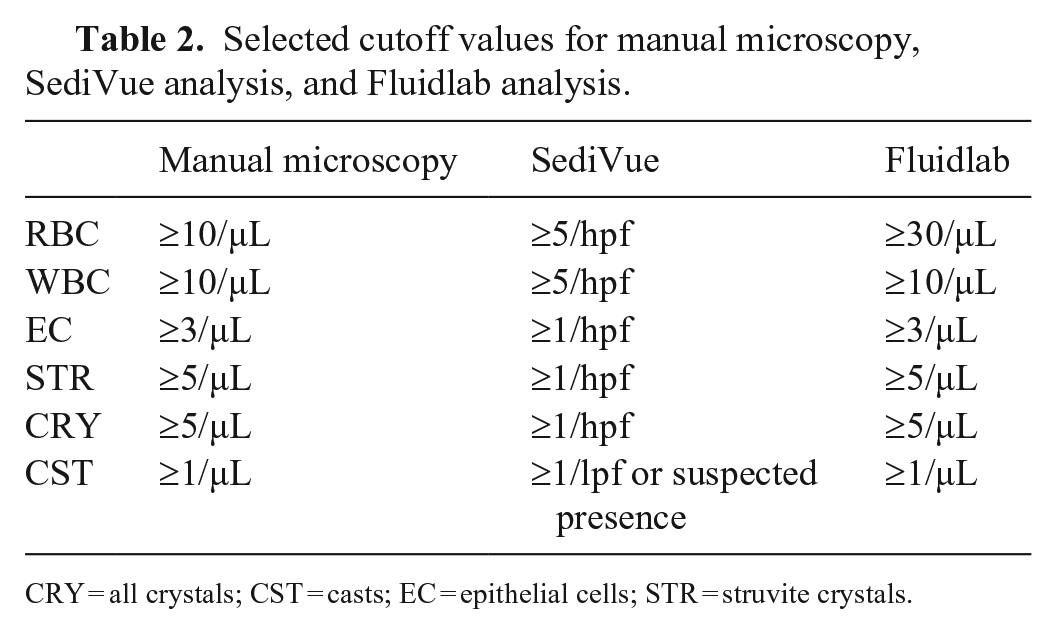
CRY = all crystals; CST = casts; EC = epithelial cells; STR = struvite crystals.
The cutoff values for the Fluidlab were selected based on the ROC analysis. Samples with bacteria suspected in Fluidlab analysis were defined as “bacteria detected” and samples with “bacteria none to rare” as “bacteria negative.”
Results
Repeatability
Not all of the triplicate measurements of the Fluidlab yielded comparable results: in 42 of 624 (6.73%) samples, 1 or 2 of 3 measurements had no cells, whereas the matched mea-surement(s) had high cell numbers; 44 of 1,872 (2.3%) single measurements were affected in total. Given that this malfunction distorts the regular repeatability of the Fluidlab, the 42 affected samples were excluded from the calculations of repeatability.
The CVs for RBC were calculated for 235 samples with ≥30 and ≤250 RBC/µL and 119 samples with RBC >250/µL. For WBC, the CV was calculated for 180 samples with ≥10 and ≤500 WBC/µL and for 14 samples with WBC >500/µL. Samples with very low cell counts were excluded because variation tends to be high but is clinically less relevant.
The within-run CV for RBC was 15.5% at a mean concentration of 89.3 RBC/µL for samples with RBC ≥30 and ≤250/µL. The CV dropped to 11.8% at a mean concentration of 1,130 RBC/µL for samples with RBC >250/µL. The within-run CV for WBC was 17.1% at a mean concentration of 66.1 WBC/µL for samples with WBC ≥10 and ≤500 WBC/µL. The CV dropped to 6.36% at a mean concentration of 1,070 WBC/µL for samples with WBC >500/µL. All CVs were considered acceptable.
Urine samples positive for formed elements by different methods
For all further calculations and comparisons, the results from the microscopic examination of the 623 uncentrifuged urine samples were used, given that centrifugation did not provide an advantage over the examination of the uncentrifuged urine in our study. Although a standardized protocol was followed to concentrate the sediment 10-fold, unpredictable changes with increased and decreased cell counts were observed for RBC and WBC after centrifugation. The fraction of samples that was above the threshold (Table 2) and therefore considered positive was only marginally higher in the centrifuged urine for RBC and WBC, but lower for EC, STR, CRY, and CST (Table 3). For one sample, microscopic examination was not performed, and that sample was excluded for all calculations regarding manual microscopy. Because of overfilled images, the SediVue did not generate results for 7 samples, which were excluded for all calculations regarding SediVue analysis.
Number of urine samples positive for formed urine particles based on the cutoff values in Table 2 in 466 urine samples examined both uncentrifuged and centrifuged by manual microscopy.
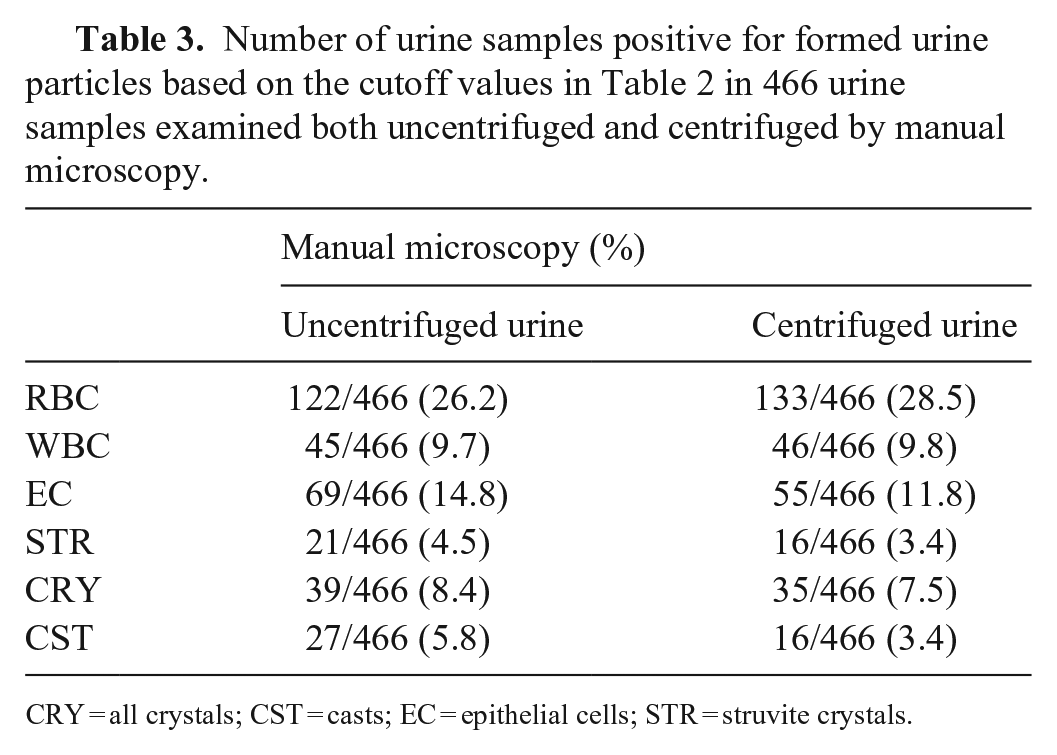
CRY = all crystals; CST = casts; EC = epithelial cells; STR = struvite crystals.
Based on the cutoff values in Table 2, the proportion of samples positive for RBC, WBC, EC, and CRY was significantly higher when the urine was analyzed with the Fluidlab compared to both manual microscopy and SediVue analyses (McNemar test, significance level p < 0.05), and significantly lower for CST. These differences are reflected in the sensitivities and specificities calculated for the respective formed urine particles. The Fluidlab generated many false-positive results for RBC and EC (low specificity), and many false-negative results for CST (low sensitivity). The SediVue classified significantly more samples positive for WBC and EC than did manual microscopy, but no significant difference was found for RBC and CST (Table 4).
Number of urine samples positive for formed urine particles in manual microscopy (uncentrifuged), SediVue analysis, and Fluidlab analysis based on the cutoff values in Table 2.
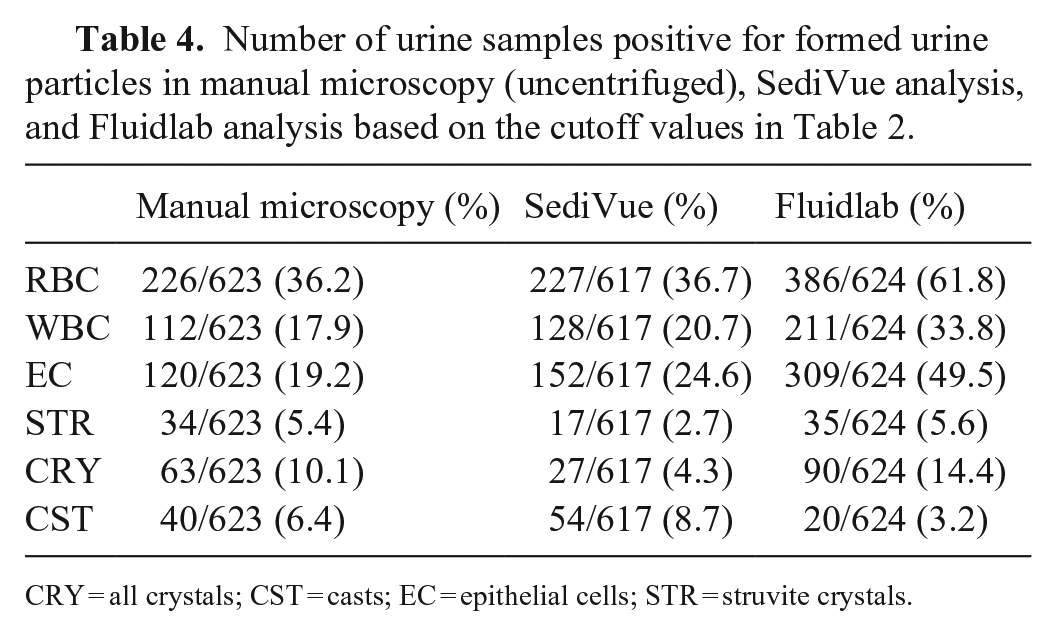
CRY = all crystals; CST = casts; EC = epithelial cells; STR = struvite crystals.
ROC curves
To compare the performance of the Fluidlab to manual microscopy for detection of the various formed elements, ROC curves were generated for RBC (Fig. 1A), WBC (Fig. 1B), nsEPI (Fig. 1C), STR (Fig. 1D), and hCST (Fig. 1E). The cutoff values for the Fluidlab in Table 2 were chosen based on the ROC analysis. Our aim was to select cutoff values with high sensitivity to keep the false-negative rate low. A decrease in specificity was tolerated. The performance for WBC was best, followed by RBC, STR, nsEPI, and hCST.
Receiver operating characteristic curves for the detection of
Detection of formed elements by the Fluidlab compared to manual microscopy and SediVue analysis
The ability of the Fluidlab to detect an active urine sample (i.e., a sample positive for any one of the formed urine particles RBC, WBC, EC, STR, CRY, or CST), or to detect a specific category of elements, was compared both to the results of manual microscopy (Table 5) and to the SediVue (Table 6) based on the cutoff values in Table 2. Using manual microscopy, 345 of 623 (55.3%) urine samples were positive for at least 1 category of formed elements, and 329 of 617 (53.3%) in SediVue analysis. The difference in the number of positive samples was not significant (p > 0.05).
Sensitivity, specificity, kappa κ, positive predictive value (PPV), and negative predictive value (NPV) of the Fluidlab for the detection of formed urine particles compared to manual microscopy based on the cutoff values in Table 2.
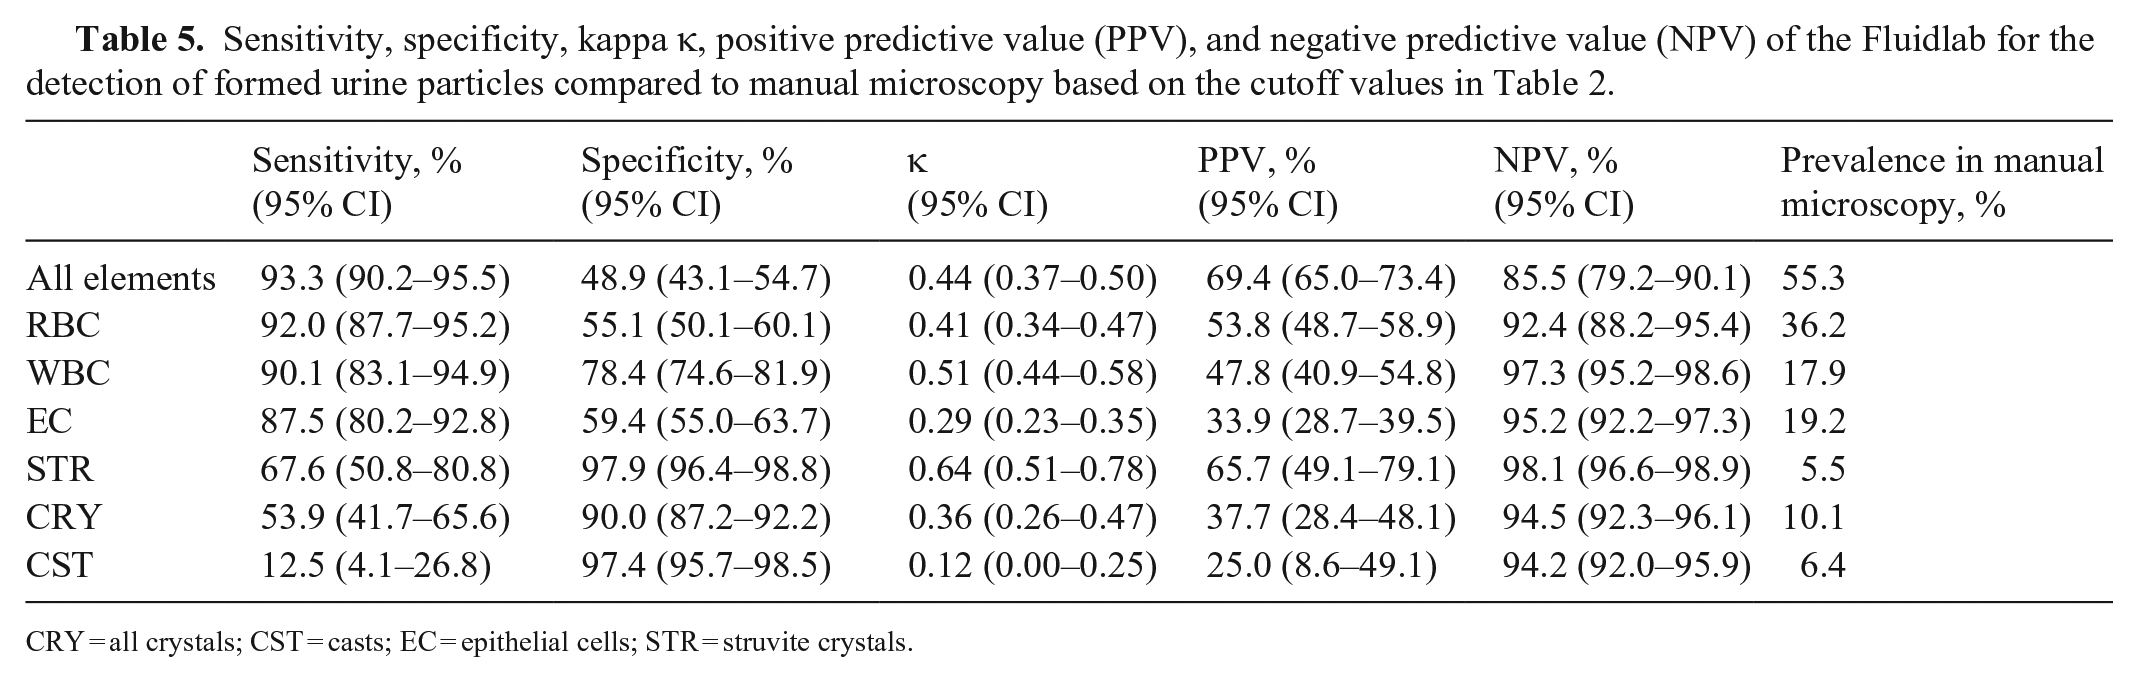
CRY = all crystals; CST = casts; EC = epithelial cells; STR = struvite crystals.
Sensitivity, specificity, kappa κ, positive predictive value (PPV), and negative predictive value (NPV) of the Fluidlab for the detection of formed urine particles compared to SediVue analysis based on the cutoff values in Table 2.
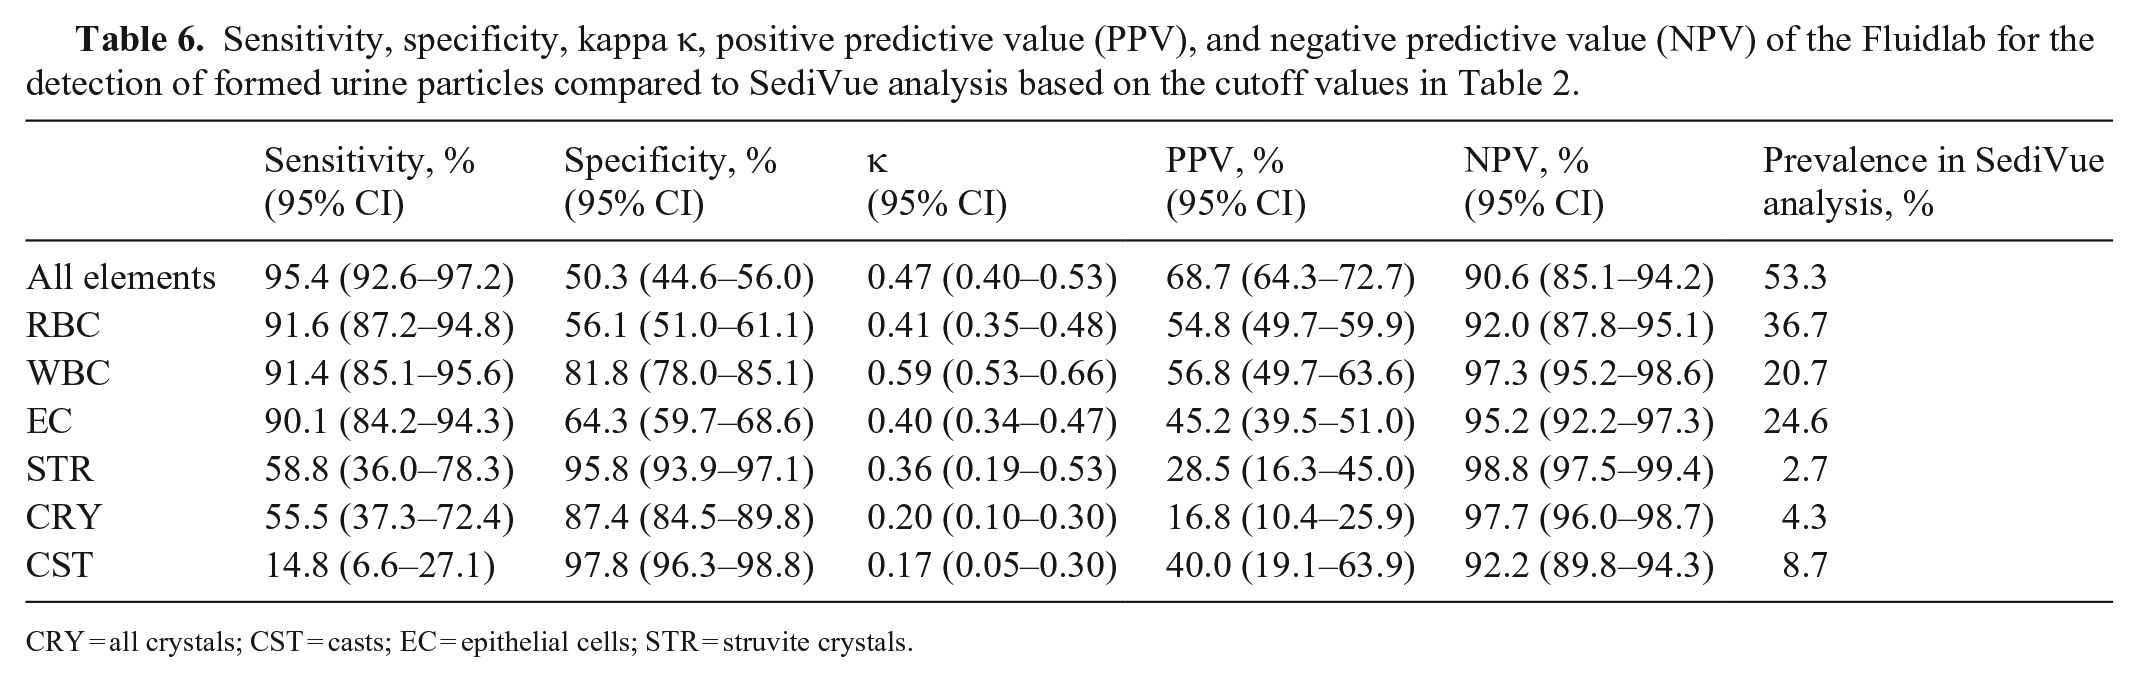
CRY = all crystals; CST = casts; EC = epithelial cells; STR = struvite crystals.
Based on the cutoff values in Table 2, sensitivity of the Fluidlab compared to manual microscopy was good for the detection of an active urine sample, RBC, WBC, and EC; fair for STR; and poor for CRY and CST (Table 5). Specificity was excellent for the detection of STR and CST, good for CRY, moderate for WBC, and poor for RBC, EC, and an active sample. Categories of the sensitivities and specificities were similar for most elements when comparing Fluidlab to SediVue analysis (Table 6). Sensitivity dropped from fair to poor for the detection of STR, but the CI was wide, and specificity increased from poor to fair for the detection of EC.
Based on the κ and the cutoff values in Table 2, qualitative agreement between manual microscopy and Fluidlab analysis was substantial for the detection of STR; moderate for WBC, RBC, and active sediment; fair for CRY and EC; and slight for CST (Table 5). Qualitative agreement between SediVue analysis and Fluidlab analysis was similar for most elements but dropped from substantial to fair for STR and from fair to slight for CRY (Table 6). Twenty-five of 34 samples were negative for STR in SediVue analysis but positive in manual microscopy. In 23 of those 25 samples, no STR were detected in the manual review of the SediVue images. For those samples, it must be assumed that STR developed in vitro given that the SediVue analysis was performed before manual microscopy and Fluidlab analysis. Thirteen of those 23 samples were also positive for STR during the Fluidlab analysis, which was performed simultaneously to manual microscopy.
Detection of bacteria by sediment analysis compared to bacterial culture
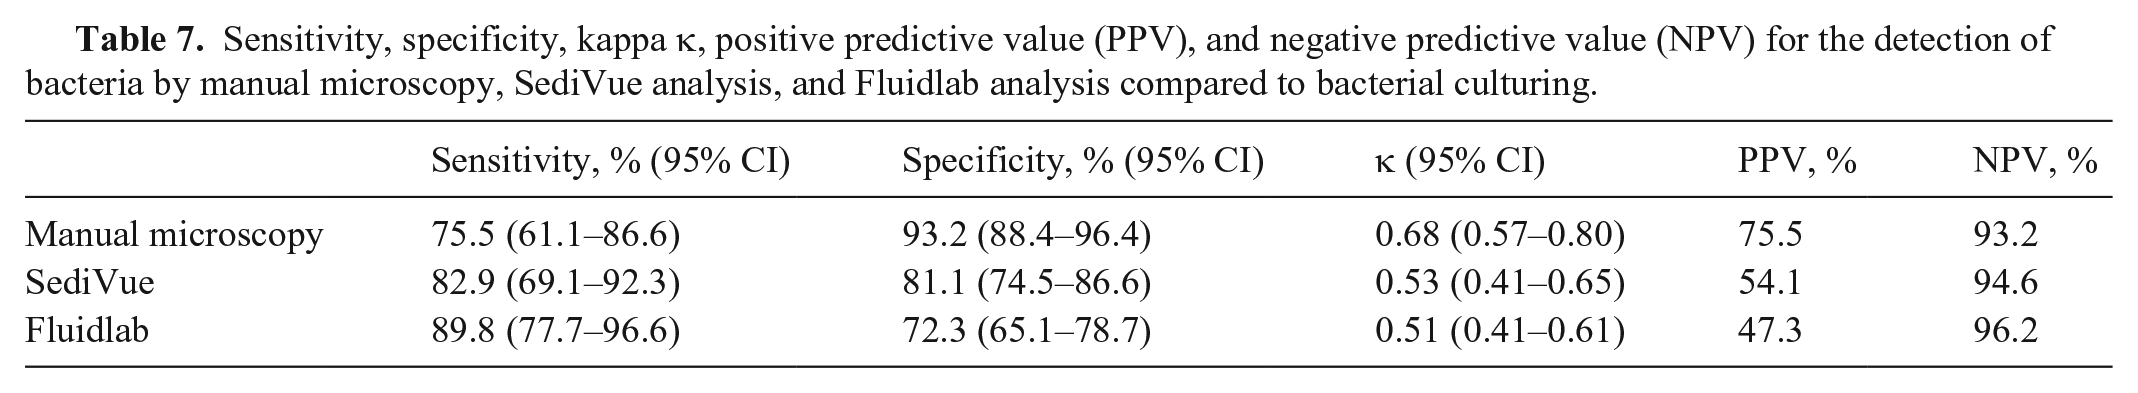
The detection of bacteria by manual microscopy, SediVue analysis, and Fluidlab analysis was compared to bacterial culture (Table 7). The level of qualitative agreement between methods was substantial for manual microscopy and moderate for SediVue and Fluidlab analysis. Sensitivity was good for the detection of bacteria by the Fluidlab and moderate for manual microscopy and SediVue analysis. Specificity was good for the detection of bacteria by manual microscopy and moderate for SediVue and Fluidlab analysis. The negative predictive value (NPV) for the detection of bacteria was high for all methods, hence a negative result for bacteria is highly predictive of a negative bacterial culture. The positive predictive value (PPV) for the detection of bacteria by manual microscopy was high, but low for SediVue and Fluidlab analysis, hence a positive result from these analyzers cannot be trusted and requires follow up with bacterial culture to be confident of results.
Sensitivity, specificity, kappa κ, positive predictive value (PPV), and negative predictive value (NPV) for the detection of bacteria by manual microscopy, SediVue analysis, and Fluidlab analysis compared to bacterial culturing.
Because bacteriuria is often associated with pyuria and vice versa, the relation between both was investigated to determine if the presence or lack of pyuria is a predictor for the outcome of bacterial culturing. The NPVs were high for both manual microscopy and Fluidlab analysis, but the PPVs were low for both methods (Table 8). Therefore, a negative result for pyuria (WBC <10/µL) makes urinary tract infection (UTI) unlikely in both methods, whereas a positive result for pyuria (WBC ≥10/µL) cannot be trusted to confirm UTI in both methods and requires follow up with bacterial culture.
Leukocyte counts and their positive predictive value (PPV) and negative predictive value (NPV) in manual microscopy (Mic) and Fluidlab analysis (Fl) compared to the results of bacterial culture.
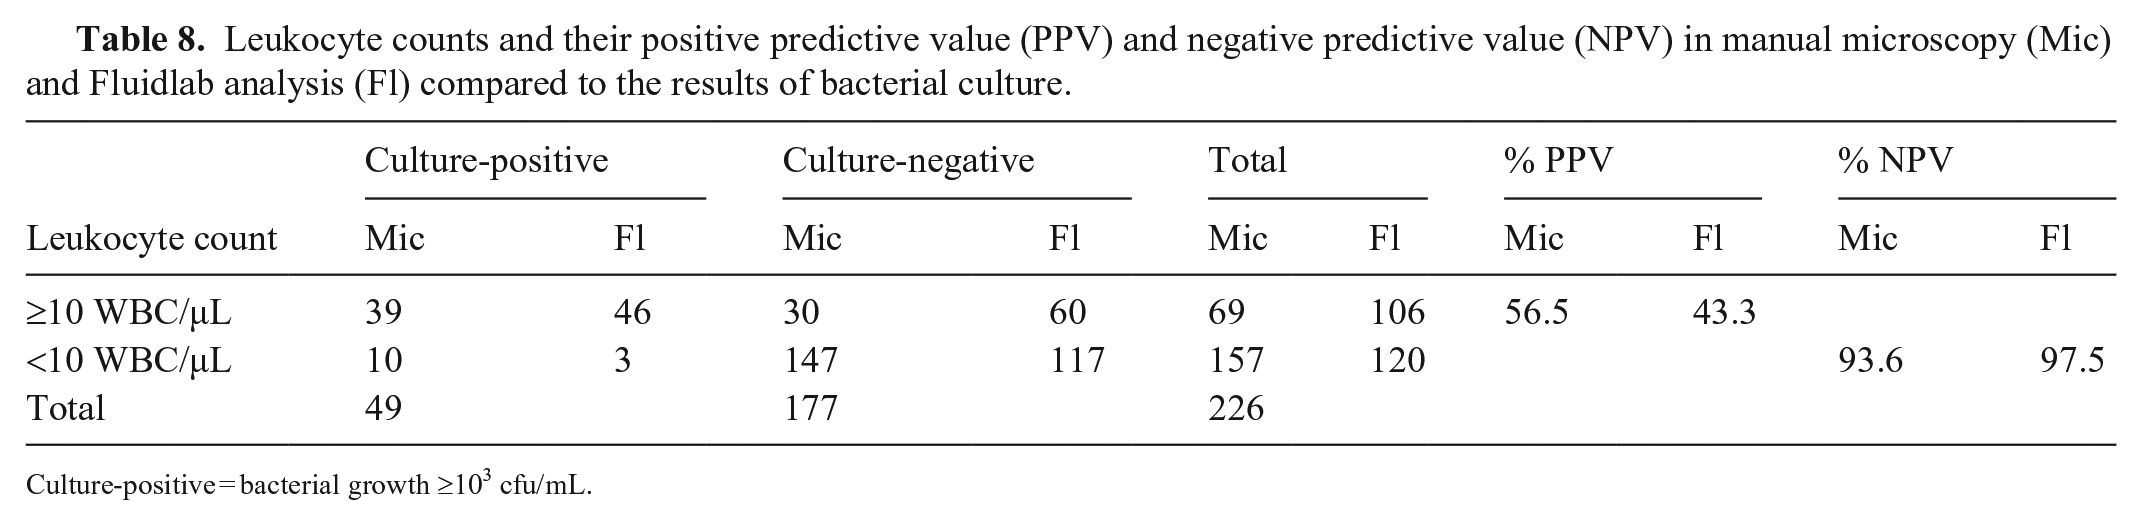
Culture-positive = bacterial growth ≥103 cfu/mL.
However, 10 of 49 samples (20.4%) with a positive urine culture had no pyuria noted in manual microscopy; in Fluidlab analysis, 3 culture-positive samples (6.5%) had no pyuria. Hence, even though the NPVs are high, the absence of pyuria alone does not rule out bacteriuria sufficiently.
As an additional step, the possibility of predicting the outcome of bacterial culture by combining the results of WBC counts and bacterial detection by manual microscopy and Fluidlab analysis was examined. The absence of bacteria in manual microscopy was often associated with the absence of pyuria (143 of 177 samples) and a negative bacterial culture (165 of 177 samples; Table 9). Similar observations were made for the Fluidlab (Table 10). If pyuria was present in those bacteriuria-negative samples, the level of pyuria could not predict the outcome of bacterial culture in either method (Tables 9, 10). If bacteria were detected in manual microscopy, the level of pyuria was associated with a positive bacterial culture (Table 9). Especially at WBC counts ≥25/µL, most urine samples generated a positive bacterial culture (30 of 32 samples). Therefore, in samples with bacteria detected in manual microscopy and WBC counts >25/µL, positive bacterial culture is highly probable. In Fluidlab analysis, only 39 of 67 samples with detected bacteria, and WBC counts ≥25/µL generated a positive bacterial culture (Table 10). Hence, in samples with bacteria detected by Fluidlab analysis, WBC counts do not help to predict the outcome of bacterial culture.
Detection of bacteria by manual microscopy compared to bacterial culture and leukocyte count by manual microscopy.
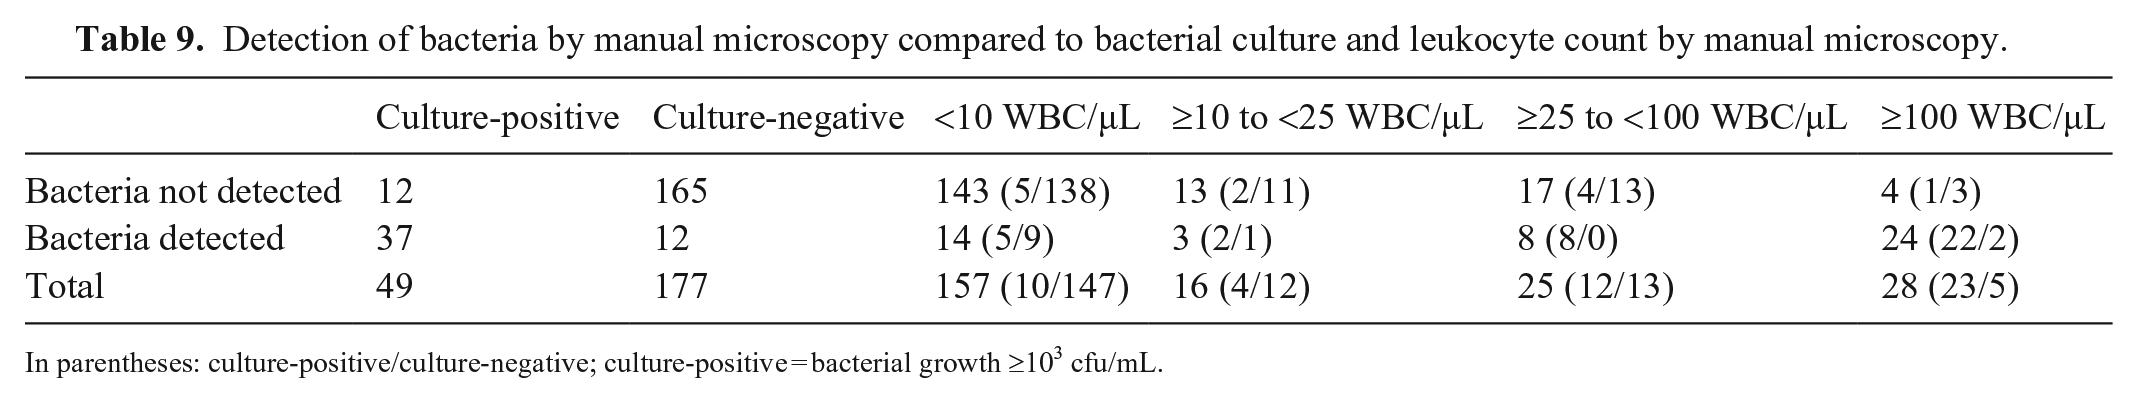
In parentheses: culture-positive/culture-negative; culture-positive = bacterial growth ≥103 cfu/mL.
Detection of bacteria by the Fluidlab compared to bacterial culture and leukocyte count by the Fluidlab.
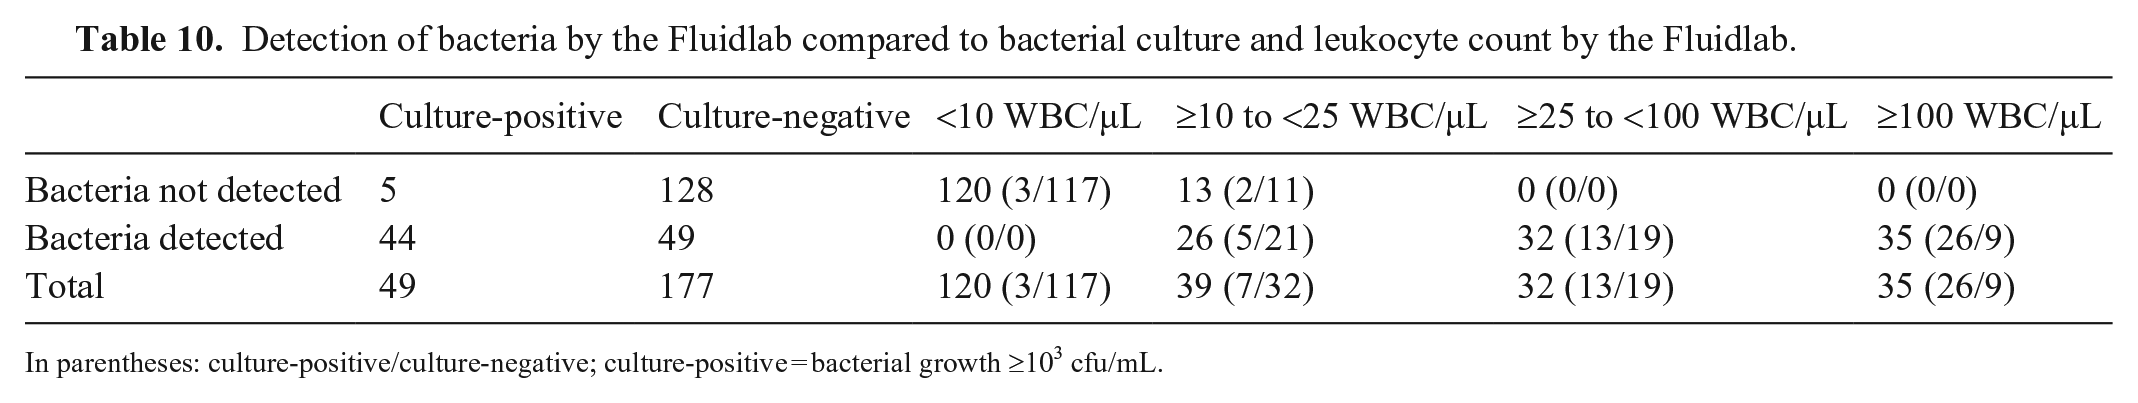
In parentheses: culture-positive/culture-negative; culture-positive = bacterial growth ≥103 cfu/mL.
Image review
To identify possible sources of error, we reviewed microscopic images for the false-positive samples of the Fluidlab compared to manual microscopy (Table 11). Most false-positive samples were positive for at least one other category of formed elements or miscellaneous materials (e.g., lipid droplets, sperm, cell detritus). The presence of lipid droplets seemed to be an important source of error, especially for the identification of RBC (62.9%) and CRY (58.9%).
Findings in manual microscopic images of false-positive samples in the Fluidlab analysis compared to manual microscopy for RBC, WBC, EC, CRY, and CST.
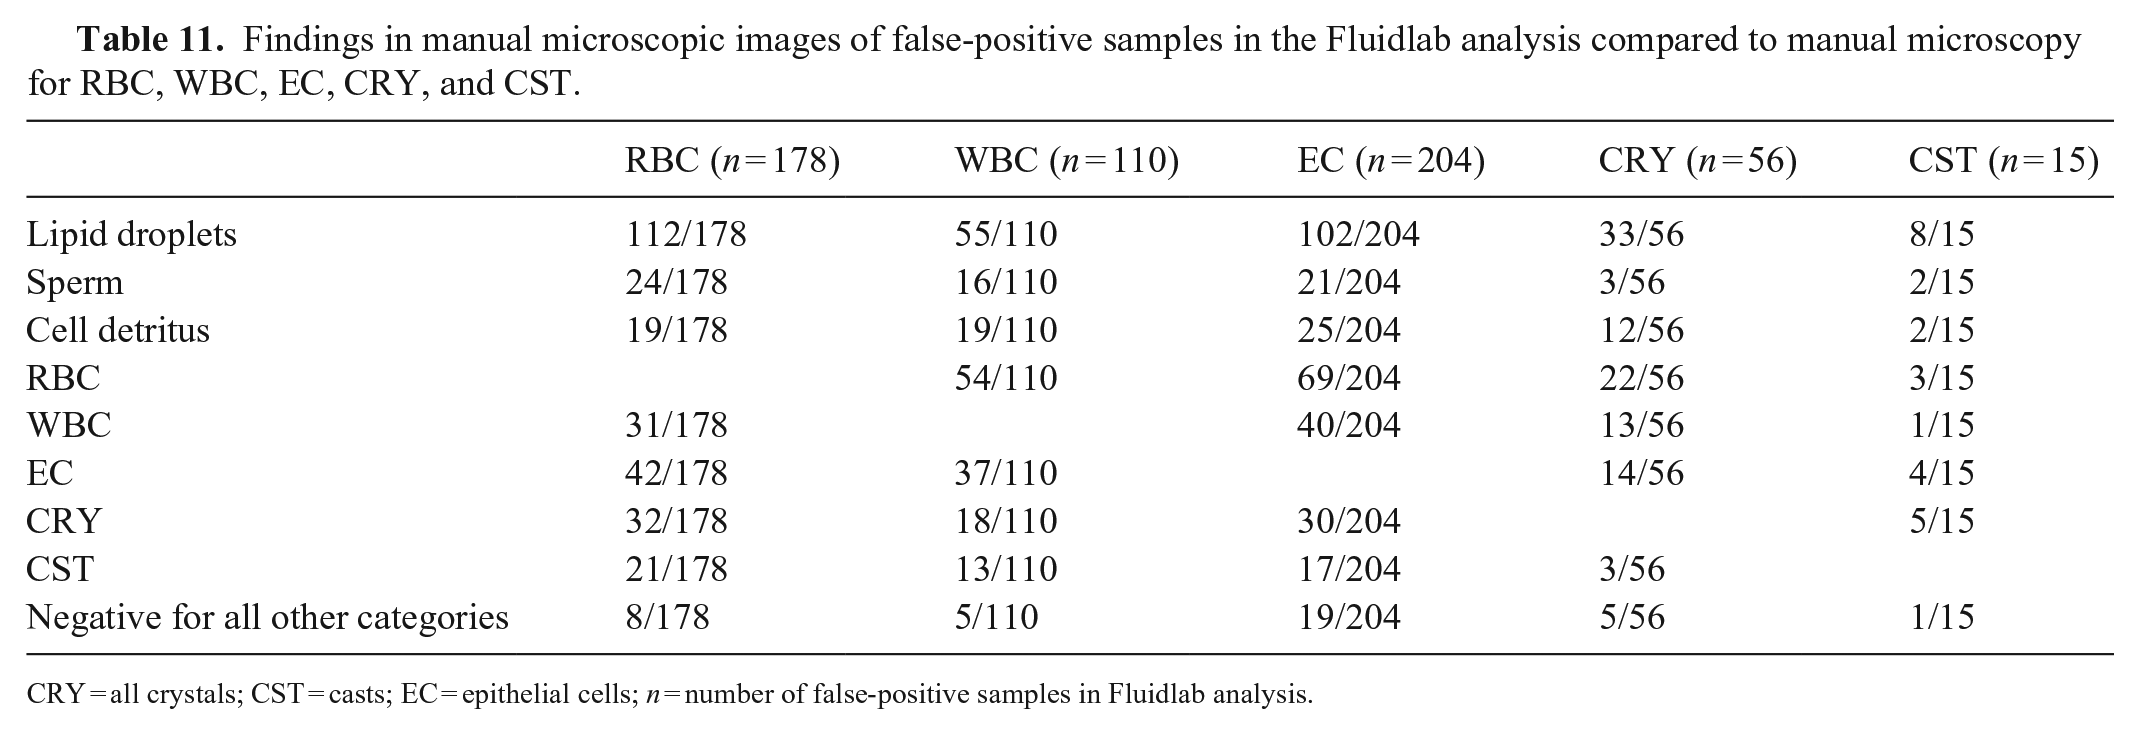
CRY = all crystals; CST = casts; EC = epithelial cells; n = number of false-positive samples in Fluidlab analysis.
Bland–Altman plots and Deming regressions
For Bland–Altman plots, we included samples containing ≥10 and ≤250 RBC/µL in manual microscopy (124 samples) and samples containing ≥10 and ≤500 WBC/µL in manual microscopy (91 samples). The differences in cell counts between Fluidlab analysis and manual microscopy were calculated in percent. The differences were not normally distributed (p < 0.05 for both RBC and WBC in the Kolmogorov–Smirnov test), therefore only the bias and not the 95% limits of agreement were calculated in the Bland–Altman plots. The Fluidlab overestimated RBC counts with a bias of 63.3% (Fig. 2A). Although bias was close to zero for WBC (1.6%), the distribution of the data points was very wide, which suggests insufficient quantitative agreement (Fig. 2B).
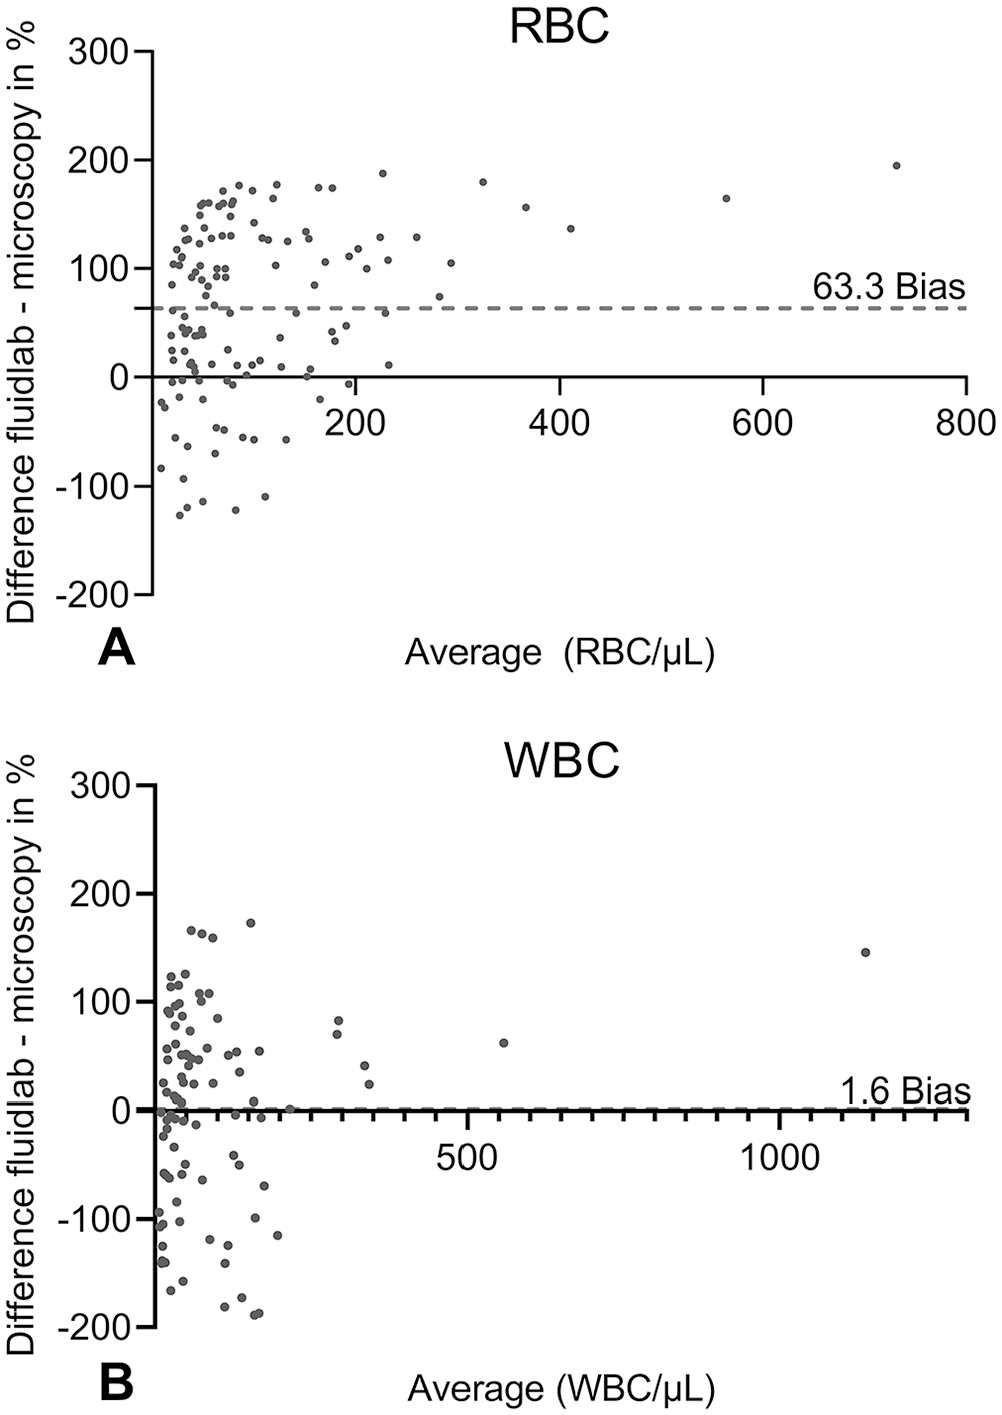
Bland–Altman plots for the detection of
Deming regressions were conducted with all 623 samples for RBC (Fig. 3A) and WBC (Fig. 3B). For illustrative purposes, only data points <500 cells/µL in both methods are included in the figures. The high y-intercept for RBC (240) shows that RBC counts were frequently higher in Fluidlab analysis compared to manual microscopy. For WBC, the discrepancy is less, with a y-intercept of 36.5. The wide distributions of data points around the regression lines for both RBC and WBC demonstrate that the regression equations cannot be used to reliably predict cell counts by the Fluidlab, compared to the cell counts in manual microscopy.
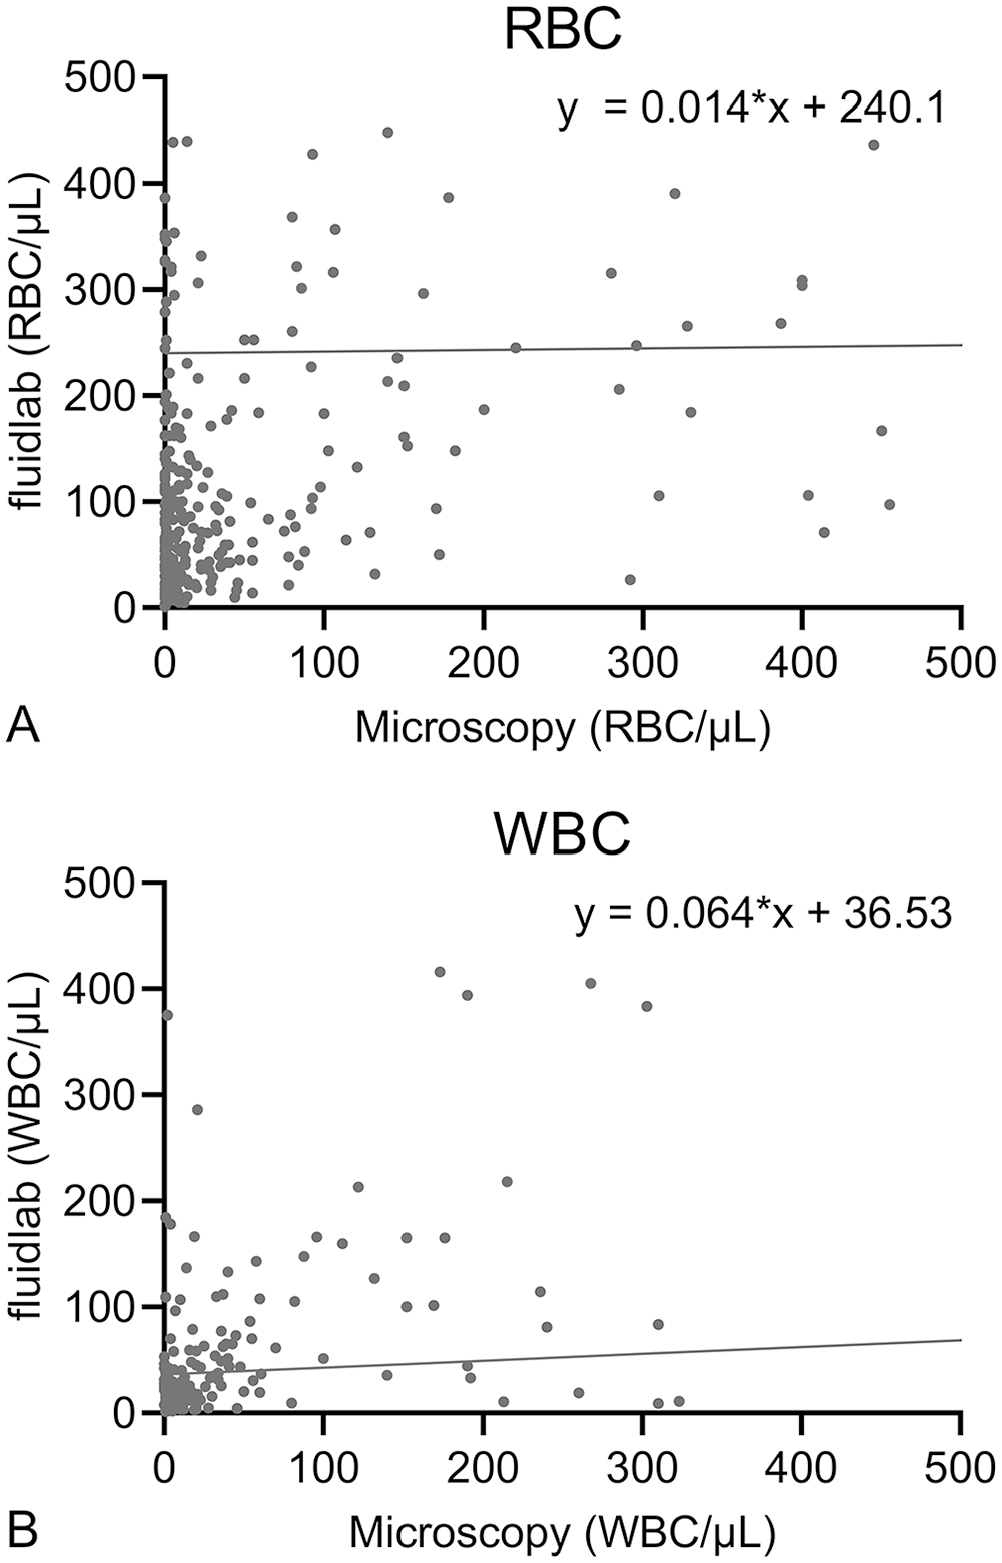
Deming regressions for the detection of
Discussion
The Fluidlab is simple to use, and operating errors are unlikely. However, malfunctions in data collection did occur in 44 of 1,872 (2.3%) measurements (no detection of formed elements in 1 or 2 of 3 measurements, although verifiably present in relevant numbers). Although this percentage is low, this error could lead to inappropriate patient care in veterinary practices given that urinalysis is usually only performed once. The Fluidlab may have focused on the wrong optical plane in these measurements and therefore missed the particles.
The CVs of the Fluidlab were higher than those reported for the SediVue (15.5% vs. 9.9% for RBC; 17.1% vs. 11.9% for WBC) at medium cell counts, 12 but lower than the CVs reported for manual microscopy, which have been found to be 20% and 30% for RBC and WBC at medium cell counts, respectively.5,6,9,26 Because the CVs of the Fluidlab are lower than those reported for the gold standard of manual microscopy, we considered them acceptable.
Sensitivity for the detection of different cell types was good and exceeded those reported for the SediVue compared to manual microscopy, with a sensitivity of 92.0% for RBC (SediVue 88.9%) and 90.1% for WBC (SediVue 85.7%). 12 We did not perform a subcategorization of EC in sqEPI and nsEPI. The misclassification of sqEPI as nsEPI and vice versa was reported for the SediVue, and sensitivities for both categories were unsatisfactory, with 33.3% for sqEPI and 71.4% for nsEPI. 12 In contrast, sensitivity of the Fluidlab for the detection of EC was good (87.5%).
Specificity of the Fluidlab was unsatisfactory for RBC (55.1%) and EC (59.4%), which means that many false-positive results occurred. Lipid droplets seemed to be one of the reasons for the low specificity, given that lipid droplets were present frequently in the false-positive urine samples. In SediVue analysis, a similar problem has been reported, 12 and the manufacturer increased the centrifugation time. This approach seems to have solved the problem, given that lipid droplets appeared very rarely in SediVue images in our study. In manual microscopy, it is possible to blank out lipid droplets by focusing on another optical plane. The Fluidlab was probably not able to focus on the correct plane and therefore misclassified lipid droplets as formed urine elements. The detection of an active urine sample by Fluidlab analysis compared to manual microscopy also generated very low specificity (48.9%). This supports the conclusion that the Fluidlab frequently misidentified miscellaneous materials and lipid droplets as formed urine particles and therefore generated a high number of false-positive results. Another possible reason for the low specificity for RBC and EC is a misclassification of other formed elements such as WBC, CRY, or CST as RBC and EC.
Bland–Altman plots and Deming regressions showed an overestimation of RBC by the Fluidlab compared to manual microscopy. It is likely that the device counted other cells or miscellaneous materials as RBC and therefore overestimated the counts, but underestimation of RBC counts by manual microscopy cannot be ruled out. Counts for both RBC and WBC disagreed frequently in both methods as demonstrated by the wide distribution of data points in the Bland–Altman plots. In conclusion, Fluidlab and manual microscopy tend to agree qualitatively for RBC and WBC, but do not agree quantitatively.
The sensitivity for the detection of crystals by the Fluidlab compared to manual microscopy was unsatisfactory and lower than that reported for the SediVue, with 67.6% for STR (SediVue 90.6%) and 53.9% for CRY. 12 Sensitivities for other crystal types were not calculated given the low prevalence in the sample group. Specificity, however, was excellent for STR (97.9%) and better than that reported for the SediVue (84.4%). 12 Specificity for CRY was also good at 90.0%. During our study, in vitro STR formation, sometimes within mere minutes after SediVue examination, was observed both in counting chambers for manual microscopy and in the sample carriers of the Fluidlab. Twenty-three of 34 samples (67.6%) positive for STR in manual microscopy were affected. Thirteen of those 23 samples were also positive for STR during the Fluidlab examination. Given that the sensitivity of the Fluidlab for the detection of STR is low, in vitro–formed STR were probably missed frequently by the device. It is known that temperature and time play an important role in crystal formation in vitro.2,19 It is likely that additional factors, such as the saturation of the urine with minerals, USG and pH, or the materials of the sample carrier and counting chamber, had an impact on crystal formation. This observation demonstrates that the clinical relevance of struvite crystals in the urine sediment should not be overestimated, given that they may form so rapidly in vitro. In vitro formation of other crystal types was not observed.
The sensitivity of the Fluidlab for CST was low, with only 12.5% compared to manual microscopy and 14.5% compared to SediVue analysis. nhCST are sediment particles with a high clinical relevance because they suggest renal damage. 8 Missing nhCST could have a negative impact on patient care. There are several potential reasons for the low sensitivity. It is possible that there were no CST in the observed area of the Fluidlab given that only 1 CST/µL was present in 27 of 40 positive samples in manual microscopy. A similar observation has been made for the SediVue, for which sensitivity for the detection of CST in dog urine was also poor (53.7%) compared to manual microscopy. 22 In the SediVue study, CST appeared mostly in low numbers, and 70% of the false-negative samples had in fact no CST in the observed SediVue images; other mentioned reasons for the low sensitivity were “out-of-focus” CST and the sometimes low density of CST. 22 These reasons can also apply to the Fluidlab. Furthermore, the distance from sample input to the observation area is quite long in the Fluidlab sample carrier. Optical detection may have occurred before the CST reached the observation area, given that they may travel more slowly than other urine particles. Also, the Fluidlab may have misidentified CST as other urine particles (e.g., cells or crystals), given that only 3 of 35 false-negative samples were negative for all other categories. CST are fragile sediment elements and can fracture easily, 8 which makes their identification even more difficult; we noted a decrease of samples positive for CST after centrifugation. It is therefore advisable to avoid centrifugation of the urine if CST are of special interest to the observer.
Of the 3 methods studied, manual microscopy provided the most accurate results for the detection of bacteria compared to bacterial culture. The staining of the urine sediment with Wright–Giemsa improves sensitivity and specificity of manual microscopy further (sensitivity of 83–93% and specificity of 99% compared to bacterial culture)20,21 and should be performed if bacteria are detected by any of the 3 methods. This approach provides the clinician with a reliable result within minutes and helps with the decision of whether to treat with antimicrobial drugs while the results of the bacterial culture are pending. In 12 urine samples, bacteria were detected in manual microscopy, but bacterial culture was negative. This raises the question of whether the bacterial culture yielded false-negative results, which can occur with refrigerated urine samples1,15 or with animals that underwent antibiotic treatment shortly before bacterial culture. However, given that we only included an evaluation of unstained urine samples, and small particles (i.e., lipid droplets, cytoplasmic organelles, debris) may be mistaken as bacteria,20,21 we consider it more likely that those samples were false-positive in manual microscopy.
Regarding the connection of pyuria and bacteriuria, observations similar to ours were reported for the detection of bacteria by SediVue analysis in cat urine. 14 The absence of WBC was also associated with a negative bacterial culture (NPV = 94.0%). 14 Comparable to our study, 18% of culture-positive urine samples from cats did not have pyuria. 14 Other studies reported percentages of 30.1% for cats and dogs, 7 47.3% for dogs, 21 or even 66% for cats 20 in which culture-positive samples had no pyuria in manual microscopy. Although higher WBC counts were found more often in culture-positive samples and low WBC counts in culture-negative samples, WBC counts cannot safely predict the result of bacterial culture.
Advantages of the Fluidlab over manual microscopy are its fast turnaround time, easy handling and maintenance, and reduction of sample alteration by the absence of preanalytical preparation steps. Furthermore, the Fluidlab requires only 20 µL of sample. However, given that the Fluidlab only examines 1 µL of urine (SediVue: ~10 µL 22 ), important but low-frequency formed elements, such as casts, may not be detected in such a small volume. Although a holographic image is produced by the Fluidlab, it is not suitable for image review, which is a major advantage of the SediVue. 12 The sample carrier of the Fluidlab can be examined under the microscope to confirm its results, but we did not include this step.
All calculations regarding manual microscopy were performed based on the microscopic examination of uncentrifuged urine, although the current gold standard is the examination of the urine sediment after centrifugation. Although centrifugation may alter cells, casts, and crystals, a urine concentration step is generally advised before sediment examination.6,8,11 In our study, when comparing the results for the 466 urine samples examined, both uncentrifuged and centrifuged, the additional benefit of centrifugation appears marginal for RBC and WBC, and seems to be detrimental for the detection of other elements. It is important to note that only 0.5 mL of urine were used for centrifugation, whereas most protocols advise using higher volumes. 8 However, it had been shown that volumes as low as 60 µL can be sufficient to reach an adequate concentration of RBC and WBC using gravimetric centrifugation, comparable to that of centrifugation of 5 mL of urine. 6 A similar observation was made in a study in which the concentration of cells was comparable for high and low volumes used for centrifugation. 23 Furthermore, unpredictable increases and decreases of cell counts for RBC and WBC occurred after centrifugation. The preparation of a urine sediment with centrifugation cannot be standardized well and appears to be of no benefit even for rare elements.
In manual microscopy, variations in sediment interpretation by different observers occur frequently.5,16,24 This is also a limitation of our study given that 2 and sometimes 3 observers performed the manual microscopy. The second and third observer used digital images of the manual microscopy. Image quality and resolution were high, but there was no possibility to focus on different optical planes, which may have hindered correct identification of particles in some samples. Ideally, the first observer should have been blinded to the results of the SediVue and the health status of the patients, but this was not always possible as a result of internal workflows. Given that the second and third observer were blinded to the SediVue results and had no knowledge of the health status of the patients, we believe that the results of manual microscopy were not biased significantly, but bias cannot be ruled out.
Footnotes
Acknowledgements
We thank the Clinic for Small Animal Surgery and Reproduction of the Ludwig Maximilian University in Munich, Germany, for their support in sample collection, especially Dr. Andrea Meyer-Lindenberg, head of the clinic. We also thank the laboratory staff of the Clinic of Small Animal Medicine for their support in sample analysis and storage.
Declaration of conflicting interests
This study was supported by Anvajo, the manufacturer and distributor of the Anvajo Vet Fluidlab 1. The company was involved in the study design and provided the equipment for the study (Anvajo Vet Fluidlab 1, sample carriers, microscopic camera, counting chambers, and laptop). It also provided the Fluidlab results in absolute numbers per µL and funded a part-time position as a research assistant for Sandra Seigner at the Clinic of Small Animal Medicine in Munich, Germany. Anvajo was not involved in the statistical calculations or the preparation of this manuscript.
Funding
Financial support was provided by Anvajo.