
Abstract
We evaluated the effects of storage temperature (−20 or −80°C) and handling procedure on plasma concentrations of bovine haptoglobin and ceruloplasmin. Within each temperature, whole blood samples were: centrifuged within 2 h of collection and plasma kept frozen until analysis (control); refrigerated at 4°C for 24 h before plasma harvest and freezing (24H); or plasma harvested and frozen within 2 h after collection, but then plasma samples were thawed and refrozen 1 wk (1X), 1 and 2 wk (2X), or 1, 2 and 3 wk (3X) before analyses. Haptoglobin concentrations were greatest at 24H, but similar among remaining treatments. Ceruloplasmin concentrations were not affected by the handling procedures. Storage temperature did not affect haptoglobin concentrations, but ceruloplasmin concentrations decreased when stored at −20 versus −80°C. Except for greater concentrations after 24 h storage at 4°C, haptoglobin concentrations remained stable at either freezing temperature and through freeze–thaw cycles. Ceruloplasmin concentrations decreased after 3 freeze–thaw cycles and required lower freezing temperatures to remain stable.
Acute-phase proteins are released into the blood of cattle during an acute-phase response, 1 which can be stimulated by infection, trauma, or stressful management practices, such as weaning, transportation, and vaccination.1,7 Haptoglobin (Hp) is the major circulating acute-phase protein in ruminants, 3 and its concentrations may increase over 100-fold upon stimulation. 2 Hence, Hp has been used as an indicator of inflammatory conditions in cattle when plasma concentrations are ≥0.11 g/L. 11 Ceruloplasmin (Cp) is a moderately useful acute-phase protein in cattle that may increase by 50% during an acute-phase response. 4 Laboratory analysis of Cp is relatively fast and inexpensive, and increased plasma Cp concentrations have been correlated consistently with weaning-, transportation-, and vaccine-induced inflammatory responses in beef cattle.1,4,7 For those reasons, Cp is a logical, reliable, and inexpensive indicator of an acute-phase response in beef cattle.
In commercial beef cattle operations, plasma concentrations of Hp and Cp are often not determined immediately after blood collection because of practical and logistical limitations, including: 1) distance from the location of blood collection to laboratory; 2) lack of blood processing and refrigeration equipment; and 3) number of samples that can be collected and processed in a single day. These limitations may require blood and plasma samples to be handled and stored differently before laboratory analysis, which could modify plasma concentrations of Hp and Cp. However, little is known about the effects of pre-analytical plasma sample handling on stability of acute-phase proteins. Thus, we evaluated the effects of different storage temperatures and multiple freeze–thaw cycles on bovine plasma concentrations of Hp and Cp.
The animals utilized in our experiment were cared for in accordance with acceptable practices as outlined in the Guide for the Care and Use of Agricultural Animals in Agricultural Research and Teaching, 6 and approved by the Institutional Animal Care and Use Committee from University of Florida (#009-10ONA). We obtained plasma samples from 12 Brangus-crossbred steers (~10 mo of age) that were vaccinated against Mannheimia haemolytica (OneShot, Zoetis Animal Health, New York, NY) in order to stimulate an acute-phase response and production of Hp and Cp. Blood samples were collected from each steer via jugular venipuncture into a single 10-mL tube (Vacutainer, Becton Dickinson, Franklin Lakes, NJ) containing sodium heparin (158 U.S. Pharmacopeia units) on day 1 after vaccination to correspond with peak plasma concentrations of Hp and Cp. 1
Within each steer, blood samples were randomly assigned to treatments in a 2 × 5 factorial design, and consisted of plasma samples kept frozen at −20 or −80°C before laboratory analyses. Within each storage temperature, blood samples were randomly assigned to 1 of 5 handling procedures: blood samples centrifuged at 2,500 × g for 30 min at 4°C and plasma frozen within 2 h after blood collection and kept frozen until the day of analysis (control); blood samples refrigerated at 4°C for 24 h before plasma was harvested and frozen (24H); and plasma samples harvested within 2 h of collection and frozen, but thawed at room temperature for 1 h and refrozen 1 wk (1X), 1 and 2 wk (2X) or 1, 2, and 3 wk (3X) before laboratory analyses. The 1X, 2X, and 3X treatments were included in order to simulate scenarios in which plasma samples are thawed and used multiple times for different laboratory analyses, whereas the 24H treatment simulated a scenario in which samples required refrigeration for 24 h before plasma harvest is possible.
We used a colorimetric procedure,4,10 in which differences in peroxidase activity were used to calculate haptoglobin–hemoglobin complexes as an indicator of Hp concentrations using standard equations developed from solutions of known concentrations. Plasma concentrations of Hp were determined in quadruplicate. A standard curve was generated based on a bovine plasma sample with a known Hp concentration (1 g/L; H2500-5g, Sigma-Aldrich, St. Louis, MO), using serial dilutions (1:1) to produce the following standards: 0.8, 0.6, 0.4, 0.2, and 0 g/L. Five microliters of plasma or distilled water (for blank determination) were added to 7.5 mL of O-dianisidine solution (0.6 g/L of O-dianisidine, 0.5 g/L of EDTA, and 13.8 g/L of sodium phosphate monobasic in distilled water; pH adjusted to 4.1) in a 16 × 100 mm borosilicate tube. Twenty-five microliters of a hemoglobin solution (0.3 g/L of bovine hemoglobin in distilled water) was immediately added to each tube. All tubes were incubated for 45 min in a water bath (2845 water bath, Thermo Fisher Scientific, Waltham, MA) set at 37°C. After incubation, 100 µL of a freshly prepared working concentration of 156 mM hydrogen peroxide solution was added to each tube. All tubes were incubated for 1 h at room temperature. After incubation, 200 µL were transferred from each tube into 1 well in a 96-well polystyrene flat-bottom microplate, and optical density (OD) was immediately read at 450 nm in a VersaMax tunable microplate reader (Molecular Devices, Sunnyvale, CA) using the included software (SOFTMAX PRO, Molecular Devices). The OD from the blank sample was subtracted from the OD of all plasma-containing samples. Intra- and inter-assay coefficient of variation (CV) for plasma Hp concentrations were calculated using bovine plasma control samples and were 4.3 and 2.9%, respectively.
Plasma Cp oxidase activity was measured in duplicate samples by a colorimetric procedure 5 and expressed as g/L. 9 Fifty microliters of plasma samples were added to 500 µL of buffer (13.6 g of sodium acetate, 50 mL of 0.1 M acetic acid, into 900 mL of distilled water; pH adjusted to 5.95) in a 12 × 75 mm borosilicate tube. Five hundred microliters of p-phenylenediamine solution were added into tubes after 5-min incubation at 37°C, and then 500 µL of sodium azide were added only to blank tubes. All tubes were incubated at 37°C for 30 min. Sodium azide (500 µL) was added to the remaining tubes, and then the entire tube contents were poured into cuvettes for absorbance reading at 530 nm. Intra- and inter-assay CV for plasma Cp concentrations were calculated using bovine plasma control samples and were 2.3 and 5.2%, respectively.
Data were analyzed as a 2 × 5 factorial design using GLIMMIX procedure (v.9.3, SAS Institute, Cary, NC), with temperature as the main factor and storage conditions within temperature as the minor factor. Data were analyzed using plasma aliquot as the experimental unit, and steer and aliquot (storage temperature × handling procedure) as random effects. Plasma concentrations of Hp and Cp were tested for the fixed effects of storage temperature, handling procedure, and resulting interaction. All results are reported as least-squares means. Data were separated using PDIFF if a significant preliminary F-test was detected. Significance was set at p ≤ 0.05.
Effects of storage temperature × handling procedure were not detected for plasma concentrations of Hp and Cp (p ≥ 0.85). Handling procedure affected plasma Hp concentrations (p = 0.0002; Table 1), but not plasma Cp concentrations (p = 0.09; Table 1). Plasma Hp concentrations were greater for 24H versus control, 1X, 2X, and 3X samples (p ≤ 0.001), but did not differ among control, 1X, 2X, and 3X samples (p ≥ 0.17). Storage temperature did not affect plasma Hp concentrations (p = 0.59; 0.67 and 0.66 ± 0.023 g/L for samples stored at −20 and −80°C, respectively), whereas plasma Cp concentrations were greater (p = 0.0003) for samples stored at −80 versus −20°C (27.8 vs. 27.1 ± 0.14 g/L, respectively).
Plasma concentrations (g/L) of haptoglobin and ceruloplasmin in blood samples randomly assigned to 1 of 5 pre-analytical handling procedures (control, 24H, 1X, 2X, and 3X).*
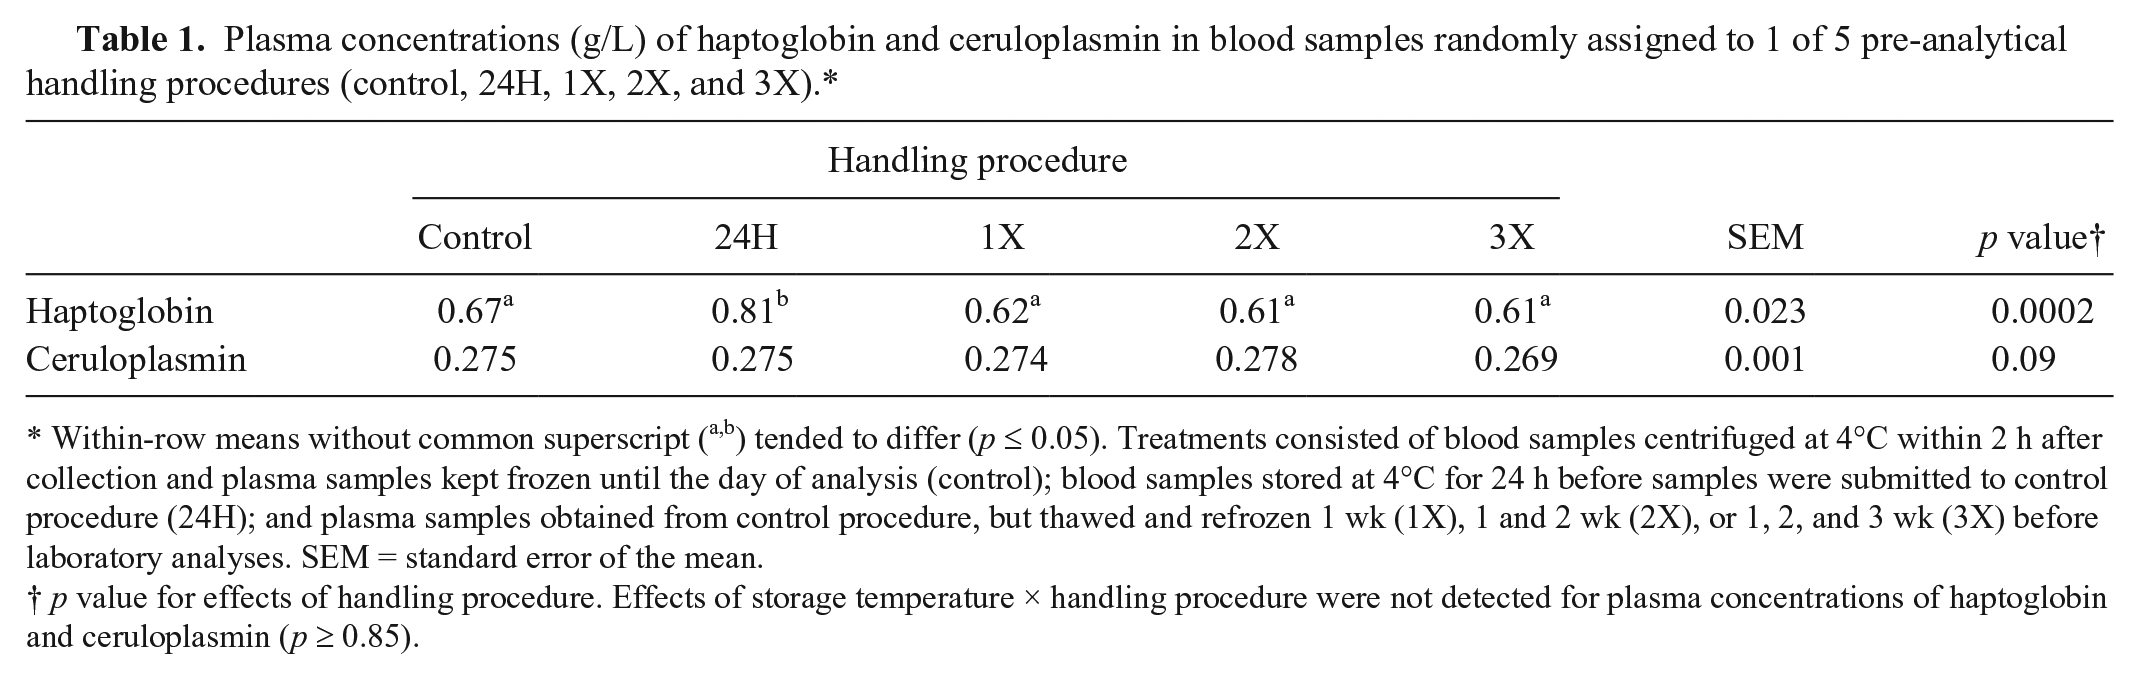
Within-row means without common superscript (a,b) tended to differ (p ≤ 0.05). Treatments consisted of blood samples centrifuged at 4°C within 2 h after collection and plasma samples kept frozen until the day of analysis (control); blood samples stored at 4°C for 24 h before samples were submitted to control procedure (24H); and plasma samples obtained from control procedure, but thawed and refrozen 1 wk (1X), 1 and 2 wk (2X), or 1, 2, and 3 wk (3X) before laboratory analyses. SEM = standard error of the mean.
p value for effects of handling procedure. Effects of storage temperature × handling procedure were not detected for plasma concentrations of haptoglobin and ceruloplasmin (p ≥ 0.85).
In our study, plasma Cp and Hp concentrations were not analyzed immediately following blood collection and before freezing samples because this procedure is unlikely to be standard practice. Hence, it is unknown if plasma Cp and Hp concentrations were reduced after freezing. However, storage temperature did not affect plasma Hp concentrations, whereas plasma Cp concentrations were 2.5% greater for plasma samples stored at −80 versus −20°C. Our results suggest that a lower freezing temperature prevented mild Cp protein degradation and confirms that Hp can withstand multiple freeze–thaw events without compromising Hp concentration. However, if treatments are equally distributed within a single assay run, it is questionable if a 2.5% reduction in plasma Cp concentrations would result in misinterpretation of results and be a concern for researchers or clinicians.
Most of the activities of Hp are related to the binding of Hp to circulating free hemoglobin, and not to free Hp. 3 Haptoglobin forms a stable, irreversible complex with hemoglobin that has been released from erythrocytes in the circulation. Once formed, the complex is stable, irreversible, and is rapidly removed by circulation by the monocyte/macrophage CD163 haptglobin–hemoglobin receptor expressed on Kupffer cells in the liver. 8 Based upon this very strong binding, it has been suggested that Hp is involved in recycling of hemoglobin iron, prevention of oxidative damage, and as a bacteriostat to deny heme iron to pathogenic bacteria.3,12 Plasma Hp concentrations remained stable after multiple freeze–thaw cycles if blood samples were centrifuged within 2 h of blood collection (control, 1X, 2X, and 3X samples). As reported by others, Hp protein was able to withstand multiple freeze–thaw cycles and, if stored at −20°C, is stable for periods >12 mo. 11 However, in our study, plasma Hp concentrations in blood samples stored at 4°C for 24 h before plasma harvest were 28.6% greater than the average plasma Hp concentrations of remaining treatments. Hemoglobin is the fundamental oxygen-transporting molecule in blood and is released from red blood cells into the plasma during hemolysis, which can increase plasma Hp concentrations. 11 Therefore, in our study, the greater plasma Hp concentration of samples kept refrigerated for 24 h before plasma harvest likely reflects increased hemolysis leading to greater release of hemoglobin from erythrocytes, then greater formation of haptoglobin–hemoglobin complexes. Hence, we recommend that blood samples not be refrigerated for 24 h before the assessment of plasma Hp concentrations, as this procedure could erroneously affect interpretation of results. A greater percentage of recently weaned, stressed beef calves could be misdiagnosed as experiencing an inflammatory response as a result of greater plasma Hp concentrations induced by 24 h of pre-freezing refrigeration.
Unlike plasma Hp concentrations, plasma Cp concentrations did not differ based on handling procedure. Plasma Cp concentrations remained stable among control, 24H, 1X, and 2X samples, and decreased only after samples were exposed to 3 freeze–thaw cycles before laboratory analysis. However, this reduction in plasma Cp concentrations was only 2.4% compared to the average of remaining treatments. The lack of pre-freezing refrigeration effects on Cp concentrations was expected, given that hemoglobin does not interfere with the Cp assay, 5 and indicates that plasma Cp concentrations remained fairly stable even after multiple freeze–thaw events.
Footnotes
Acknowledgements
We thank Andrea Dunlap for technical assistance during the study.
Declaration of conflicting interests
The authors declared no potential conflicts of interest with respect to the research, authorship, and/or publication of this article.
Funding
The authors received no financial support for the research, authorship, and/or publication of this article.