
Abstract
Acute phase proteins (APPs) are important diagnostic indicators of inflammatory disturbances in animals. The objectives of the current study were to validate analytical methods for measuring haptoglobin (Hp), serum amyloid A (SAA), acid soluble glycoprotein (ASG), fibrinogen, and albumin concentrations in goats and to evaluate their response to an inflammatory stimulus in this species. Intra- and interassay coefficients of variation (CVs) were in the range 0.07–9.31% and 1.83–12.68%, respectively, for all APPs and showed good precision. All assays determined APPs in a linear manner at different sample dilutions with high correlation coefficients with the exception of fibrinogen, which was measured by the heat precipitation method. Subcutaneous injection of turpentine oil induced an increase in Hp, SAA, ASG, and fibrinogen serum concentrations and a decrease in albumin concentration.
Keywords
Introduction
Acute phase proteins (APPs) are a group of blood proteins that change in concentration in animals subjected to external or internal challenges, such as infection, inflammation, surgical trauma, or stress. Positive APPs, such as haptoglobin, C-reactive protein, serum amyloid A, ceruloplasmin, fibrinogen, and alpha 1-acid glycoprotein, increase in concentration in response to inflammation. The “negative” APPs decrease in concentration in response to inflammation and include proteins like albumin and transferrin. 20
Quantification of APP concentration in plasma or serum can provide valuable diagnostic information in the detection, prognosis, and monitoring of disease in several animal species. 6 The inclusion of APP measurements in health monitoring programs on a herd basis in livestock has been suggested, not only for the identification of individual animals with disease, but also as a means to identify animals with subclinical disease. 7 In addition, the use of APPs for screening in ante- or postmortem inspection to identify animals that should be subjected to a more thorough inspection or to ensure the health of animals prior to entry to the human food chain has been suggested. 24 Furthermore, the recent recognition that APPs are produced in the bovine mammary gland in response bacterial mastitis has exciting potential for APP measurement to detect this economically important disease in ruminants, especially if adapted for automated milking systems. 7
Worldwide, the goat population is approximately 715 million (FAO: 2004, Yearbook statistics. Available at: http://www.fao.org/statistics/yearbook/. Accessed January 14, 2008). In the United States and Europe, the consumption of goat meat and milk has increased significantly in the last decade as a result of immigration from Asian and Latin American countries. 5 In the last 20 years, the goat population increased 56.3% worldwide, and meat production has increased 40% in the past 10 years. 2 However, despite the clinical value that determinations of APPs could have in caprine practice, to the authors' knowledge, there is a lack of information about this subject in the veterinary literature. The objectives of the current study were to perform an analytical validation of methods for haptoglobin (Hp), serum amyloid A (SAA), acid soluble glycoprotein (ASG), fibrinogen, and albumin determination in goats and to evaluate the response of these proteins to experimentally induced inflammation.
Materials and methods
Six clinically healthy Murciano-Granadina goats (mean age: 7 years; age range: 6–9 years) were used in this study. The goats were housed in collective boxes with straw bedding with free access to water and were fed with alfalfa hay ad libitum. Turpentine oil a was injected once (5 ml) subcutaneously above the ribs. Blood samples (5 ml) were collected from the jugular vein in plain and ethylenediamine tetra-acetic acid (EDTA) tubes b before injection (day 0) and at 1, 2, 3, 4, 5, and 8 days after injection. Samples in EDTA tubes were centrifuged to obtain the plasma for fibrinogen determination. Blood in plain tubes was allowed to clot for 2 hr and then centrifuged. The obtained serum was frozen (–20°C) until analysis. This procedure was approved by the Ethical Committee of the University of Murcia (Spain).
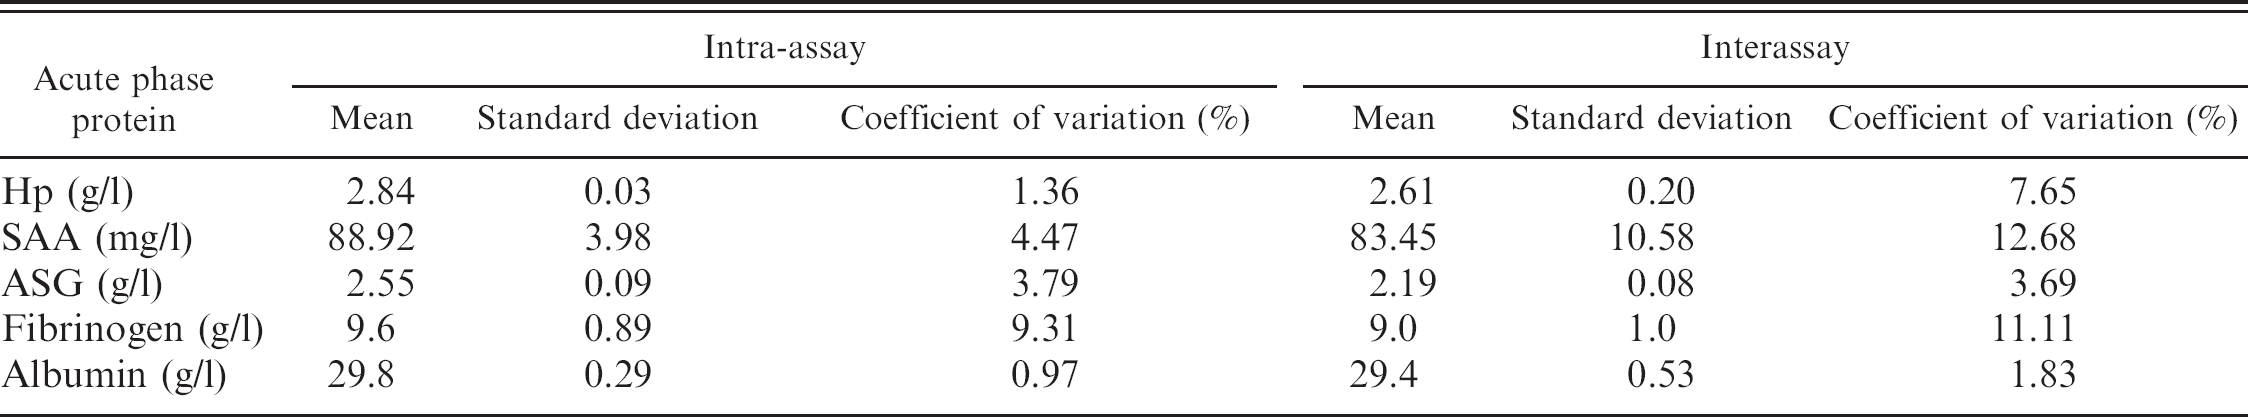
Precision analysis of haptoglobin (Hp), serum amyloid A (SAA), and acid soluble glycoprotein (ASG) in goats.
Acute phase protein determinations
Serum concentrations of Hp were quantified by spectrophotometric method using a commercial kit based on peroxidase activity of the haptoglobin-hemoglobin complex. c For ASG determination serum samples were precipitated with perchloric acid, and protein concentration in the supernatant was measured using bicinchoninic acid and copper sulphate as reagents, following methods previously described. 10,21 Albumin was determined by bromocresol green method using a commercial kit. d These assays were performed in an automated biochemistry analyzer. e Serum concentrations of SAA were measured using a commercially available enzyme-linked immunosorbent assay (ELISA) kit f according to the manufacturer's instructions; the final absorbance was measured in a microtiter plate reader g at 450-nm wavelength. Fibrinogen was measured in plasma samples by heating precipitation method at 56°C. 27
Analytical validation
For analytical validation of the different APP assays, the following parameters were calculated:
Precision. Intra-assay coefficients of variation (CVs) were calculated after analysis of a pool of samples with high APP concentrations measured 5 times in a single assay run. Interassay CVs were determined by analyzing the same pool in 3 separate runs carried out on different days.
Linearity. Linearity was evaluated by analyzing serial dilutions (100%, 75%, 50%, and 25%) of a pool of samples with high APP values.
Limit of detection. The limit of detection of the assay is the lowest concentration that could be distinguished from a specimen of value zero. It was calculated based on data from 10 replicate determinations of the zero standard as mean value plus 2 standard deviations. Limit of detection was not calculated for fibrinogen since no blank is used in this assay.
Statistical parameters were calculated by using statistical software. h Intra- and interassay CVs and detection limits were calculated using routine descriptive statistical procedures. Ordinary regression analysis was performed to investigate the linearity under dilution. Data of each APP obtained before and after turpentine injection were analyzed for normality by using the Kolmogorov-Smirnov's test and showed a nonparametric distribution. Therefore, data were expressed as median and percentiles (25th and 75th) and a Dunn's multiple comparison test was used to compare baseline APP results (day 0) with those obtained on specific days after turpentine injection. Significance level was established as P < 0.05.
Results
Results of the precision study for the different APPs are shown in Table 1. Intra-assay CVs ranged from 0.97% to 9.31%. Fibrinogen determination showed the highest CV (9.31%), whereas the albumin assay showed the lowest (0.97%). Interassay CVs ranged from 1.83% to 12.68% and were higher in all proteins studied with the exception of ASG.
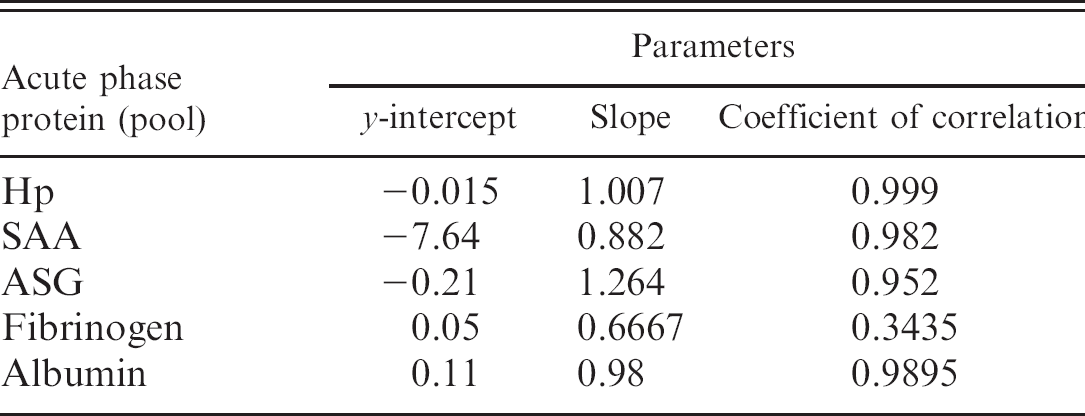
Dilution of pools with high concentrations of the individual APPs resulted in linear regression equations with a correlation coefficient that ranged between r = 0.95 and r = 0.99 in all cases, with the exception of fibrinogen, which showed a correlation coefficient of r = 0.78 when diluted (Table 2). Limits of detection were 0.02 g/l, 0.20 g/l, 3.06 mg/l, and 0.005 g/l for Hp, ASG, SAA, and albumin, respectively.
The injection of turpentine oil caused a significant increase in all positive APPs studied and a decrease in albumin, which is a negative APP (Table 3). Serum Hp concentrations increased 80-fold from a value of 0.02 g/l (which is the limit of detection of the assay) on day 0 to reach a peak of 1.58 g/l 3 days after turpentine administration. Serum amyloid A concentrations showed a rapid increase from a preinjection value of 4.88 mg/l to reach a peak of 107.8 mg/l 24 hr after injection (a 22-fold increase). Concentrations of ASG reached a peak 4 days after the injection and showed a 2-fold increase. Fibrinogen concentrations increased 3.5-fold at its peak value (7 g/l), which was observed on day 3. Albumin showed a significant decrease (7.5%) 2 days after turpentine injection.
Parameters of the linearity under dilution of haptoglobin (Hp), serum amyloid A (SAA), and acid soluble glycoprotein (ASG) in goats.
Discussion
The acute phase response has been studied in ruminant species such as cow and sheep, and Hp and SAA are considered the most important and useful indicators of inflammatory processes in these 2 animals. 1,12 To the authors' knowledge, there is only 1 report in goats where Hp and ceruloplasmin were measured around parturition. 28 Therefore, it was of interest to perform an analytical and clinical validation study of APP assays for possible use as inflammatory markers in goats.
Haptoglobin was measured using an automated colorimetric method, and the precision results obtained in the present study were similar to those obtained for other animal species such as dogs and swine. 18,25 Also, similar CVs were obtained when the ASG method of the present study was applied to swine specimens. 26 Although previous studies reported CVs over 20% for ASG determination in humans, 17,23 this could be caused by the use of manual procedures in these assays. In the present study, the highest imprecision was found in the SAA assay, which yielded an interassay CV of 12.68%. However, these values were lower than those obtained with the same kit in other veterinary species, such as dogs 19 (16.4%) and cows 11 (16.6–18.6%), and would not have clinical relevance in cases of large differences between samples with low and high SAA concentrations. 25
Ideally, precision studies should be performed using an additional serum pool from healthy animals. However, this protocol could not be followed in the current study because Hp concentrations are negligible in the majority of healthy animals. Otherwise, very high imprecision values were found for SAA in healthy animals (data not shown), which could have been caused by SAA values that were close to the detection limit of the assay.
To the authors' knowledge, no reference material or standards for APPs in goats are commercially available; therefore, analytical accuracy was indirectly estimated by linearity assays. Linearity under dilution showed high regression coefficients, indicating that all assays measured each APP in a linear manner. The limit of detection of the methods used in the present study was in agreement with those obtained previously. 8,18,25 Fibrinogen measured by the heat precipitation method showed higher CVs and poorer results in the studies of the linearity under dilution compared with the assays for other APP quantification tested in our study. These results could be explained because fibrinogen measurement by heat precipitation method is a manual procedure. Although this method was cheap and simple to perform, it would be desirable in the future to develop and validate spectrophotometric or immunological methods for fibrinogen determination that are more precise and accurate. In addition, it would be desirable to develop and use species-specific calibrators that could improve the APP assays, especially the immunological assay, such as that for SAA.
Changes in the serum concentration of all APPs studied were observed when inflammation was experimentally induced by subcutaneous turpentine administration. The greatest increase was seen in Hp concentration. An increase in Hp was observed 24 hr after turpentine administration, but this increase was not significant until 72 hr, possibly because of the great interindividual variability observed in concentrations of this protein. The maximum peak of 80-fold at 72 hr indicated a major response of Hp. This finding could be caused by the almost negligible Hp values observed in healthy animals, as has been previously described in other ruminants such as sheep 22 and cows. 4 This major response of Hp during inflammation has also been described in cows after turpentine administration 4 and sheep with experimentally induced pneumonia. 22
Response of acute phase proteins to an inflammatory stimulus in goats.*
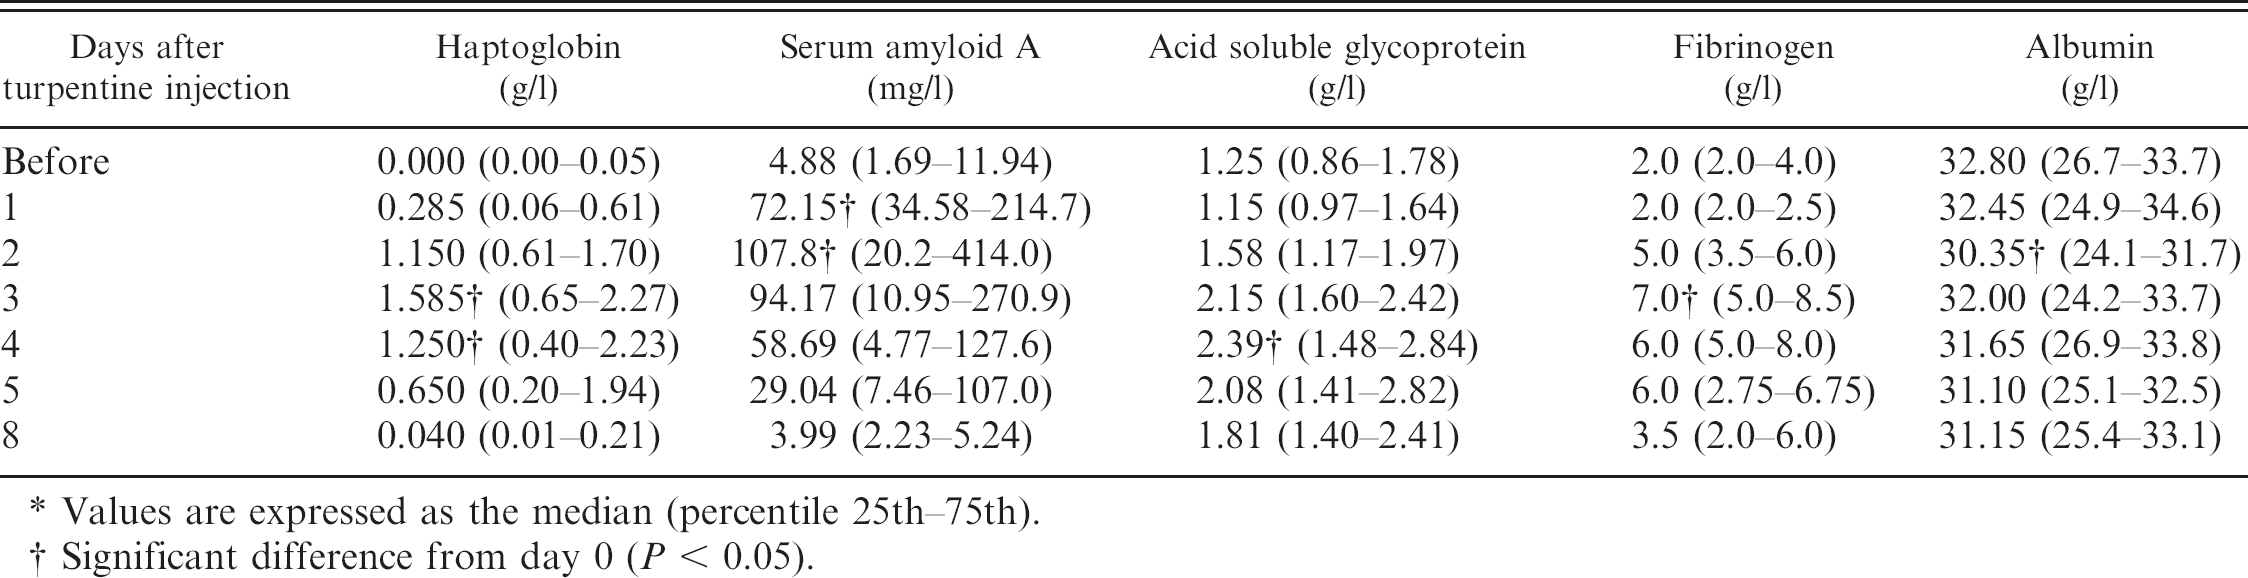
Values are expressed as the median (percentile 25th-75th).
Significant difference from day 0 (P < 0.05).
Turpentine produced an increase in SAA concentration at 24 hr postinoculation. This result suggested a faster response of this protein after an inflammatory stimulus as compared with other APPs. Therefore, SAA could be a good indicator of acute inflammation. The early response of SAA, as compared with other APPs such as Hp, has been described in cattle affected by different inflammatory conditions. 13–15 A maximum peak, with a 22-fold increase, was observed at 48 hr, which is lower than the response obtained for Hp. Previous reports have detected moderate increases (4.7- and 16-fold, respectively) of this protein in cows suffering inflammation from experimental infection with Bovine respiratory syncytial virus 13 or mastitis. 16 Although preinjection values were not recovered until day 8, the high SAA concentrations observed on days 3, 4, and 5 were not statistically significant. This was possibly caused by high variability in the results among individuals. It should be pointed out that 1 out of 6 goats did not show any increase in SAA after turpentine administration, whereas the remainder of APPs measured showed significant changes. Further studies are desirable to clarify this lack of SAA response in animals subjected to inflammatory stimulus.
A 2-fold increase was observed in ASG concentration at 96 hr after turpentine injection. The very mild response observed in the current study for this protein was similar in magnitude and time of appearance previously observed in cattle with experimentally induced inflammation, 4 acute clinical mastitis, enzootic bovine leukosis, or after surgery. 21 Acid soluble glycoprotein showed an extended response compared with SAA and Hp, which is in agreement with a recent work that suggests ASG could have a role as marker for chronic conditions in sheep. 9
Fibrinogen showed a very mild response (maximum 3.5-fold increase at 72 hr after the inflammatory stimulus) in the current study. A response of similar magnitude has been previously described in calves. 4 Serum albumin showed a moderate (<10%) but significant decrease at 48 hr after turpentine injection in the current study. A similar behavior has been described in calves. 4 Based on these results, albumin is a negative APP in goats because its concentration declines following an inflammatory condition.
Positive APPs can be classified into major (>10-fold increase) and moderate (2-10-fold increase) reactants by the magnitude of their response to inflammatory stimuli. 3,6 Results obtained in the present study indicate that Hp and SAA could be considered as major APPs, while ASG and fibrinogen may be considered as moderate APPs in goats.
In conclusion, the methods evaluated in the current report for Hp, SAA, ASG, and albumin measurements could be successfully applied in goats, and these proteins could be used as valuable indicators of inflammation in this species. Further investigations would be desirable to find more precise and accurate assays to measure fibrinogen than the heat precipitation method. In addition, it would be of interest to study the behavior of the different APPs in inflammatory diseases affecting animals under field conditions and the possible correlation between the magnitude of APP increase and the severity of inflammation.
Acknowledgements
The present study was supported by the Seneca Foundation from the Regional Government of Murcia (Spain) and by the National Council for Scientific and Technological Development (CNPq) from Brazil.
Footnotes
a.
Dipistol S.A., Barcelona, Spain.
b.
Deltalab S.L., Barcelona, Spain.
c.
Phase Haptoglobin Assay, Tridelta Development Limited, Maynooth, County Kildare, Ireland.
d.
Albumin Kit, SPINREACT S.A., Gerona, Spain.
e.
Cobas Mira Plus Analyzer, Horiba ABX, Montpellier, France.
f.
Phase SAA Kit, Tridelta Development Limited, Bray, Ireland.
g.
Power Wave XS, BioTek Instruments Inc., Winooski, VT.
h.
SPSS statistical program, SPSS Inc., Chicago, IL.