
Abstract
Senecavirus A (SVA; family Picornaviridae) is a nonenveloped, single-stranded RNA virus associated with idiopathic vesicular disease (IVD) in swine. SVA was detected in pigs with IVD in Brazil, United States, Canada, and China in 2015, triggering the need to develop and/or validate serologic assays for SVA. Our objective was to fully validate a previously developed competitive enzyme-linked immunosorbent assay (cELISA) as a screening test for antibodies to SVA. Additional objectives included the development and validation of a virus neutralization test (VNT) as a confirmatory test for SVA antibody detection, and the comparison of the cELISA, VNT, and an existing immunofluorescent antibody test (IFAT) for the detection of SVA antibodies in serial bleeds from SVA outbreaks. The diagnostic specificity and sensitivity were 98.2% (97.2–98.9%) and 96.9% (94.5–98.4%) for the cELISA, and 99.6% (99.0–99.9%) and 98.2% (95.8–99.4%) for the VNT, respectively. There was strong agreement among cELISA, VNT, and IFAT when compared based on kappa coefficient. Based on these performance characteristics, these tests are considered suitable for serologic detection of SVA in pigs.
Senecavirus A (SVA), formerly known as Seneca Valley virus, is a nonenveloped, single-stranded RNA virus of the same family (Picornaviridae) as Foot-and-mouth disease virus (FMDV) and swine vesicular disease virus (SVDV). 4 SVA was first isolated as a contaminant in cell culture media in 1988. Subsequently, the virus was isolated from pigs in the United States 4 and was suspected to have caused anorexia, lethargy, lameness, and vesicular lesions in a boar in 2010. 11 In 2007, vesicular lesions were observed in market pigs at a Minnesota slaughter facility, and SVA was detected in these pigs; the pigs were traced to 7 farms in Manitoba, Canada. 9
In late 2014, SVA infections were observed in grower–finisher pigs and breeding herds in the United States and Brazil. Additionally, neonatal mortality was observed in piglets (<7 d old), and SVA was isolated from lesions in these cases. In a shift from previous reports wherein other swine viruses were detected alongside SVA in pigs with idiopathic vesicular disease (IVD), 1 SVA was the sole virus isolated from some of the clinical cases in Brazil and the United States.5–7,12 Similarly, pigs with ulcers in the nostrils and mouth accompanied by loss of appetite, lameness, plus mortalities of newborn piglets were observed in Guangdong Province in China in 2015. SVA was detected in pooled samples from these pigs. 14 Prior to 2015, Koch postulates had not been fulfilled for SVA. 15 However, in 2015, vesicular lesions were observed in an experimental infection of 9-wk-old pigs with SVA alone. 8
Following the detection of SVA in pigs in Canada in 2007, 9 there was an urgent need to develop a simple, scalable serologic assay for SVA. As a result, SVA-specific monoclonal antibodies (mAbs) were produced and characterized, with the goal of developing a competitive enzyme-linked immunosorbent assay (cELISA) and/or immunohistochemistry for SVA detection. 15 A cELISA was successfully developed using the best of the produced mAbs, and it proved potentially useful for detection of SVA antibodies in pigs and other animals. 15 However, the assay was not fully validated because of limited numbers of negative, and especially positive, sera. Thus, the objective of our study was to fully validate the previously developed cELISA, as well as develop and validate a virus neutralization test (VNT) as a confirmatory test for SVA antibody detection. Furthermore, the cELISA and VNT were compared with an immunofluorescent antibody test (IFAT) previously validated at the Veterinary Diagnostic Laboratory, University of Minnesota (VDL-UMN; St. Paul, Minnesota); https://goo.gl/rbzIkn). For our study, SVA and antigen were produced as described previously.10,13,15
SVA-negative sera were obtained from a variety of sources. Sera from specific pathogen–free (SPF) pigs were obtained from the Ontario Laboratory Fallowfield, Canada (n = 44) and ANSES, Ploufragan laboratory, Ploufragan, France (n = 61). Sera were also obtained from farms in Canada with no history of clinical signs of vesicular disease (n = 909). Serial bleeds and positive sera (n = 37) were obtained from experimentally infected pigs. 15 Positive sera, with VNT titers >2,880 (n = 4) as determined by a method described previously, 15 were also obtained from a farm in Canada where cases of IVD linked to SVA had been confirmed by isolation and characterization of the virus in 2015. Additional sera, characterized as positive for antibodies to SVA by IFAT (n = 232), were provided by the VDL-UMN. These samples were collected from SVA-affected animals at 6 times post-peak of the clinical signs (days 7, 10, 25, 40, 60, and 180) during outbreaks in 2015 in 2 sow farms in the United States.
Tests for analytical specificity were performed with sera from pigs experimentally inoculated with vesicular disease viruses including FMDV, SVDV, and vesicular stomatitis virus (VSV).
The presence of SVA neutralizing antibodies in sera was determined using swine testis (ST) cells. a The stock virus was first passaged twice in ST cells to adapt SVA to this cell line. The ST cell–adapted virus was further grown in ST cells to generate stock virus for VNT. The VNT was then performed as described previously 15 using negative and positive pig sera.
The cELISA was performed using the same mAb and procedure as described previously. 15 However, the results were expressed as percent inhibition (PI) relative to the diluent control using the following formula: PI = [(diluent control OD – test sample OD)/(diluent control OD – positive reference serum OD)] × 100%, where OD indicates the optical density.
For IFAT, monolayers of human lung cancer NCI-H1299 cells a were cultivated and inoculated with a SVA strain isolated in 2015 from a U.S. outbreak. Infected cells were washed with phosphate-buffered saline (PBS) and fixed in cold acetone for 30 min at 4°C. Fixed cells were incubated with 2-fold dilutions of serum from 1:40 to 1:320 at 27°C for 1 h. The plates were washed 3 times with PBS. Fluorescein-labeled goat anti-pig immunoglobulin G (IgG) b was diluted 1:50 in PBS, added into the wells, and incubated at 37°C for 1 h. The cells were observed under fluorescence microscopy. A positive signal at a sample dilution of 1:40 or higher was considered to be positive.
Data were analyzed, and graphs were generated using commercial software. c The diagnostic sensitivity and specificity for each data point was evaluated by the receiver operating characteristic (ROC) curve analysis at a 95% confidence interval. Cohen kappa coefficients were calculated to evaluate inter-rater agreement among VNT, cELISA, and IFAT.
A total of 1,014 negative sera and 273 positive sera were tested for neutralizing antibodies to SVA by VNT (Fig. 1A). The cutoff was set at VNT titer ≥64 for a sample to be considered positive for neutralizing antibodies to SVA, and the diagnostic specificity and sensitivity were 99.6% (99.0–99.9%) and 98.2% (95.8–99.4%), respectively.
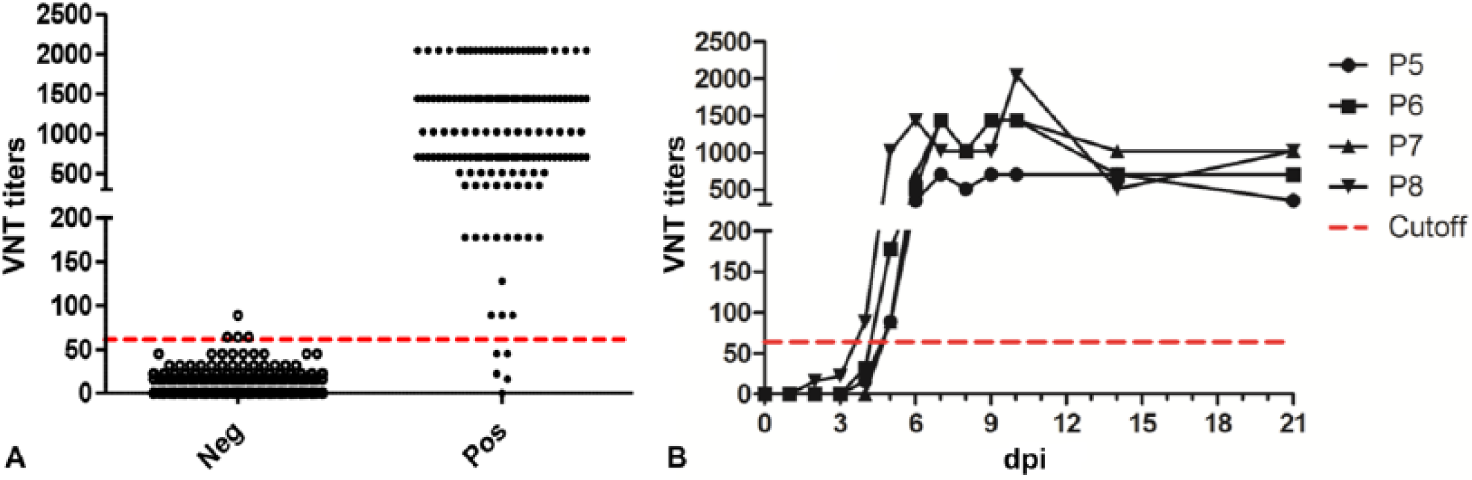
Distribution of virus neutralization test (VNT) titers for Senecavirus A (SVA) antibody-negative and -positive serum samples.
All of the sera from FMDV-, SVDV-, and VSV-infected pigs were negative for neutralizing antibodies to SVA by VNT (data not shown), indicating 100% analytical specificity. Positive antibody detection started at 4 d postinfection (dpi) in 1 pig and 5 dpi in 3 pigs (Fig. 1B).
The same negative and positive sera used for VNT were tested for antibodies to SVA by the cELISA (Fig. 2A). Following ROC analysis, to maintain a high diagnostic specificity without affecting the diagnostic sensitivity, the cutoff of PI ≥60% was selected for a sample to be considered positive. The diagnostic specificity and sensitivity were 98.2% (97.2–98.9%) and 96.9% (94.5–98.4%), respectively.
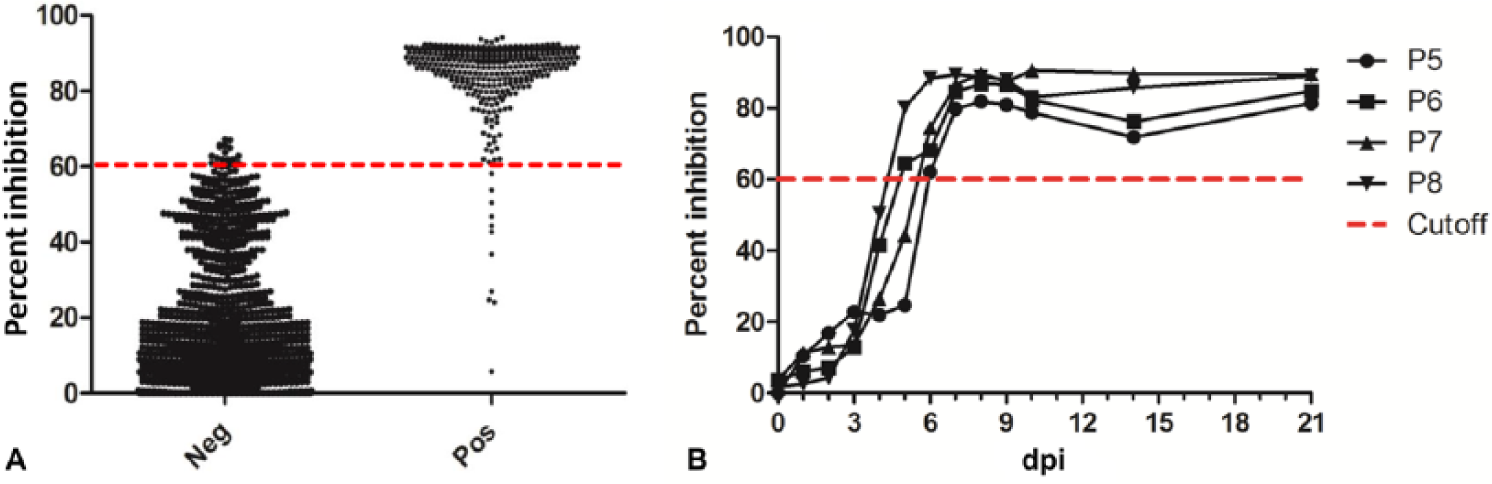
Distribution of Senecavirus A (SVA) antibody-negative and -positive serum samples.
Similar to VNT results, all of the sera from FMDV-, SVDV-, and VSV-infected pigs were negative by the SVA cELISA (data not shown), indicating 100% analytical specificity. Positive antibody detection started at 5 dpi in 2 pigs and 6 dpi in 2 pigs (Fig. 2B). Time of first positive detection was identical between cELISA and VNT in 2 pigs and a day earlier for VNT in 2 pigs.
The cELISA, IFAT, and VNT were compared over time during an outbreak in 2 sow farms. Sera collected for routine screening 120 d before the peak of the clinical signs were used as negative controls. Sera from affected animals were collected and tested at 6 times post-peak of the clinical signs (days 7, 10, 25, 40, 60, and 180; Fig. 3). Comparison based on kappa coefficient showed strong agreement among all 3 serologic assays (Table 1). Humoral immune response was consistent 7–60 d after the peak of clinical signs. Increased variation and subsequent decline of antibody titers were observed on day 180. However, the majority of the animals still showed positive titers by IFAT (47 of 60; 78%), cELISA (48 of 60; 80%), and VNT (51 of 60; 85%).
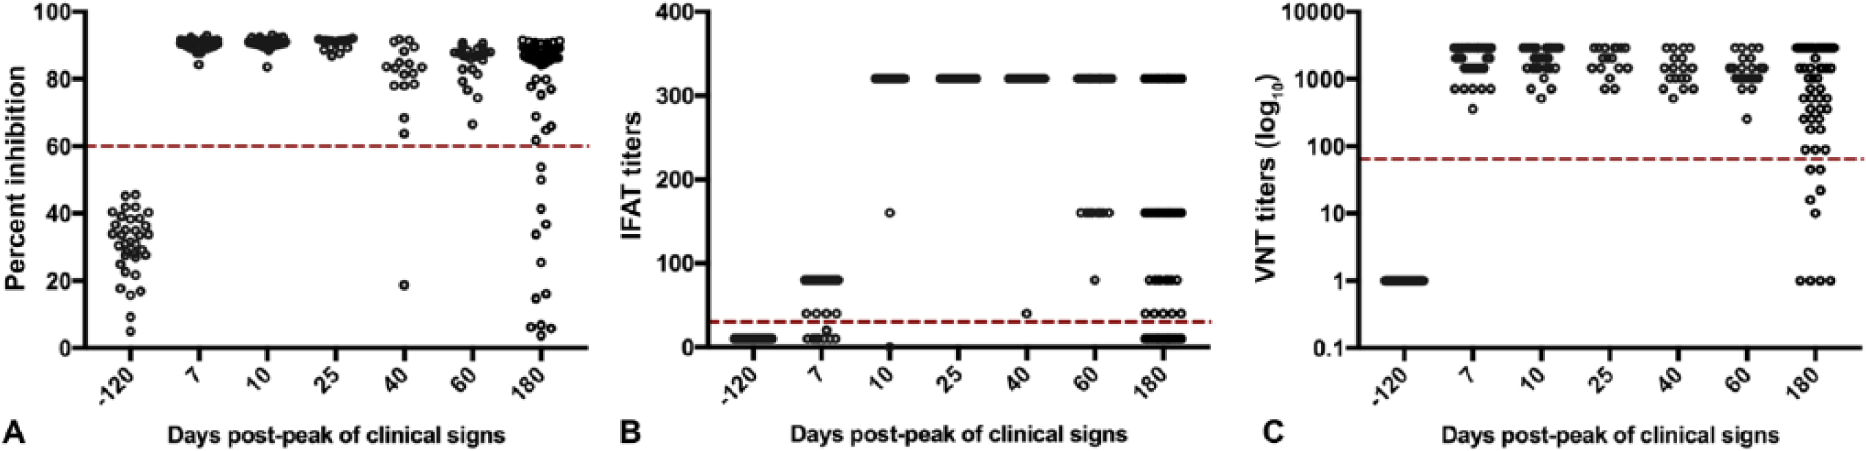
The serologic response in sera from sows during a Senecavirus A (SVA) outbreak measured by competitive ELISA (cELISA), immunofluorescent antibody test (IFAT), and virus neutralization test (VNT). Serum samples collected before and at specific times post-peak of the clinical signs from affected sows during SVA outbreaks in 2 sow farms, and the antibody response trends were measured by cELISA (
Comparison of the competitive ELISA (cELISA), immunofluorescent antibody test (IFAT), and virus neutralization test (VNT) for Senecavirus A.*
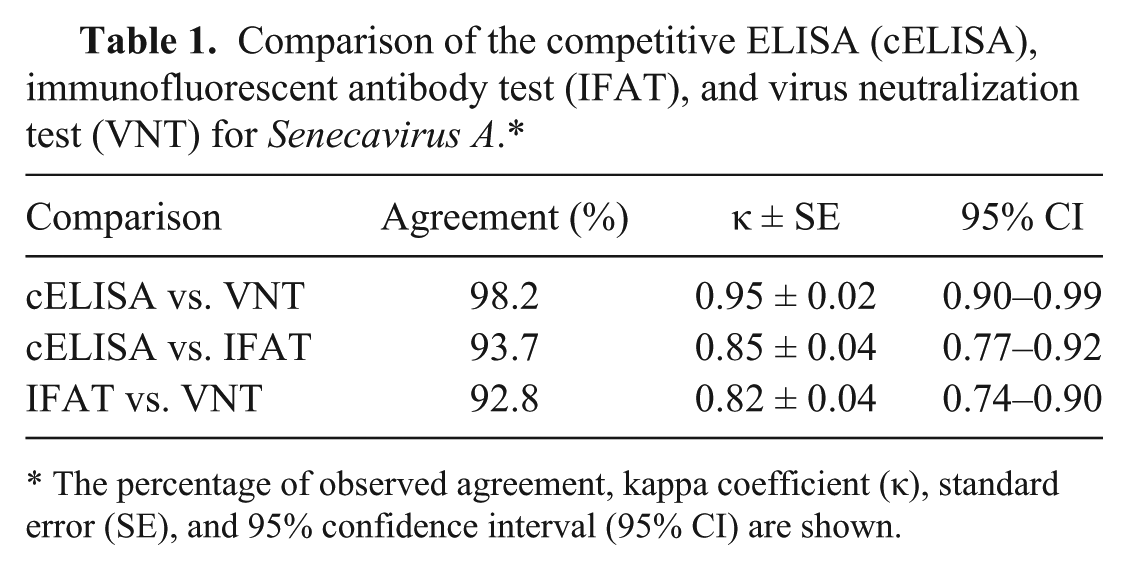
The percentage of observed agreement, kappa coefficient (κ), standard error (SE), and 95% confidence interval (95% CI) are shown.
The SVA cELISA developed previously 15 has been further validated using 1,014 negative and 273 positive sera. The cutoff for the validated cELISA is higher than reported previously, perhaps as the result of the increased size and variety of samples. Additionally, the PI has been calculated based on the diluent control as opposed to a standard negative control serum that has the potential for nonspecific inhibition. 15 Although the cutoff is currently at 60%, PI between 50 and 59 should be considered suspicious and the cELISA repeated or the sample tested by VNT. A recombinant VP1 antigen-based IgG ELISA has also been successfully developed for the detection of IgG response to SVA in pigs, with sensitivity and specificity of 93% and 99%, respectively. 3 However, the cELISA described herein has a higher sensitivity (96.9%). Furthermore, the capability of the cELISA to detect antibodies from different species can be exploited considering that antibodies to SVA have been detected in cattle, wild mice, and humans receiving SVA as anticancer treatment. 2
Previous reports used NCI-H1299 cells for VNT, 15 though other cells, including ST and SK-RST, support the growth of the virus, albeit to lower titers.10,15 However, in preliminary tests, cytopathic effect was more visible in ST cells compared to NCI-H1299 cells. Consequently, ST cells may be a better substrate for SVA VNT. With 1,014 negative and 273 positive sera and a cutoff VNT titer of 64, the diagnostic specificity of 99.6% and diagnostic sensitivity of 98.2% make this an excellent confirmatory test for serologic detection and confirmation of antibody response to SVA.
An IFAT with sensitivity of 90% and specificity of 100% is currently in use at VDL-UMN (https://goo.gl/rbzIkn). The strong agreement among IFAT, cELISA, and VNT results supports the use of each test as a detection tool for SVA. However, the cELISA has advantages over the other tests in that it is quicker, simpler, and cheaper to perform, and does not rely on microscopy, allowing greater scale-up of testing and thus can be used for routine screening of herds.
Footnotes
Acknowledgements
We thank Kate Hole, Tim Salo, Hilary Bittner, and Diana Lusansky for technical help. We also thank Mike Kelly, Ontario Laboratory Fallowfield, and Dr. Andre Broes, BioVet Inc., for providing sera from specific pathogen–free and SVA-free pigs.
Authors’ contributions
M Goolia contributed to design of the study and to acquisition of data. F Vannucci contributed to conception and design of the study and to analysis and interpretation of data. M Yang contributed to conception and design of the study and to interpretation of data. D Patnayak contributed to conception and design of the study and to acquisition of data. S Babiuk contributed to conception of the study and to interpretation of data. CK Nfon contributed to conception and design of the study, contributed to analysis and interpretation of data, drafted the manuscript, and gave final approval. All authors critically revised the manuscript and agreed to be accountable for all aspects of the work in ensuring that questions related to the accuracy or integrity of any part of the work are appropriately investigated and resolved.
a.
American Type Culture Collection, Rockville, MD.
b.
KPL, Gaithersburg, MD.
c.
Prism version 6.00 for Windows, GraphPad Software, La Jolla CA.
Declaration of conflicting interests
The author(s) declared no potential conflicts of interest with respect to the research, authorship, and/or publication of this article.
Funding
The author(s) disclosed receipt of the following financial support for the research, authorship, and/or publication of this article: Funding for this work was provided by the Canadian Food Inspection Agency.