
Abstract
Aflatoxins are potent mycotoxins with effects that include hepatotoxicity, immunosuppression, and suppression of animal growth and production. The etiologic diagnosis of aflatoxicosis, which is largely based on analysis of contaminated feed matrices, has significant disadvantages given the fact that representative feed samples may not be available and feed-based test methods are not confirmatory of an etiologic diagnosis. A tissue-based analytical method for biomarkers of exposure would be valuable for confirmation of aflatoxicosis. We describe in-house development and evaluation of a high-performance liquid chromatographic method with fluorescence detection and precolumn derivatization for determination of aflatoxins M1, B1, B2, G1, and G2 in animal liver. The method demonstrates good selectivity for the tested aflatoxins in the liver matrix. The overall range was 0.03–0.10 ng/g for limit of detection and 0.09–0.18 ng/g for limit of quantitation. The correlation coefficient (R2) of calibration curves was >0.9978 for AFM1, 0.9995 for AFB1, 0.9986 for AFB2, 0.9983 for AFG1, and 0.9980 for AFG2. For fortification levels of 0.2–10 ng/g, repeatability was 10–18% for AFM1, 7–14% for AFB1, 5–14% for AFB2, 6–16% for AFG1, and 10–15% for AFG2. Recovery was 52–57% for AFM1, 54–62% for AFB1, 55–61% for AFB2, 57–67% for AFG1, and 61–65% for AFG2. There was no liver matrix effect found. The method is rugged against minor changes based on the selected factors. The results indicate that the proposed method is suitable for quantitative determination of aflatoxins M1, B1, B2, G1, and G2 in liver.
Introduction
Aflatoxins B1, B2, G1, and G2 are mycotoxin derivatives of difuranocoumarin produced by many species of molds that grow on high-carbohydrate feeds. The main aflatoxin producers include Aspergillus fungal species, such as A. flavus and A. parasiticus, and Penicillium fungal species, such as P. puberulum. 34 Aflatoxins, as well as other mycotoxins, are secondary metabolites of fungi, and their function is not well known.13,23 Aflatoxin-generating fungi have been found in a wide variety of feeds and feed ingredients including grains 7 (e.g., barley and corn), rice, brazil nuts, pistachio nuts, peanuts and peanut products, wheat flour, and other food products such as figs, date fruits, and spices. 23 Of the animal feed ingredients, corn, peanuts, cotton seed, and dried distiller grains pose the highest risk of aflatoxin contamination. 7 In feed commodities, the order of abundance from highest to lowest concentration is aflatoxin B1 (AFB1) > aflatoxin G1 (AFG1) > aflatoxin B2 (AFB2) > aflatoxin G2 (AFG2). 34 Once ingested, aflatoxins are absorbed and metabolized to other aflatoxin metabolites. These metabolites react with protein and DNA forming adducts that impair animal health. AFM1 is a major hydroxylated metabolite of AFB1 in animals, including humans, livestock, pets, and poultry.13,14
In veterinary medicine, aflatoxicosis has been reported in virtually all species, including pets, livestock, poultry, and fish. Dogs, ducks, and fish are extremely sensitive to aflatoxins. The toxic outcome depends on the amount and frequency of exposure. Chronic aflatoxicosis in pets, especially dogs, is a well-recognized disease.10,30,34 Chronically intoxicated dogs exhibit lethargy, jaundice, anorexia, weight loss, polyuria and polydipsia, and bleeding disorders17,34 Feeding aflatoxin-contaminated feeds causes reduced growth rates in animals. 34 Aflatoxins are also mutagenic,23,45 carcinogenic,15,23 teratogenic,11,23 and immunosuppressive. 33 Overall, aflatoxins exact significant negative health and economic impacts in livestock. They are a common cause of illness and death in pets that ingest contaminated feeds.5,17,30,35 Aflatoxins have been confirmed by the International Agency for Research on Cancer as human carcinogens, responsible for causing hepatocellular carcinoma, more frequently in developing countries.9,22
Considering the significant toxicity and negative health impacts of aflatoxins, various tests and procedures are currently in use for diagnosis of aflatoxicosis in animals. Test methods are currently available for determination of aflatoxins in animal feeds,12,16,19,21,38,39,41,43 in aqueous matrices, 26 and milk.6,10,27,29,37,46 These tests are used in conjunction with serum chemistry profiles showing elevated liver enzyme activity, and in case of deceased animals, liver lesions. 31 However, there are many challenges in using feed samples for the etiologic diagnosis of aflatoxicosis. For example, in most cases, the causal feed has already been consumed and is no longer available for testing. Hence, there is usually a lack of “representative” feed samples for testing. Also, histopathology findings such as lipidosis and bile duct proliferation or elevated serum liver enzymes, although suggestive, are not pathognomonic of aflatoxicosis. For all these reasons, there is a need for a tissue-based analytical method to detect and quantify aflatoxins and/or their metabolites to aid in the diagnosis of aflatoxicosis in deceased animals. Demonstrated presence of aflatoxins in tissues along with consistent clinical signs, elevated liver enzymes in serum, and/or liver histopathology will provide veterinarians with information needed for a solid diagnosis of aflatoxicosis.
AFB1, the most prevalent and potent aflatoxin in feeds, is a frequent cause of animal intoxications. It is metabolized in the liver to AFM1, which is excreted through milk and/or urine in mammals. AFM1 is recognized as a reliable biomarker of AFB1 exposure in humans.24,47,49 AFM1 is also used as a biomarker of AFB1 exposure in milk and milk products.6,10,27,29,37,46 Currently, there are no established test methods for detection and quantitation of aflatoxins in liver for veterinary applications. Existing methods are feed-based and are not ideal for tissue application. We have extended this observation by developing and evaluating a liver-based method for detection and quantitation of AFM1, AFB1, AFB2, AFG1, and AFG2 using a simple, affordable, and more efficient clean-up procedure and high-performance liquid chromatography (HPLC)–fluorescence detection. We chose HPLC–fluorescence because we know from experience that this is the most sensitive means to detect and measure aflatoxins. Parameters evaluated included limit of detection (LOD), limit of quantitation (LOQ), selectivity, repeatability, recovery, matrix effect, and ruggedness. We also investigated liver matrix effects in this study because it is well known that matrix effects could affect the quality of analytical results.
Materials and methods
Instrumentation
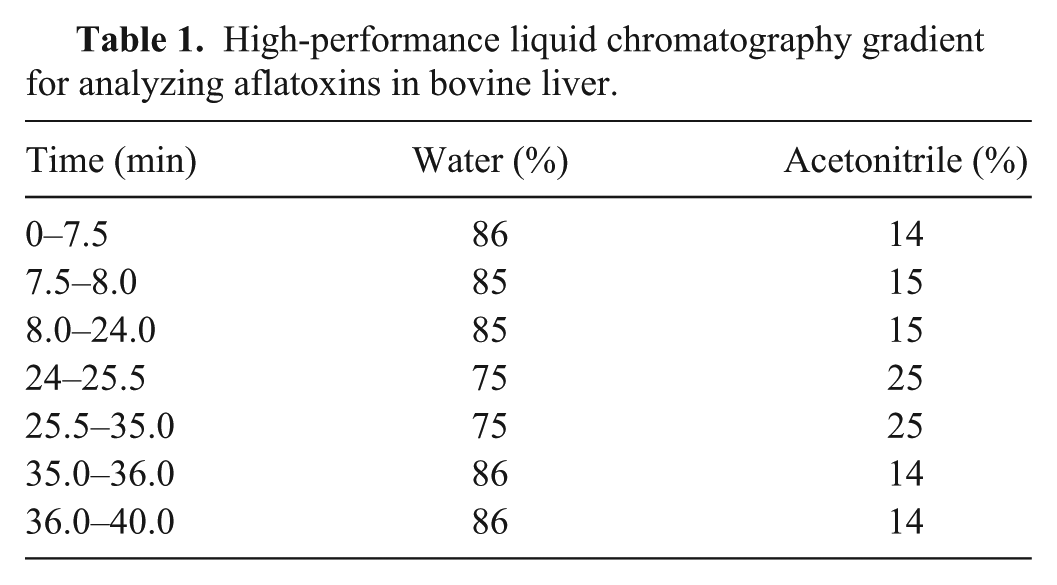
Measurements were performed with an HPLC system a equipped with a computer with an interface for system manipulation, data acquisition, and analysis, as well as a fluorescence detector a using a C18 column b and a C18 guard column. c The mobile phase consisting of 18.2 Mohm·cm water d and acetonitrile e was pumped at a flow rate of 1 mL/min. A gradient elution was used to give optimal separation (Table 1). A total run time of 40 min was used. The injection volume was 20 µL. The separation was performed at room temperature. The optimized excitation and emission wavelengths for the fluorescence detector were 360 and 440 nm, respectively.
High-performance liquid chromatography gradient for analyzing aflatoxins in bovine liver.
Samples
Experiments were performed using bovine and porcine liver samples, in order to determine if the method could perform well in multiple species. Bovine liver was purchased from the local market. Aflatoxin-negative porcine liver samples were collected from regular diagnostic case submissions at the Veterinary Diagnostic Laboratory, Iowa State University (Ames, Iowa). Liver was blended by a single-speed blender. f
Chemicals and reagents
All aqueous solutions were prepared in 18.2 Mohm·cm water. d The following reagents were used: acetonitrile, methanol, dichloromethane, glacial acetic acid, trifluoroacetic acid, citric acid monohydrate, sodium sulfate anhydrous, alumina neutral (60–325 mesh) e ; diatomaceous earth g ; octadecyl (C18) 40-μm preparation of LC packing h ; and AFM1, AFB1, AFB2, AFG1, and AFG2 standards. i Citric acid solution (20%) was prepared by dissolving 20.0 g citric acid monohydrate in water and bringing the total volume to 100 mL. Acetonitrile:water (90:10, v/v) was prepared by adding 10 mL of water to 90 mL of acetonitrile and mixing well. The packing material of mixed-phase clean-up columns consisted of C18:alumina neutral (50:50, w/w), which was prepared by mixing 50 g of C18 LC packing and 50 g of alumina neutral and manually shaking for 5 consecutive min. The packaging material was manually shaken for 5 s at a pace of 1 shake per second before each use. C18:alumina neutral (50:50, w/w) clean-up columns were prepared in house by weighing 1.5 g of C18:alumina neutral (50:50, w/w) into 6-mL plastic syringes. The packing was immobilized by filter discs i on both ends. Water:trifluoroacetic acid:glacial acetic acid (35:10:5, v/v) was prepared by mixing 10 mL of trifluoroacetic acid with 5 mL of glacial acetic acid and 35 mL of water and vortexing at maximum speed for 10 sec. It was protected from light by a layer of aluminum foil wrap. A mixed aflatoxin intermediate standard solution (250 ng/mL for each aflatoxin) was prepared by using stock standard solutions, evaporating the solvents to dryness under nitrogen, and diluting to 5 mL with methanol. This mixture of intermediate solution is stable for 1 month when stored at −20°C when not in use. A working standard solution of 25 ng/mL was prepared on the day of use by subsequent dilution of 1 mL of the 250 ng/mL standard solution using methanol and then bringing the volume to 10 mL.
Sample preparation
The method for sample preparation was adapted from published extraction methods,1,42 with some modifications. Briefly, we used a much smaller sample size (~1.0 g) instead of 50 g 42 or 100 g 30 recommended in the original methods. This was possible because our method showed good sensitivity and low LOD (pg/g level). Another improvement was adding a wash step after filtration, with sodium sulfate anhydrous. This wash step increased recovery significantly for all aflatoxins. Likely this step increased the amount of aflatoxins collected by reducing aflatoxins retained in the filtration device. The mixed-phase clean-up procedure was performed by using a C18:alumina neutral (50:50, w/w) column prepared in-house. We recommend this approach because it provides a more affordable option than the widely used but otherwise relatively expensive immunoaffinity columns.27,29 A rinse step with 5.0 mL of acetonitrile:water (90:10, v/v) was added prior to loading the mixed-phase clean-up columns with testing solutions. This was performed in order to further clean up polar interferences that could otherwise co-elute with AFM1.
For evaluation purposes, samples other than liver matrix blanks were fortified with AFM1, AFB1, AFB2, AFG1, and AFG2 before extraction, using a composite aflatoxin working standard consisting of 25 ng/mL of each aflatoxin. The fortified samples were vortex-mixed for 10 s for even mixing before sample preparation. Each liver sample was then vortex-mixed with 1,000 µL of 20% citric acid solution, incubated at room temperature for 10 min, and vortex-mixed again. Diatomaceous earth g (0.20 g) was subsequently vortex-mixed with the sample for 10 s. The mixture was extracted with 20.0 mL of dichloromethane by rotary-mixing for 35 min. The mixture was then centrifuged at 842 × g for 10 min. The bottom clear layer was subsequently aspirated and passed through 7.20 g of sodium sulfate anhydrous housed in a glass fiber filter and a polymer funnel. The filtrate was collected in a clean 50-mL tube. The sodium sulfate was subsequently washed with 6.0 mL of dichloromethane, and the wash was combined with the solution from the previous step. The combined solution was evaporated to dryness under nitrogen at ambient temperature.
The dried extracts were cleaned up using the following procedure (GE Rottinghaus, pers. comm., 2015). Extracts were first reconstituted with 5.0 mL of acetonitrile:water (90/10, v/v) and vortex-mixed for 10 s. An in-house prepared mixed-phase clean-up column (C18:alumina neutral, 50:50, w/w) was rinsed with 5.0 mL of acetonitrile:water (90:10, v/v) as preconditioning. The rinse was discarded. The reconstituted extracts were then loaded onto the mixed-phase clean-up columns and allowed to flow through the column by gravity. The rinse was eluted into 7-mL glass vials. After the solution had drained out of the column, the plungers were pushed down the barrels of the syringes to drive out the residual liquid in the column. The residual eluents were collected in the same vials. The cleaned-up extracts were subsequently concentrated to dryness under nitrogen. The dried extracts were then subjected to a derivatization procedure adapted from an AOAC method. 2 Briefly, the extracts were reconstituted in 400 μL of water:trifluoroacetic acid:glacial acetic acid (35:10:5, v/v), vortexed for 10 s, and heated at 65°C in heating dry bath for 15 min for derivatization. The major modification was that the mixtures were incubated for 12–16 h at ambient temperature before HPLC injection.
Evaluation protocol
Selectivity was evaluated by testing the liver sample fortified with each standard in triplicate in each run, for a total of 3 runs. When peaks were free of interference, it was an indication of good selectivity. In our case, selectivity was determined by testing liver samples fortified at 0.2 ng/g, which is usually considered more challenging than higher levels. A control liver matrix was tested as well for the purpose of interference examination.
For evaluation of the method LOD and LOQ, 20 negative control liver samples were extracted and analyzed.4,40 The mean blank response and standard deviation (SD) corresponding to the elution times of each aflatoxin was calculated. LOD was expressed as (mean) + 3 × SD,4,40 and LOQ was expressed as (mean) + 10 × SD.4,40 The intensity signals were converted to concentration units using calibration curves established in fortified liver samples.
Repeatability was determined from 3 different runs of analyses, with each run consisting of 3 replicates fortified at 0.2, 2.0, and 10 ng/g aflatoxins, respectively. The relative SD (RSD) was used to evaluate repeatability. It was compared with the Horwitz ratio, which is a reference value for repeatability at various concentrations of interest.20,25 A Horwitz ratio of 0.5–2 normally indicates satisfactory repeatability.
Recovery was evaluated by calculating the ratio of the peak area of liver samples fortified before extraction to those of liver samples fortified after extraction.3,8,18 Both types of sample preparations were subsequently subjected to the same derivatization and HPLC procedure. Recovery was evaluated concurrently with repeatability. Therefore, a mean value ± SD was calculated to represent recovery for each level of each run based on 3 replicates. A mean ± SD was used to express the overall recovery for each level over all 3 runs.
The matrix effect of liver was determined by calculating the ratio of the peak area obtained from negative control bovine liver samples fortified with aflatoxins at 2.0 ng/g after sample preparation to the peak area obtained with the same amount of aflatoxin prepared in methanol. 18 The matrix effect was based on 3 replicates of each type. Both types of samples were subsequently subjected to the same derivatization and HPLC procedure. Normally, a lack of matrix is indicated if the ratio falls within 100% ± (15–20%).18,28,32
The last parameter that we investigated was ruggedness, which is a measure of the resiliency of the method to withstand minor deviations from the prescribed procedure. We evaluated the following factors: extraction time, amount of dichloromethane, amount of packing material for mixed-phase clean-up cartridge, source of trifluoroacetic acid, heating time for derivatization, derivatization temperature, and postderivatization incubation time. For each factor, the nominal approach was conducted along with the corresponding altered approach. A set of 8 samples was processed, with each sample being assigned to either nominal (prescribed) or altered approach for each factor (Table 2).29,36,48 The nominal and altered level for each factor is shown in Table 3. Liver samples were fortified at 2.0 ng/g level. This level of fortification was chosen because it was in the middle of our calibration curves and was considered to be within the target analytical range.
Design of ruggedness experiment for determination of aflatoxins M1, B1, B2, G1, and G2 in bovine liver.*
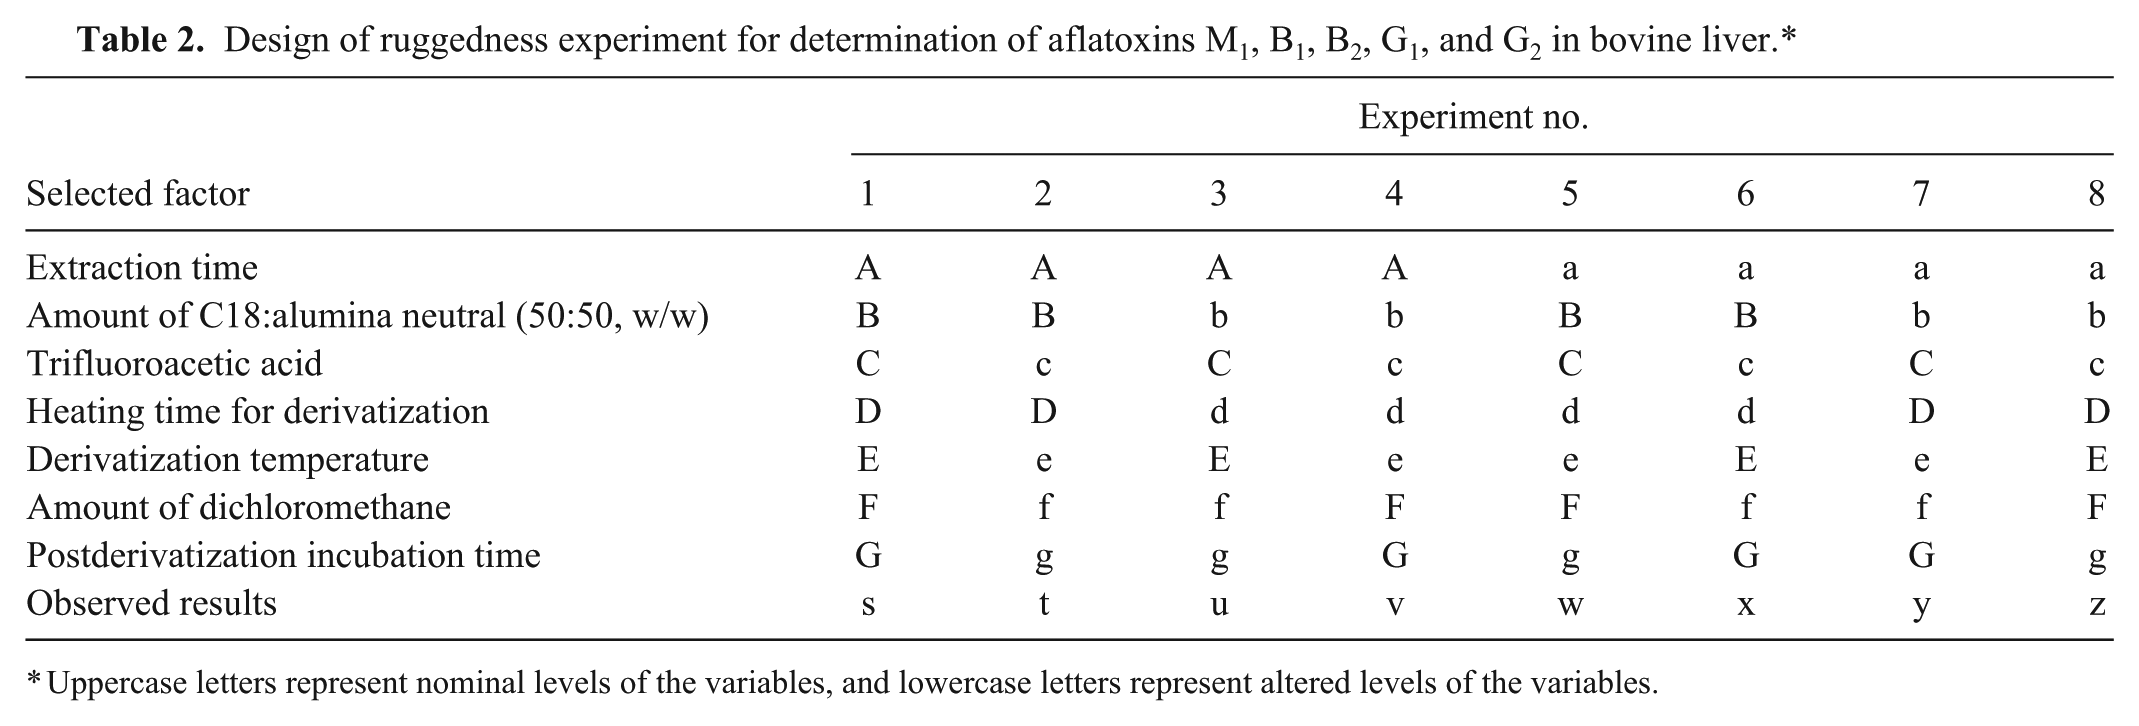
Uppercase letters represent nominal levels of the variables, and lowercase letters represent altered levels of the variables.
Nominal and altered levels for variables listed in the ruggedness test design for determination of aflatoxins M1, B1, B2, G1, and G2 in bovine liver.*
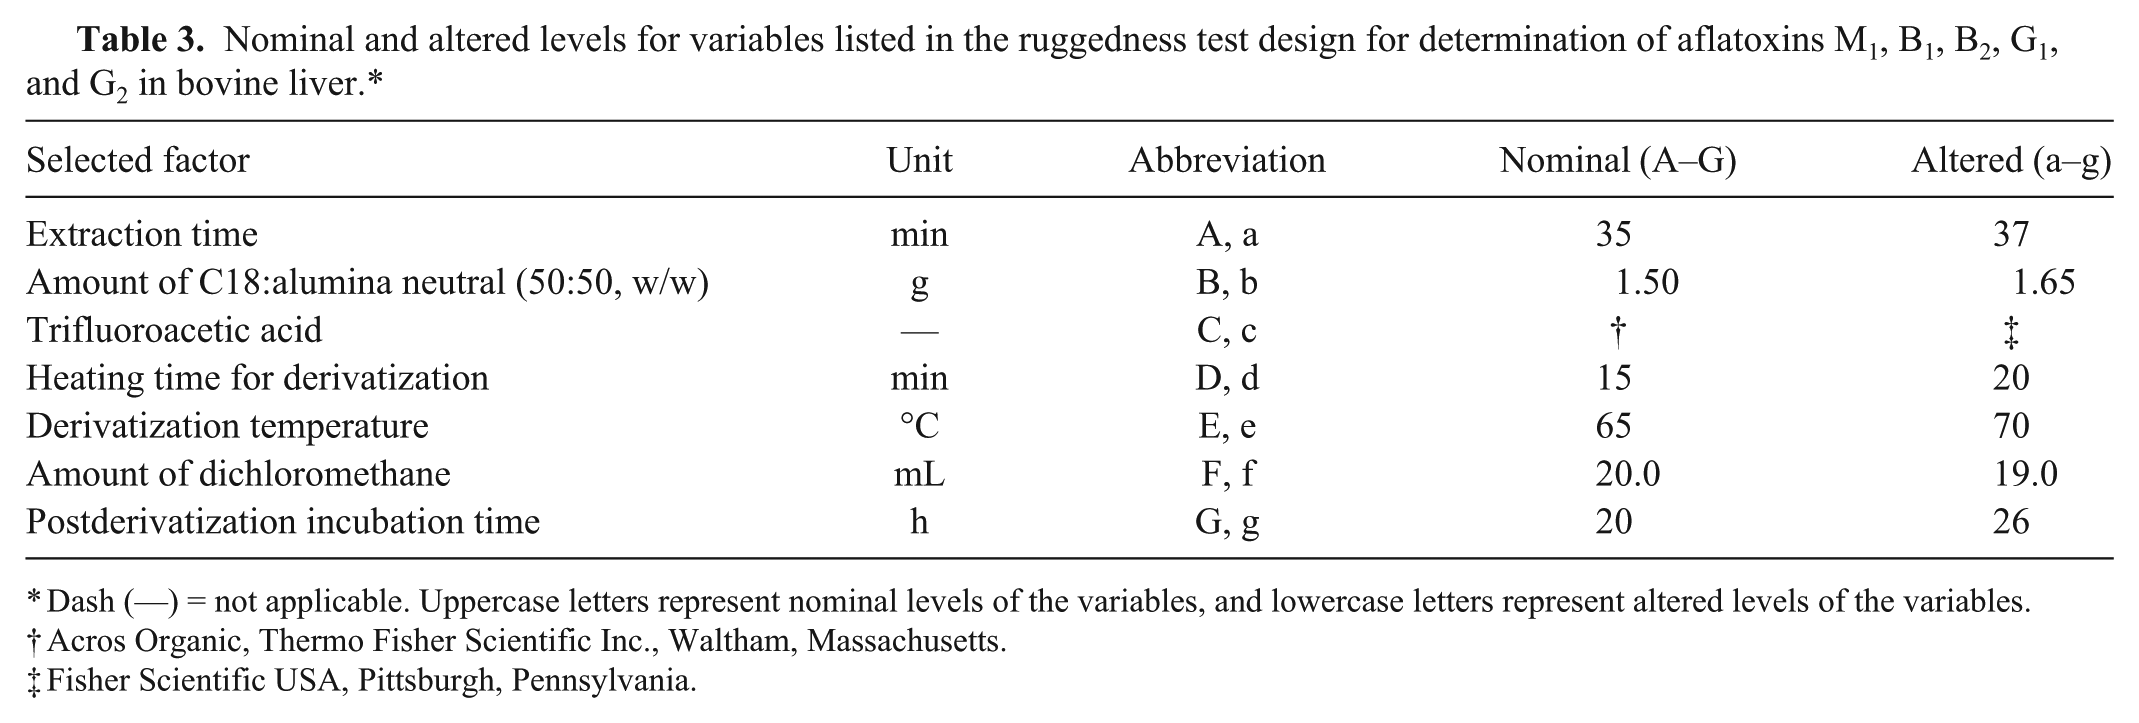
Dash (—) = not applicable. Uppercase letters represent nominal levels of the variables, and lowercase letters represent altered levels of the variables.
Acros Organic, Thermo Fisher Scientific Inc., Waltham, Massachusetts.
Fisher Scientific USA, Pittsburgh, Pennsylvania.
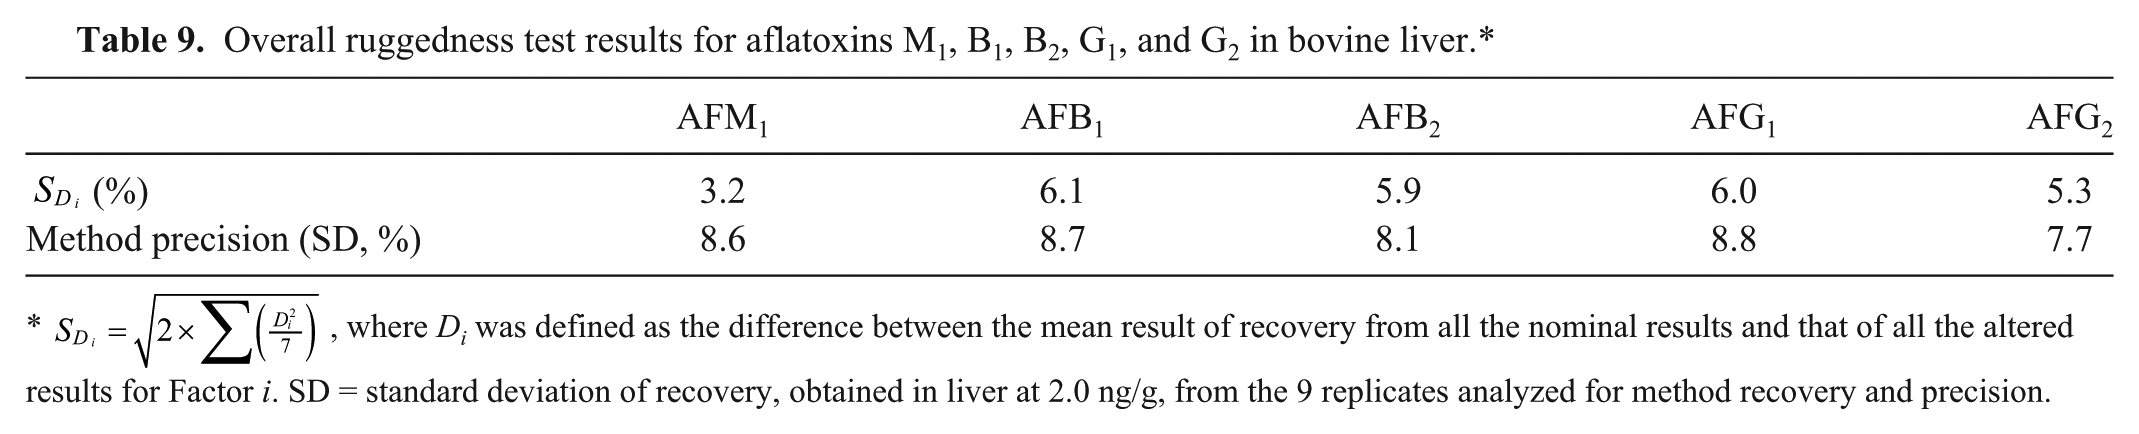
For each factor, a value Di was defined as the difference between the mean recovery of all nominal results and that of all altered results.
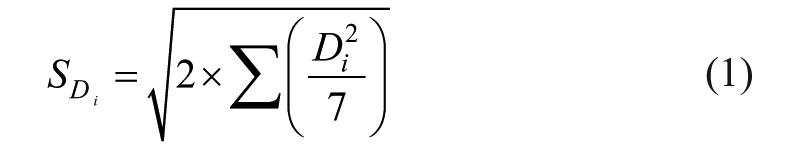
To determine the effect of all factors on ruggedness,
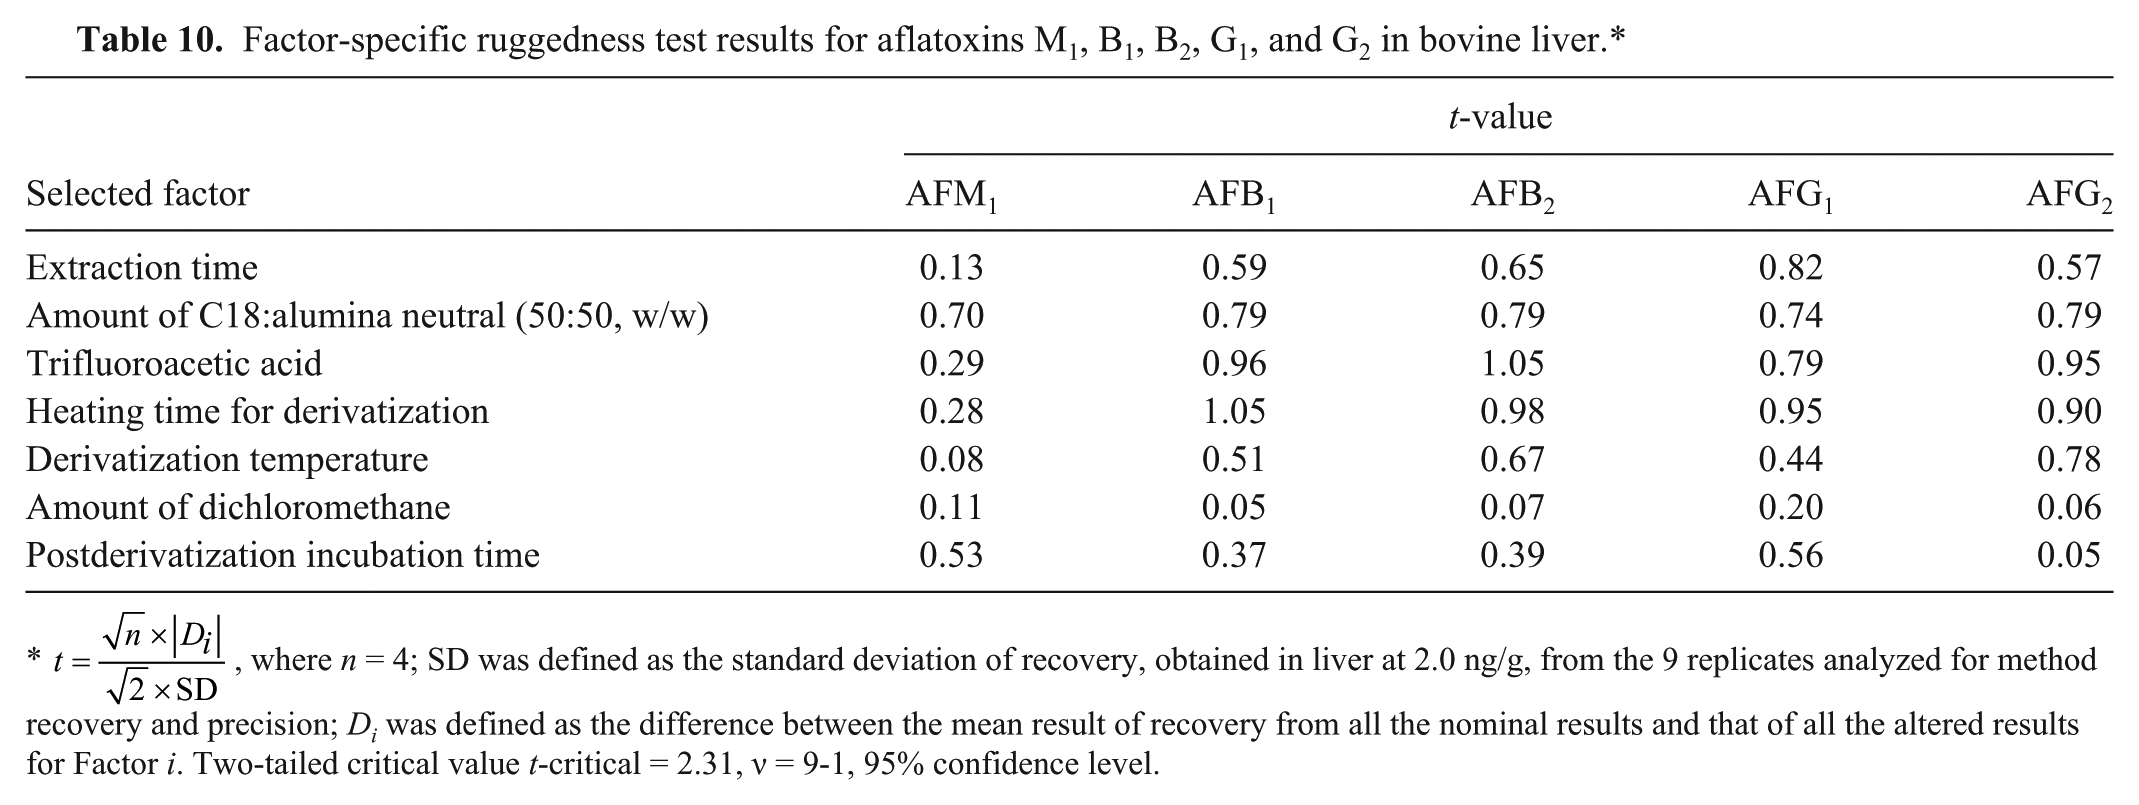
To determine if each factor alone had any effect on ruggedness, a t-value was obtained from equation (2).
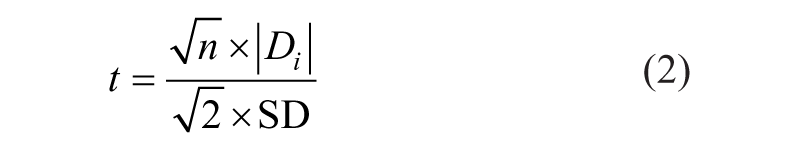
where n is the number of replicates processed for each level for each factor, which, in our study, was 4 for either nominal or altered level. SD is the standard deviation of the recovery of the method. This t-value was compared with the 2-tailed t-critical value for n − 1 degrees of freedom at 95% confidence level, where n is the number of replicates used in estimating SD. If the t-value was greater than the t-critical value for the varied factor, then the method was not rugged against such factor, and vice versa.
Results
AFM1, AFG1, AFB1, AFG2, and AFB2 were selectively separated from each other and free of interferences in both a negative control bovine liver sample and in a bovine liver sample fortified with AFM1, AFG1, AFB1, AFG2, and AFB2 at 0.2 ng/g (Fig. 1). LOD was 76 pg/g for AFM1, 80 pg/g for AFB1, 69 pg/g for AFB2, 103 pg/g for AFG1, and 31 pg/g for AFG2 (Table 4). LOQ is 176 pg/g for AFM1, 91 pg/g for AFB1, 114 pg/g for AFB2, 128 pg/g for AFG1, and 88 pg/g for AFG2. These results indicate that this method can be used to quantify aflatoxins in the liver even at concentrations much lower than 0.2 ng/g, which we choose as our lowest test concentration of the aflatoxins for this study.
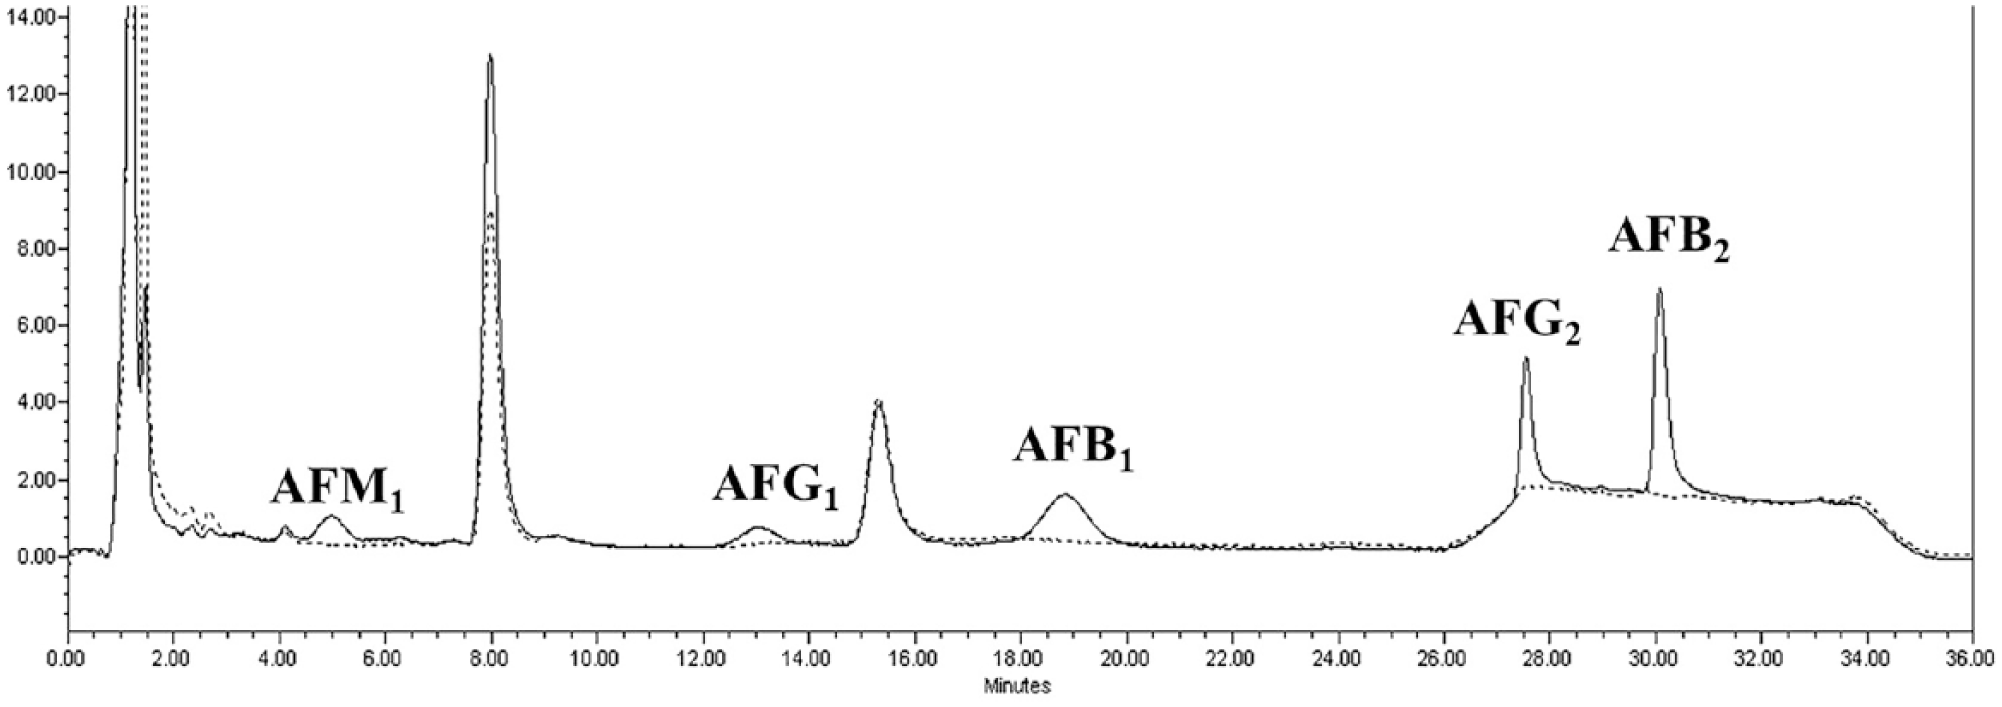
A representative chromatograph of a control bovine liver matrix (dotted line), and liver matrix fortified with aflatoxins M1, G1, B1, G2, and B2 at 0.2 ng/g (solid line).
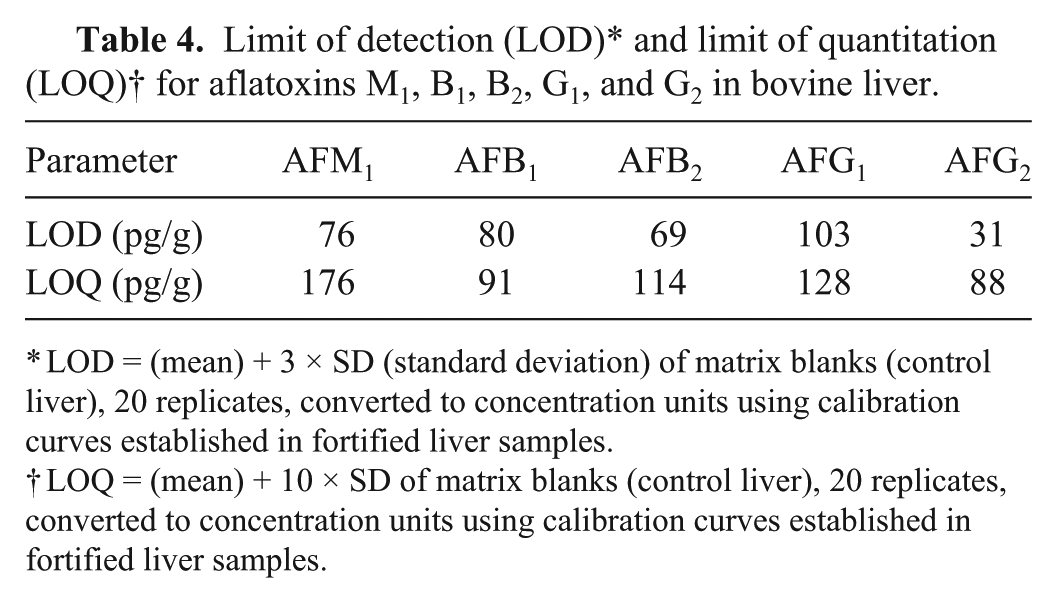
LOD = (mean) + 3 × SD (standard deviation) of matrix blanks (control liver), 20 replicates, converted to concentration units using calibration curves established in fortified liver samples.
LOQ = (mean) + 10 × SD of matrix blanks (control liver), 20 replicates, converted to concentration units using calibration curves established in fortified liver samples.
Calibration curves were established using 4 series of fortified liver samples (Fig. 2). The peak area reported as fluorescence intensity was plotted against fortified aflatoxin standard in ng, and linearly regressed. The regression equations are y = (118,205 ± 22,378)x + (–2,269 ± 14,426), y = (369,654 ± 113,457)x + (–26,052 ± 36,616), y = (404,584 ± 86,139)x + (–17,825 ± 52,419), y = (91,424 ± 33,387)x + (–6,501 ± 10,311), and y = (204,563 ± 48,991)x + (1,679 ± 35,175) for AFM1, AFG1, AFB1, AFG2, and AFB2, respectively. The correlation coefficient (R2) was >0.9978 for AFM1, >0.9995 for AFB1, >0.9986 for AFB2, >0.9983 for AFG1, and >0.9980 for AFG2.
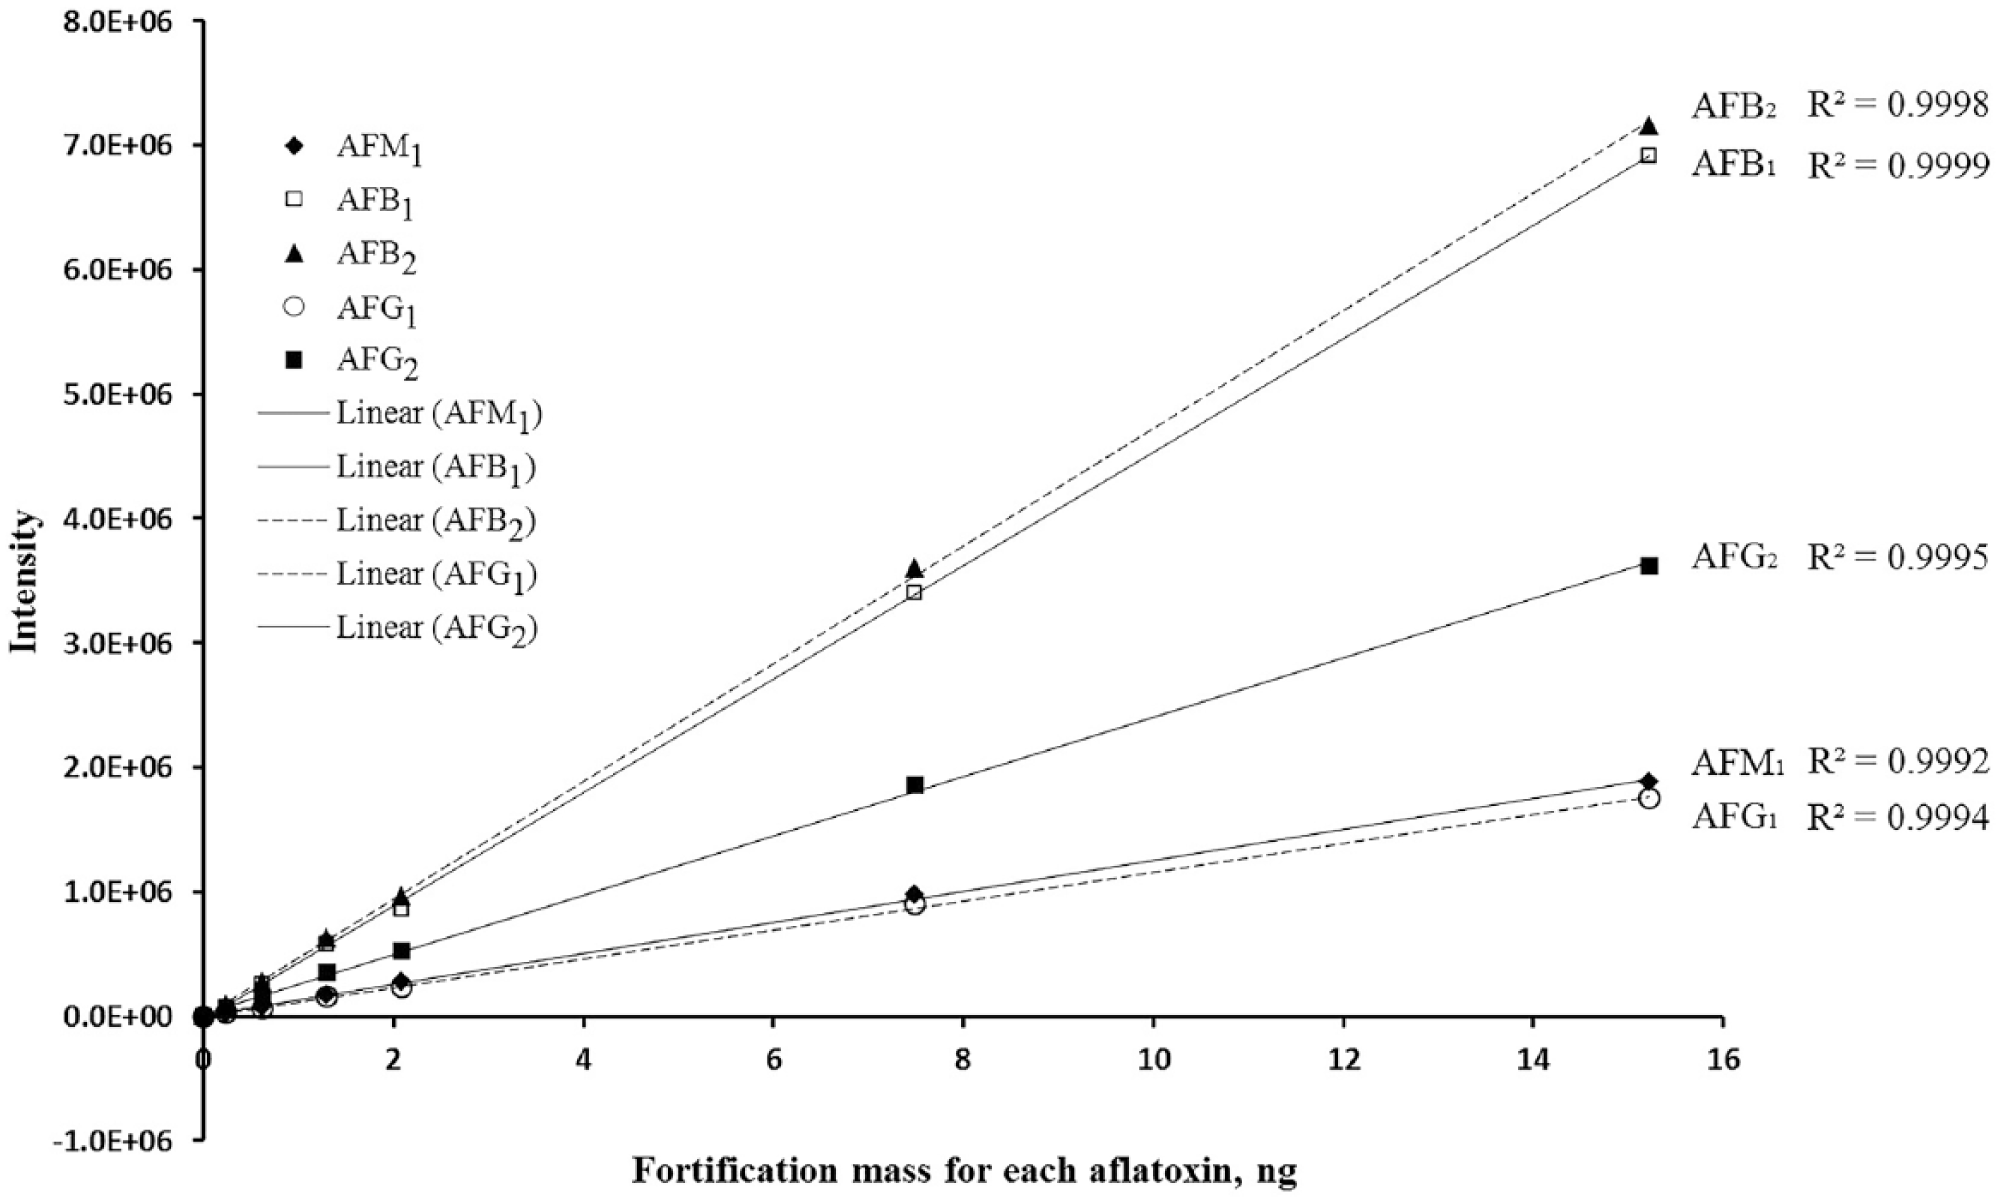
A representative calibration curve of aflatoxin M1 (AFM1) (solid line, solid diamond data point), AFB1 (solid line, empty square data points), AFB2 (dashed line, solid triangle data points), AFG1 (dashed line, empty circle data points), and AFG2 (solid line, solid square data points) in fortified liver samples. The slopes and y-intercepts are reported as mean ± confidence interval at 95% confidence level.
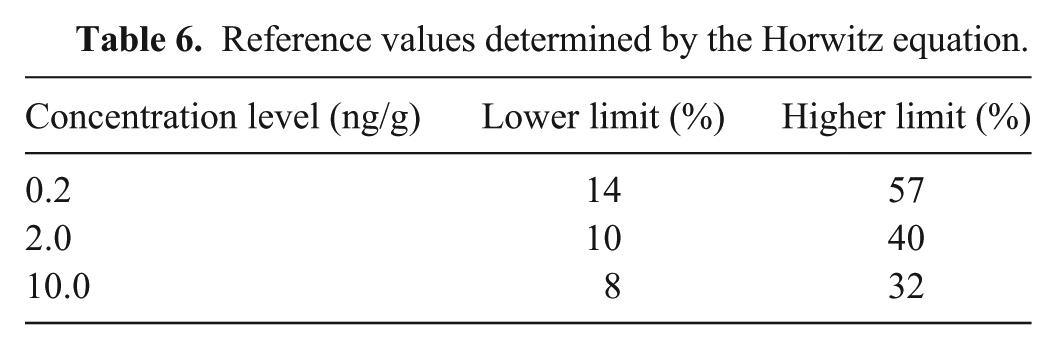
For the fortification levels 0.2–10 ng/g, repeatability (in terms of RSD) was in the range of 10–18% for AFM1, 7–14% for AFB1, 5–14% for AFB2, 6–16% for AFG1, and 10–15% for AFG2 (Table 5). The result was compared with the reference value obtained from the Horwitz equation [PRSD r (%) = c−0.15],20,25 where c is the concentration in mass fraction (Table 6).20,25 The comparison shows that all of the RSD values were well below the upper limit of Horwitz reference level, indicating satisfactory repeatability. For the fortification levels 0.2–10 ng/g, mean recovery was in the range of 52–57% for AFM1, 54–62% for AFB1, 55–61% for AFB2, 57–67% for AFG1, and 61–65% for AFG2 (Table 7).
Repeatability results for aflatoxins M1, B1, B2, G1, and G2 in bovine liver.*
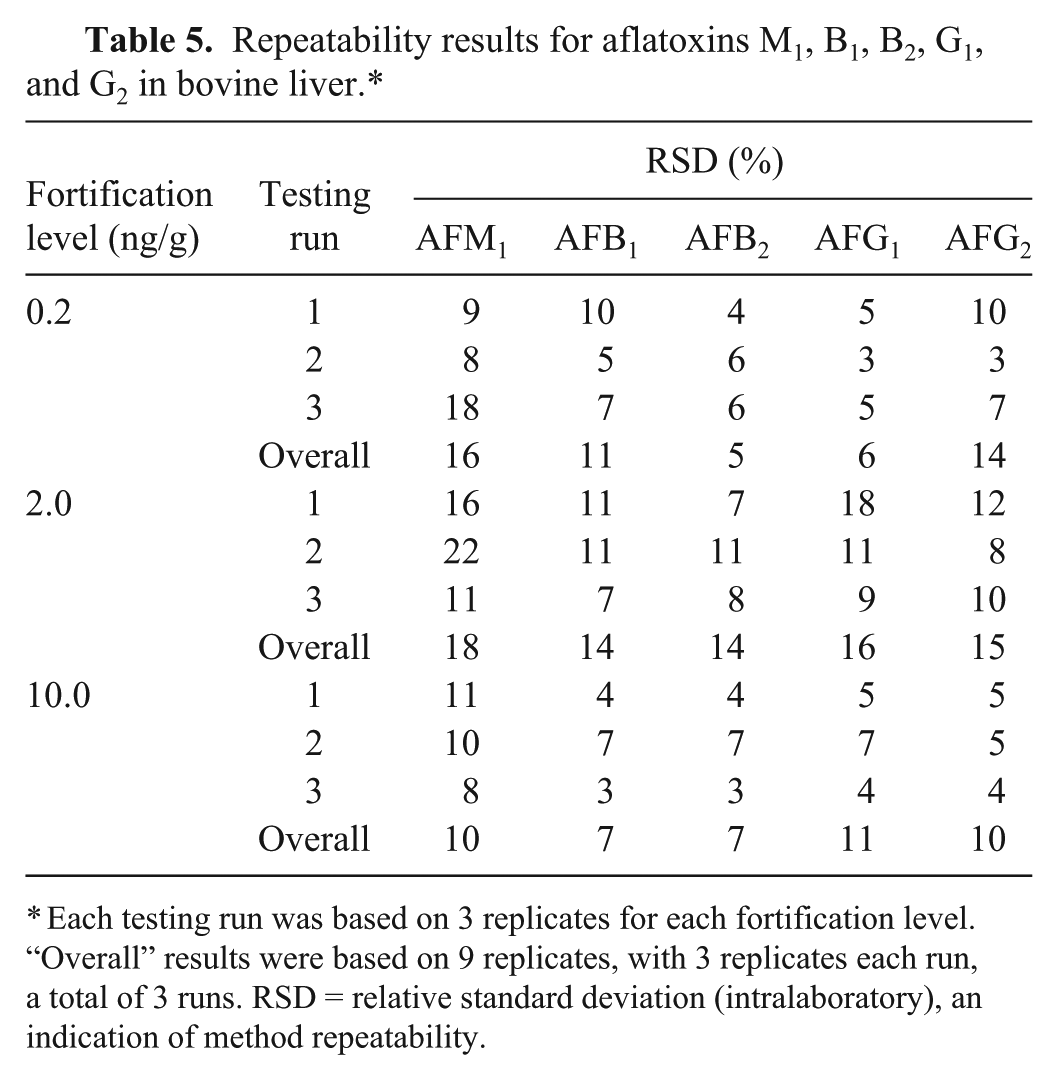
Each testing run was based on 3 replicates for each fortification level. “Overall” results were based on 9 replicates, with 3 replicates each run, a total of 3 runs. RSD = relative standard deviation (intralaboratory), an indication of method repeatability.
Reference values determined by the Horwitz equation.
Mean recovery results for aflatoxins M1, B1, B2, G1, and G2 in bovine liver for different fortification levels.*
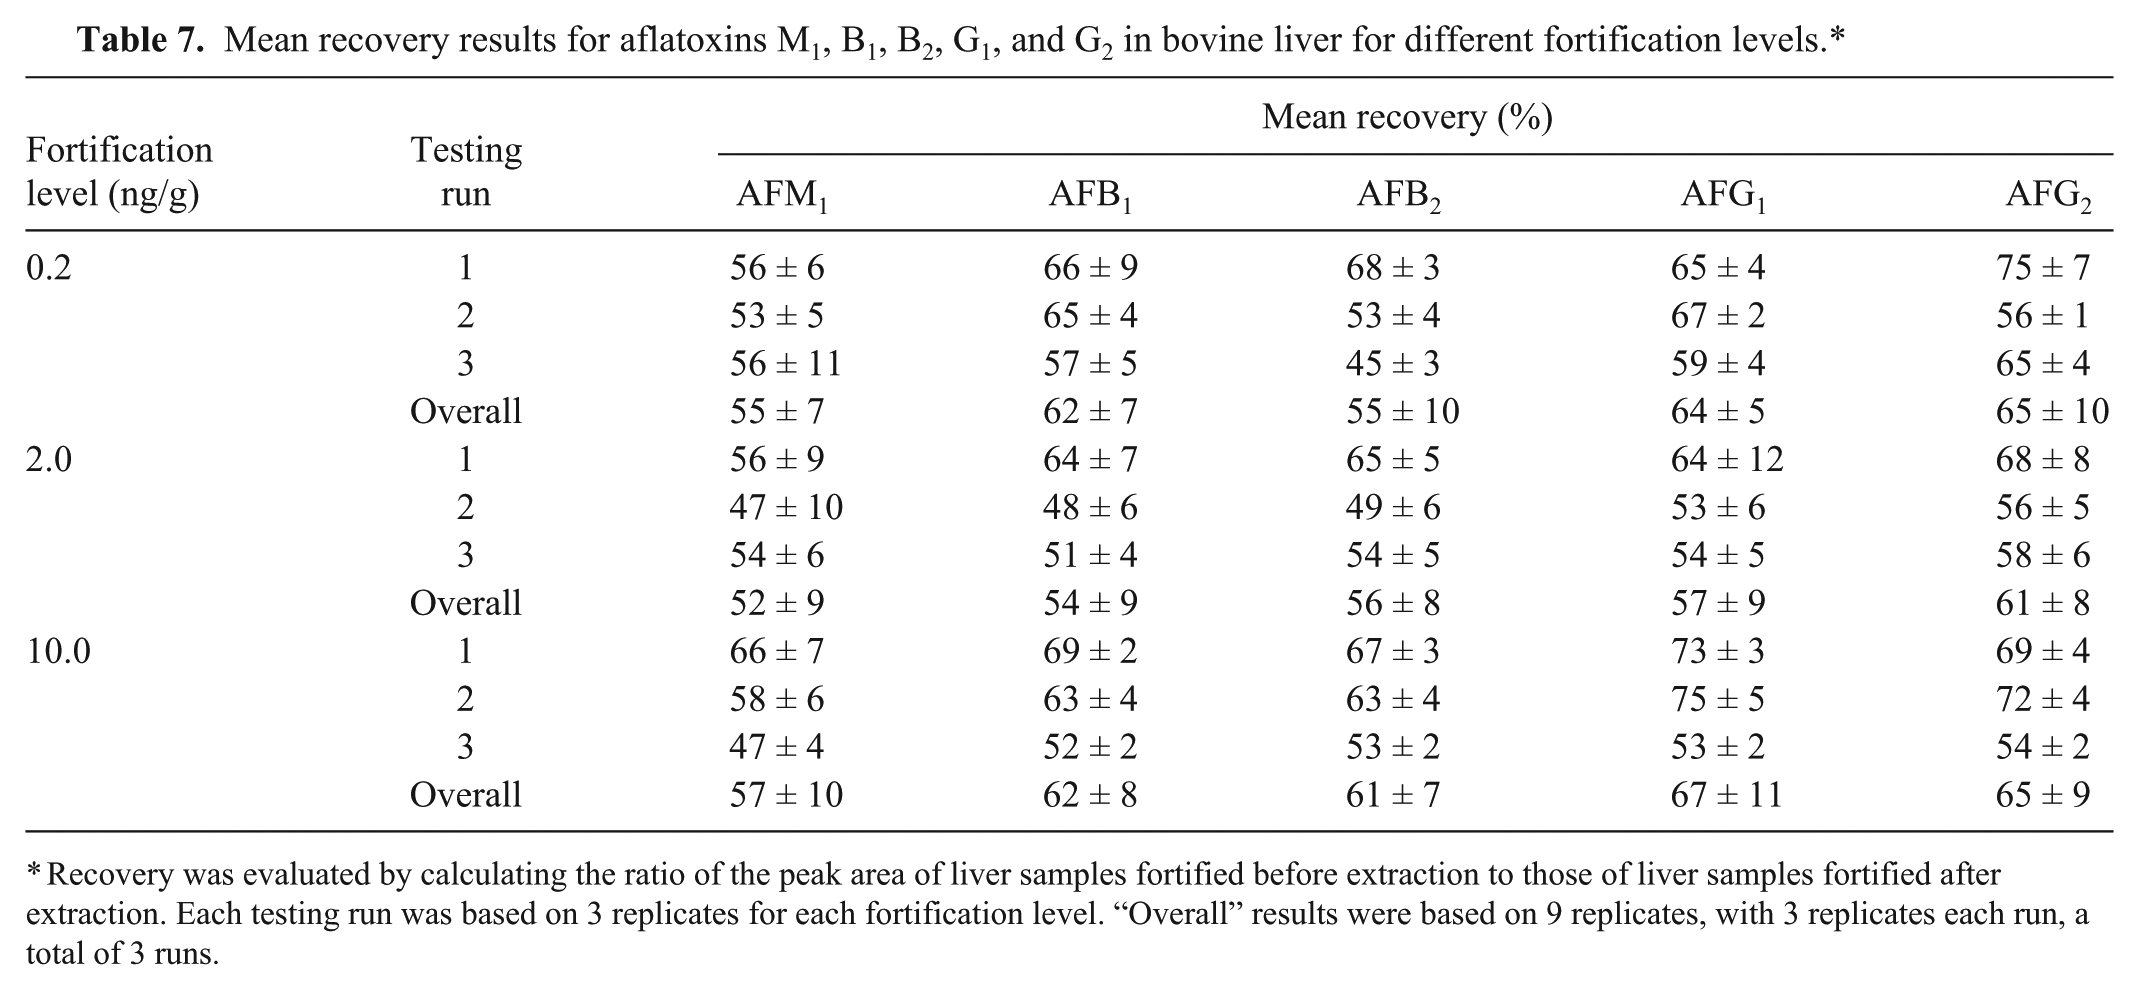
Recovery was evaluated by calculating the ratio of the peak area of liver samples fortified before extraction to those of liver samples fortified after extraction. Each testing run was based on 3 replicates for each fortification level. “Overall” results were based on 9 replicates, with 3 replicates each run, a total of 3 runs.
Results for matrix effect results for all 5 aflatoxins were within the acceptable range (<15–20%),18,28,32 which indicates the absence of liver matrix effects (Table 8). For all 5 aflatoxins, the calculated
A summary of results of liver matrix effect test for aflatoxins M1, B1, B2, G1, and G2 in bovine liver.*
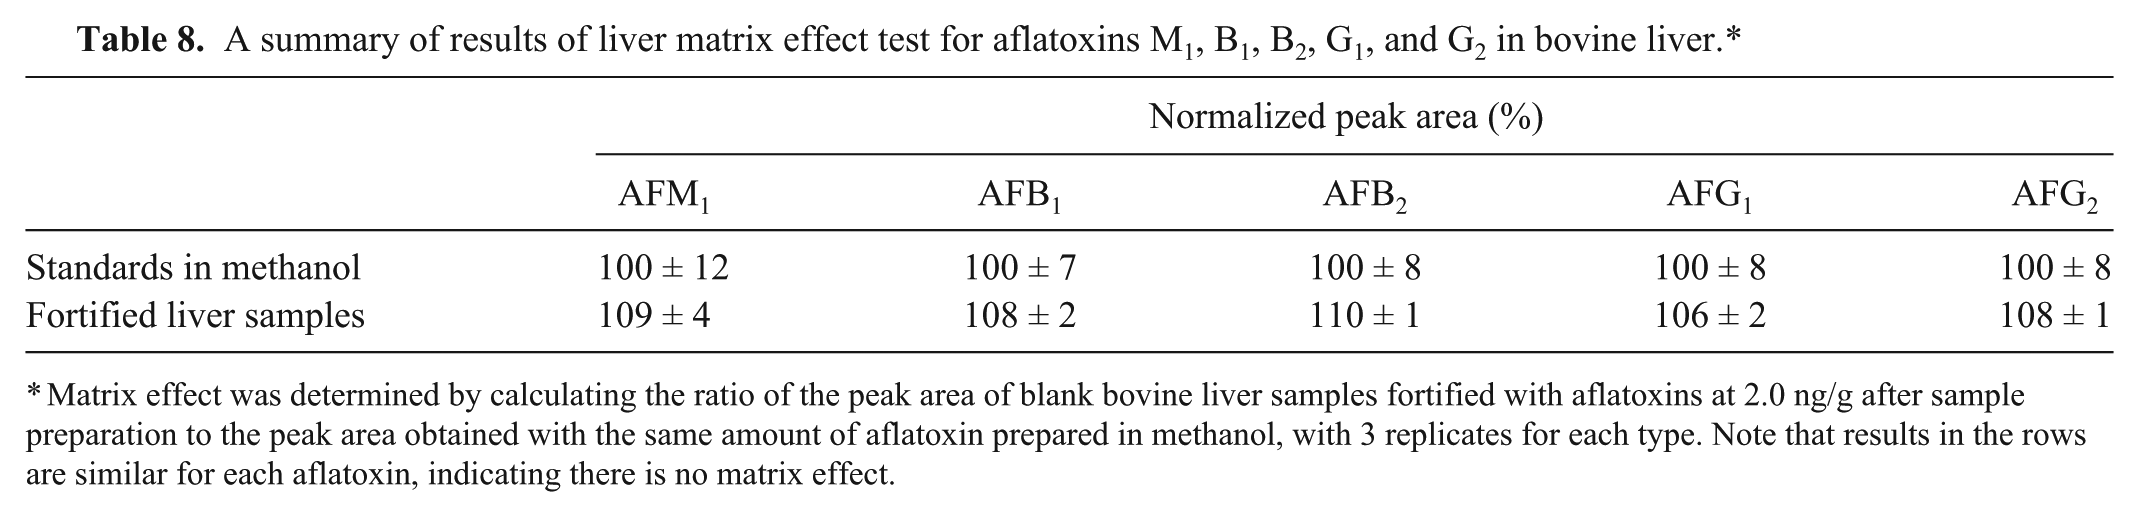
Matrix effect was determined by calculating the ratio of the peak area of blank bovine liver samples fortified with aflatoxins at 2.0 ng/g after sample preparation to the peak area obtained with the same amount of aflatoxin prepared in methanol, with 3 replicates for each type. Note that results in the rows are similar for each aflatoxin, indicating there is no matrix effect.
Overall ruggedness test results for aflatoxins M1, B1, B2, G1, and G2 in bovine liver.*
Factor-specific ruggedness test results for aflatoxins M1, B1, B2, G1, and G2 in bovine liver.*
Because we used bovine liver for our method evaluation, questions could arise whether the method can be used to analyze liver of other species. For this reason, extensive testing was also done using porcine liver. Intra-run repeatability results for porcine liver were 4–16% at the fortification level of 0.2 ng/g for all 5 aflatoxins (Table 11). All RSD values met the criteria and were within the reference Horwitz value20,25 (Table 6). These results from the porcine portion of the study suggest that the method is suitable for analysis of pig liver.
A summary of porcine liver intrarun repeatability test results for aflatoxins M1, B1, B2, G1, and G2.*
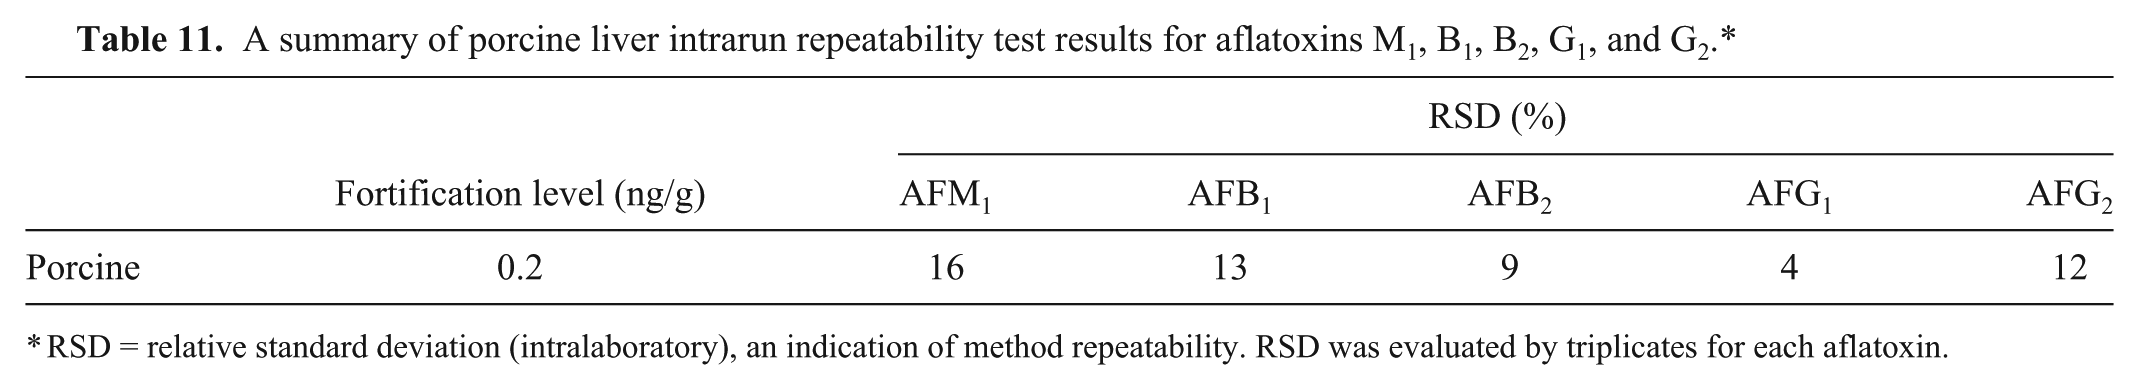
RSD = relative standard deviation (intralaboratory), an indication of method repeatability. RSD was evaluated by triplicates for each aflatoxin.
Discussion
A major advantage of this method is that it requires a small sample size, ~1 g of liver. This means the method can also be used for testing liver from small animals such as cats, dogs, and birds.
One of the challenges we faced during the method evaluation was finding an ideal incubation time for derivatization. By lengthening the time for derivatization, we were able to completely derivatize AFM1 and AFB1 consistently. The adapted method 2 gives satisfactory results for AFM1, AFB1, AFB2, AFG1, and AFG2. For AFM1, however, it shows a much slower reaction rate. Therefore, an incubation step was added to allow for thorough derivatization of AFM1. The time of incubation was optimized based on the peak area of fluorescence response. We determined that an incubation time of 12–16 h is required in order to obtain a stable response. Also, an additional step of preconditioning the mixed-phase clean-up columns was introduced to eliminate possible interference from these columns. This improved the selectivity of the method, especially for AFM1.
Based on our observations in this study, we recommend that calibration curves be established in fortified liver instead of adding standards in pure solvents. Matrix-matched calibration curves produce much more repeatable results than solvent-matched calibration curves. We suspect that the liver matrix protects the analytes from adsorbing on the walls of the unsilanized glass containers, especially at the low concentrations of interest in this study. The low aflatoxin concentrations used in our study are clinically and diagnostically relevant. From our experience working with diagnostic cases, we expect that the liver aflatoxin concentrations in animals that have died of acute aflatoxicosis to be in the range of 1–10 ng/g. 44
Overall, the method is very sensitive and selective. The part-per-trillion levels of LOD and LOQ indicate that the method is very sensitive. This is a tremendous improvement to the adapted method 42 where the instrument LOQ was 0.5 ng (AFB1 and AFG2) and 0.3 ng for AFM1 compared to 2.8 pg (AFB1), 2.9 pg (AFG2), and 4.8 pg (AFM1) from our method. Moreover, the adapted method 42 did not mention the instrument LOQ for AFB2 and AFG1.The ruggedness test indicates that minor deviations from the method as described will not adversely affect results. However, of the selected factors we tested, we found the amount of C18:alumina neutral (50:50, w/w), the source of trifluoroacetic acid, and the heating time for derivatization for aflatoxins to be the most susceptible and most likely to cause erroneous results. We therefore highly recommend using the source of trifluoroacetic acid, heating time for derivatization, and the amount of C18:alumina neutral (50:50, w/w) recommended in our procedure for best performance of this method.
The overall mean recoveries of the different aflatoxins measured were 57–67%. These recoveries are acceptable considering the analytical range targeted is 1–10 ppb in liver tissue. Generally, recoveries are expected to be excellent at higher analytical concentrations such as the ppm range. Although recoveries were not good at the analytical range of the method, the recovery was consistent. This indicates that the method performance is reliable.
We were concerned about the method performance in testing for aflatoxins in livers from different animal species. We therefore also studied porcine liver. Our method shows that parameters tested in porcine liver including selectivity, within-run repeatability, and linearity of calibration curve established with fortified liver samples, are all similar to those obtained using bovine liver. This is a good indication that the method is potentially valid for analyzing livers from a variety of animal species.
We have developed and evaluated a method that is suitable for the quantitative measurement of AFM1, AFB1, AFB2, AFG1, and AFG2 in animal liver. The method, which simultaneously detects 5 aflatoxins, is very selective. Selectivity is also confirmed by the absence of interference in the clinically relevant range of 1–10 ng/g. There was no matrix effect for all 5 aflatoxins. The method is also rugged against all factors tested. Detection and quantitation of aflatoxins in liver, when used in conjunction with histopathology and/or serum liver chemistry profiles consistent with liver injury will increase a diagnostician’s confidence in making a diagnosis of aflatoxicosis in deceased animals. Future work will focus on developing and evaluating a urine-based antemortem test for diagnosis of aflatoxicosis in pets and livestock.
Footnotes
Acknowledgements
We thank the reviewers for their suggestions, which have helped improve this article. We greatly appreciate the valuable input from Dr. Renate Reimschuessel, Dr. Andriy Tkachenko, and Sarah Nemser from the Veterinary Laboratory Investigation and Response Network (Vet-LIRN), Center for Veterinary Medicine, U.S. Food and Drug Administration. We are grateful to Dr. Chong Wang for his help on statistical analysis of experimental design and data. We also appreciate the technical assistance of Olha Ivanytska, Raymond Grover Jr., Dr. Larry Wulf, and Daniel Schultz from the Veterinary Diagnostic Laboratory, Iowa State University.
Authors’ contributions
D Shao, PM Imerman, and DE Schrunk contributed to conception and design of the study, and to acquisition, analysis, and interpretation of data. Steve M. Ensley contributed to conception of the study. WK Rumbeiha contributed to conception and design of the study, and to analysis and interpretation of data. D Shao and WK Rumbeiha drafted the manuscript. All authors critically revised the manuscript; gave final approval; and agreed to be accountable for all aspects of the work in ensuring that questions relating to the accuracy or integrity of any part of the work are appropriately investigated and resolved.
a.
HPLC 2695, Waters Corp., Milford, MA.
b.
Brownlee C18 column (5 μm, 100 mm × 4.6 mm i.d.), Perkin-Elmer Inc., Waltham, MA.
c.
Pursuit XRs 3 C18 guard column (2.0 mm i.d.) Agilent Technologies Inc., Santa Clara, CA.
d.
18.2 MΩ·cm water, high purity water system; Aries Filter Network, West Berlin, NJ.
e.
Acetonitrile (HPLC grade), methanol (HPLC grade), dichloromethane (pesticide grade), glacial acetic acid (A.C.S reagent grade), trifluoroacetic acid (bioanalysis grade), citric acid monohydrate (certified A.C.S grade), sodium sulfate anhydrous (certified A.C.S grade), alumina neutral (60–325 mesh); Thermo Fisher Scientific, Waltham, MA.
f.
Waring single speed blender, Conair Corp., Stamford, CT.
g.
Celite 503 poly pail (1 kg, diatomaceous earth), purchased from Midland Scientific Inc. Omaha, NE, manufactured by J.T. Baker, Center Valley, PA.
h.
Octadecyl (C18) 40 μm preparation LC packing, purchased from VWR International, Radnor, PA, manufactured by J.T. Baker, Center Valley, PA.
i.
Aflatoxin standards AFM1, AFB1, AFB2, AFG1, and AFG2, Whatman 740-E filter discs; Sigma-Aldrich, St. Louis, MO.
Declaration of conflicting interests
The author(s) declared no potential conflicts of interest with respect to the research, authorship, and/or publication of this article.
Funding
The author(s) disclosed receipt of the following financial support for the research, authorship, and/or publication of this article: Funding for this project provided by the Veterinary Laboratory Information and Response Network (Vet-LIRN), Center for Veterinary Medicine, U.S. Food and Drug Administration (grant 1U18FD005006-01). Their support is deeply appreciated.