
Abstract
Viral erythrocytic necrosis (VEN) is a disease of marine and anadromous fish that is caused by the erythrocytic necrosis virus (ENV), which was recently identified as a novel member of family Iridoviridae by next-generation sequencing. Phylogenetic analysis of the ENV DNA polymerase grouped ENV with other erythrocytic iridoviruses from snakes and lizards. In the present study, we identified the gene encoding the ENV major capsid protein (MCP) and developed a quantitative real-time PCR (qPCR) assay targeting this gene. Phylogenetic analysis of the MCP gene sequence supported the conclusion that ENV does not group with any of the currently described iridovirus genera. Because there is no information regarding genetic variation of the MCP gene across the reported host and geographic range for ENV, we also developed a second qPCR assay for a more conserved ATPase-like gene region. The MCP and ATPase qPCR assays demonstrated good analytical and diagnostic sensitivity and specificity based on samples from laboratory challenges of Pacific herring Clupea pallasii. The qPCR assays had similar diagnostic sensitivity and specificity as light microscopy of stained blood smears for the presence of intraerythrocytic inclusion bodies. However, the qPCR assays may detect viral DNA early in infection prior to the formation of inclusion bodies. Both qPCR assays appear suitable for viral surveillance or as a confirmatory test for ENV in Pacific herring from the Salish Sea.
Introduction
Viral erythrocytic necrosis (VEN) is a disease of marine and anadromous fish that is characterized by the presence of cytoplasmic inclusion bodies in erythrocytes, anemia, increased susceptibility to secondary infection, and direct mortality. 3 The disease has been recognized in both the Atlantic and Pacific Oceans in a wide range of fish hosts that include the families Gadidae, Clupeidae, Salmonidae, Anguillidae, and Blenniidae. 3 The etiological agent, erythrocytic necrosis virus (ENV), 11 was characterized in 2014 as a novel iridovirus using next-generation sequencing technologies. 6 Phylogenetic analysis of a conserved DNA polymerase gene indicated that ENV groups with other erythrocytic iridoviruses from snake (Thamnophis sauritus erythrocytic virus) and lizard (Lacerta monticola erythrocytic virus) hosts; the authors propose that these viruses may constitute a sixth genus of the family Iridoviridae. 6
A presumptive diagnosis of VEN is based on clinical signs of anemia and the observation of cytoplasmic inclusion bodies in erythrocytes by light microscopy (2014 American Fisheries Society suggested procedures for the detection and identification of certain finfish and shellfish pathogens, http://goo.gl/ybJ3L2). However, there are a number of salmonid-associated intraerythrocytic viruses that form cytoplasmic inclusion bodies (Hedrick RP, et al. Another erythrocytic virus from salmonid fish? Fish Health Section AFS Newsl 1987;15:5; Landolt ML, et al. Detection of an intra-erythrocytic virus in rainbow trout (Salmo gairdneri). Fish Health Section AFS Newsl 1977;6:4–6),7,14 so confirmatory diagnosis typically requires detection of iridovirus-like particles in the cytoplasm of erythrocytes by transmission electron microscopy (TEM; http://goo.gl/ybJ3L2). Conventional PCR primers targeting regions of the genes encoding a DNA polymerase, ATPase-like molecule, RNA polymerase, and ribonucleotide reductase small subunit have been reported. 6 Diagnostic PCR tests for other iridoviruses commonly target the gene encoding the major capsid protein (MCP) because this gene tends to be highly virus specific, and sequencing of this gene can provide information about viral genotype. 27 Additionally, this gene has been used to assess phylogenetic relationships within and among iridovirus species.
The objective of our study was to extend the work of Emmenegger et al. 6 by reporting the sequence of the gene encoding the ENV MCP, and developing a quantitative real-time PCR (qPCR) targeting the MCP gene. Only ENV from infected Pacific herring (Clupea pallasii) in the Salish Sea has been characterized to date, 6 and there is limited information about the diversity of ENV across its host and geographic range. For that reason, we also developed and validated a second qPCR test that targets a more conserved ATPase-like gene. The analytical and diagnostic properties of the 2 new ENV qPCR assays were compared with the current gold standard diagnostic technique based on examination of stained blood films for the presence of intracytoplasmic inclusion bodies. The molecular assays developed herein will be useful for ENV surveillance within the Salish Sea, confirmatory diagnosis, or for diagnostic cases where the condition of the fish prevents blood film analysis.
Materials and methods
Animals
All live fish experiments were approved by the Western Fisheries Research Center Institutional Animal Care and Use Committee (protocol 2008-31). Pacific herring gametes were collected from various spawning locations in the Salish Sea (Washington State). The rearing of specific pathogen–free (SPF) Pacific herring was performed as previously described 13 in sand-filtered and ultraviolet-irradiated flowing seawater. Throughout their rearing period, SPF fish were fed a diet of progressively larger food items including enriched rotifers Brachionus plicatilis, enriched Artemia franciscana nauplii (instars 1–2), frozen copepods, a and commercially available food pellets. b There was no history of VEN disease in the fish stock used for diagnostic validation.
Identification of the ENV major capsid protein
Parallel 454 sequencing of ENV total DNA and the identification of an ENV ATPase-like gene (GenBank accession KJ730210) has been previously described. 6 A search of the 454 dataset revealed a contig with a partial open reading frame (ORF) that encoded a protein with similarity to the iridovirus MCP. To confirm the authenticity of the contig, total DNA was extracted from ENV-infected Pacific herring kidney tissue following the manufacturer’s c recommendation for tissues. DNA was quantified by spectrophotometer d and stored at −20°C until used. Amplification of the putative MCP was achieved following the manufacturer’s recommendation e for a 25 µL final volume using primers 51F (GCGCTCGTGTCACACAATAGT) and 1671R (CCAAAATTTGTAGAACCCTGAG; amplicon length 1,620 bp). All conventional PCR and sequencing primers were designed manually and synthesized commercially. j Reaction conditions were 1 cycle of 95°C for 5 min, followed by 35 cycles of 94°C for 30 s, 55°C for 30 s, and 72°C for 1 min.
Sanger sequencing was performed on an automated sequencer f with the recommended reagents g in a final 10 µL reaction. Sequencing used the first-round PCR primers (51F and 1671R), as well as internal primers 361F (ACGGCAGCGAGTTTATATGTAT) and 1243R (TCCAGAGGATCCGCAGCCAC). Sequence chromatograms were assessed and edited manually. h A partial ENV MCP sequence was used in a phylogenetic comparison with other iridoviruses (Table 1). Multiple sequence alignment was performed using ClustalX 25 within the MEGA V6.0 software package. 24 Phylogenetic relationships were inferred using the maximum likelihood method implemented in the MEGA software package, using a Poisson correction model with 1,000 bootstrap iterations.
Comparison of the partial major capsid protein amino acid sequence of erythrocytic necrosis virus (ENV) to other iridoviruses. A total of 357 amino acid positions were present in the final dataset.
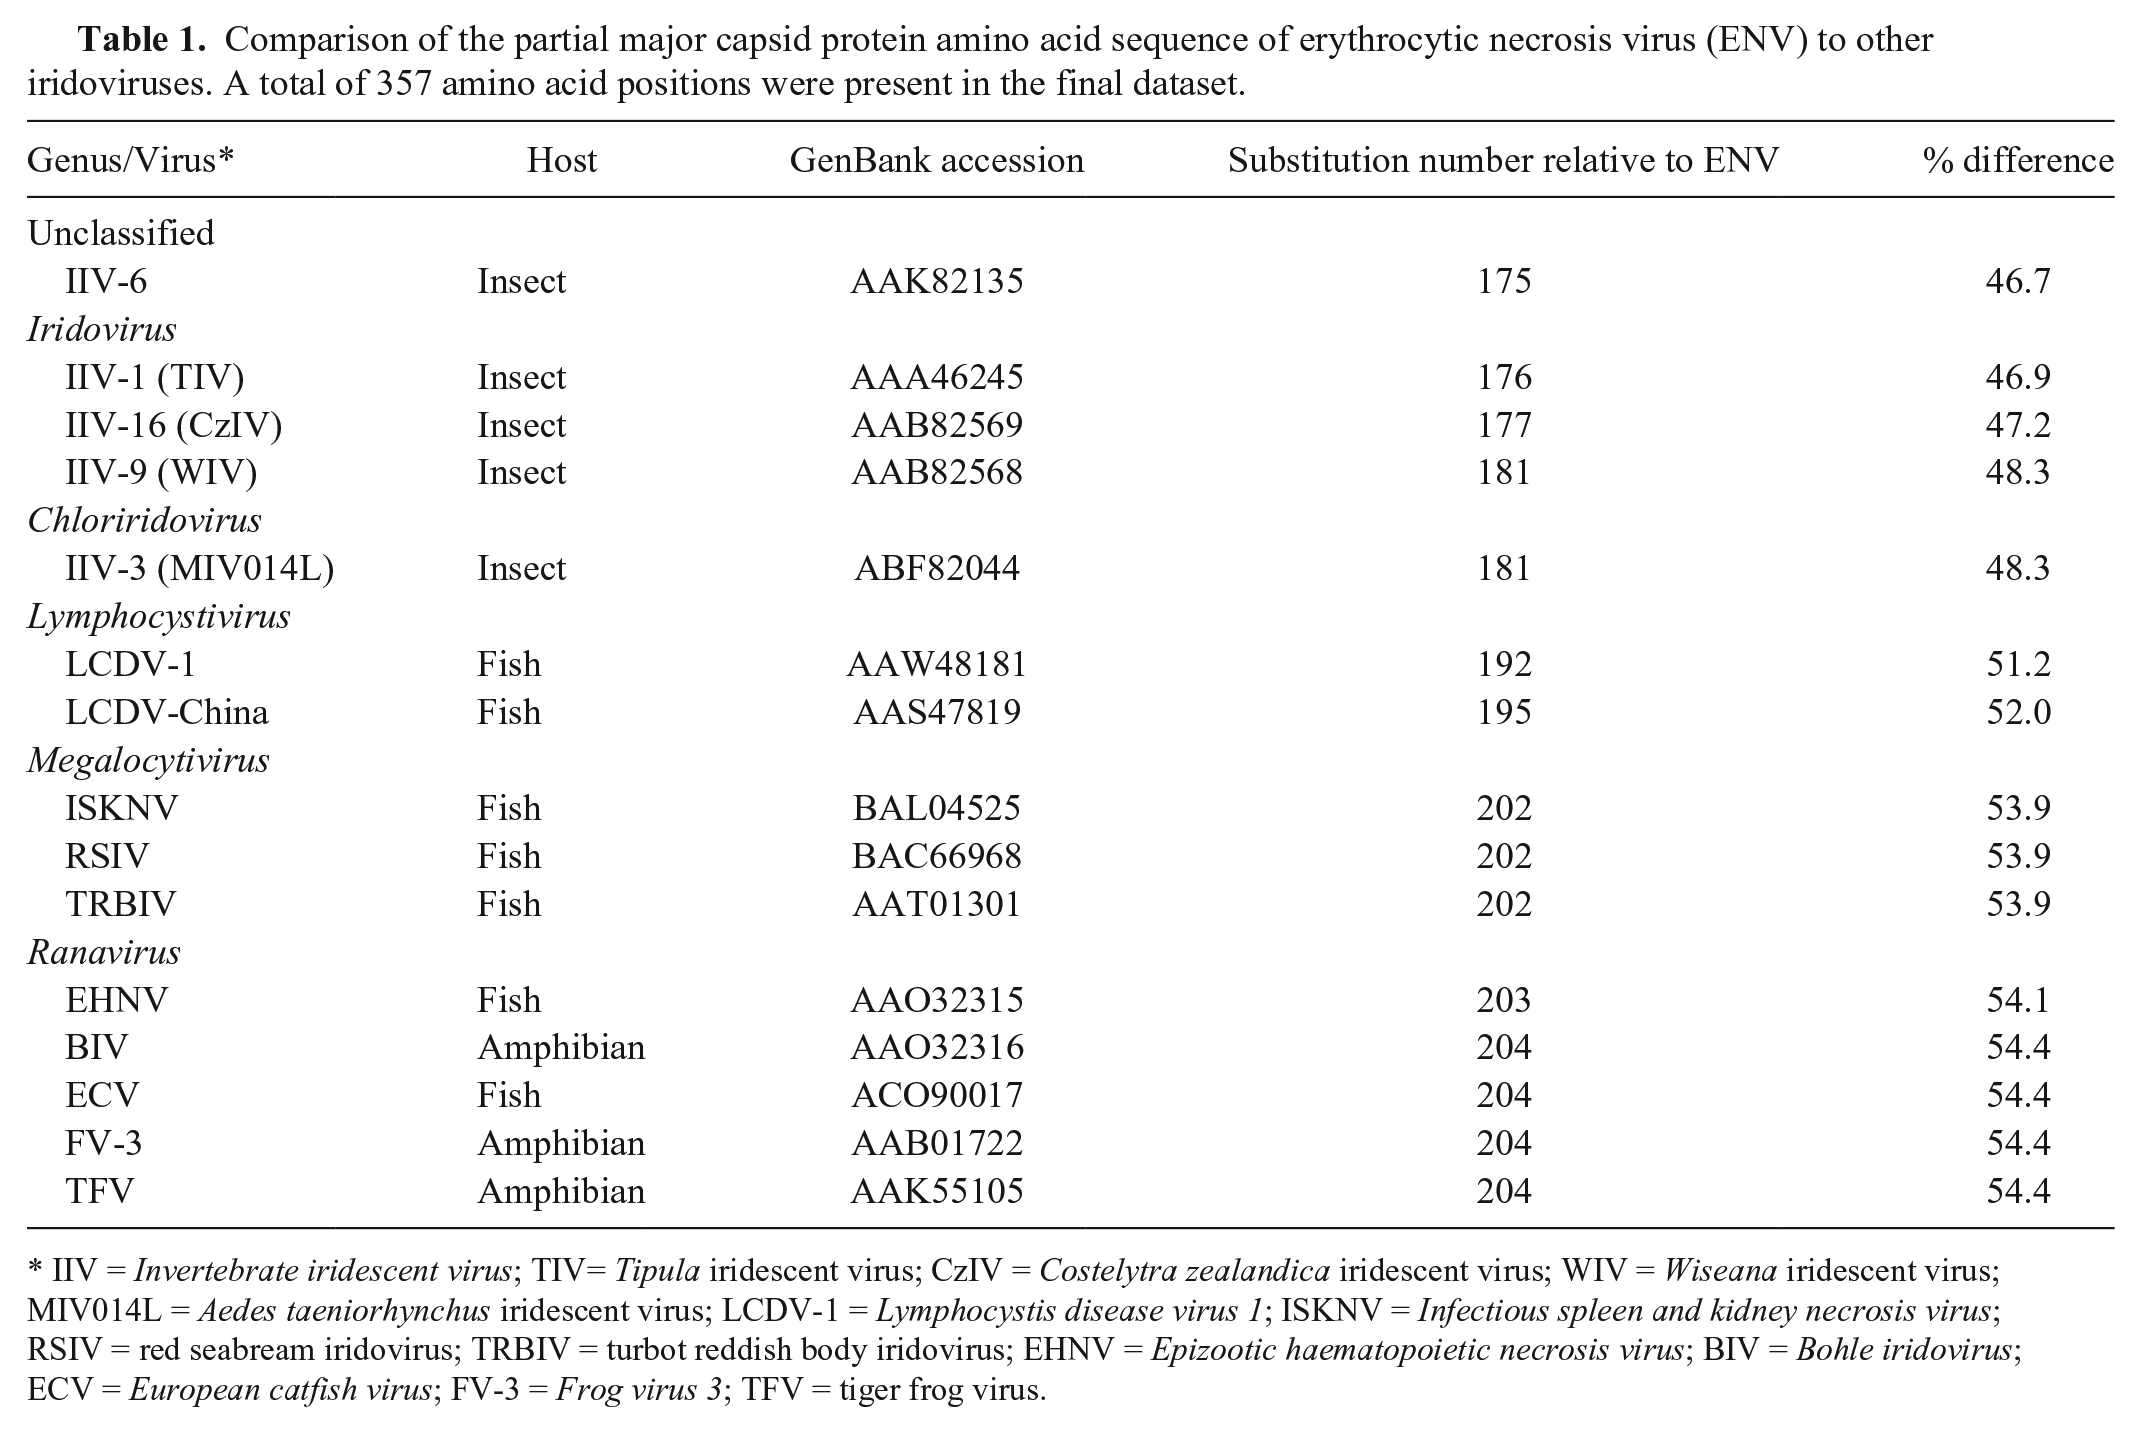
IIV = Invertebrate iridescent virus; TIV= Tipula iridescent virus; CzIV = Costelytra zealandica iridescent virus; WIV = Wiseana iridescent virus; MIV014L = Aedes taeniorhynchus iridescent virus; LCDV-1 = Lymphocystis disease virus 1; ISKNV = Infectious spleen and kidney necrosis virus; RSIV = red seabream iridovirus; TRBIV = turbot reddish body iridovirus; EHNV = Epizootic haematopoietic necrosis virus; BIV = Bohle iridovirus; ECV = European catfish virus; FV-3 = Frog virus 3; TFV = tiger frog virus.
Primer, probes, and artificial positive controls development
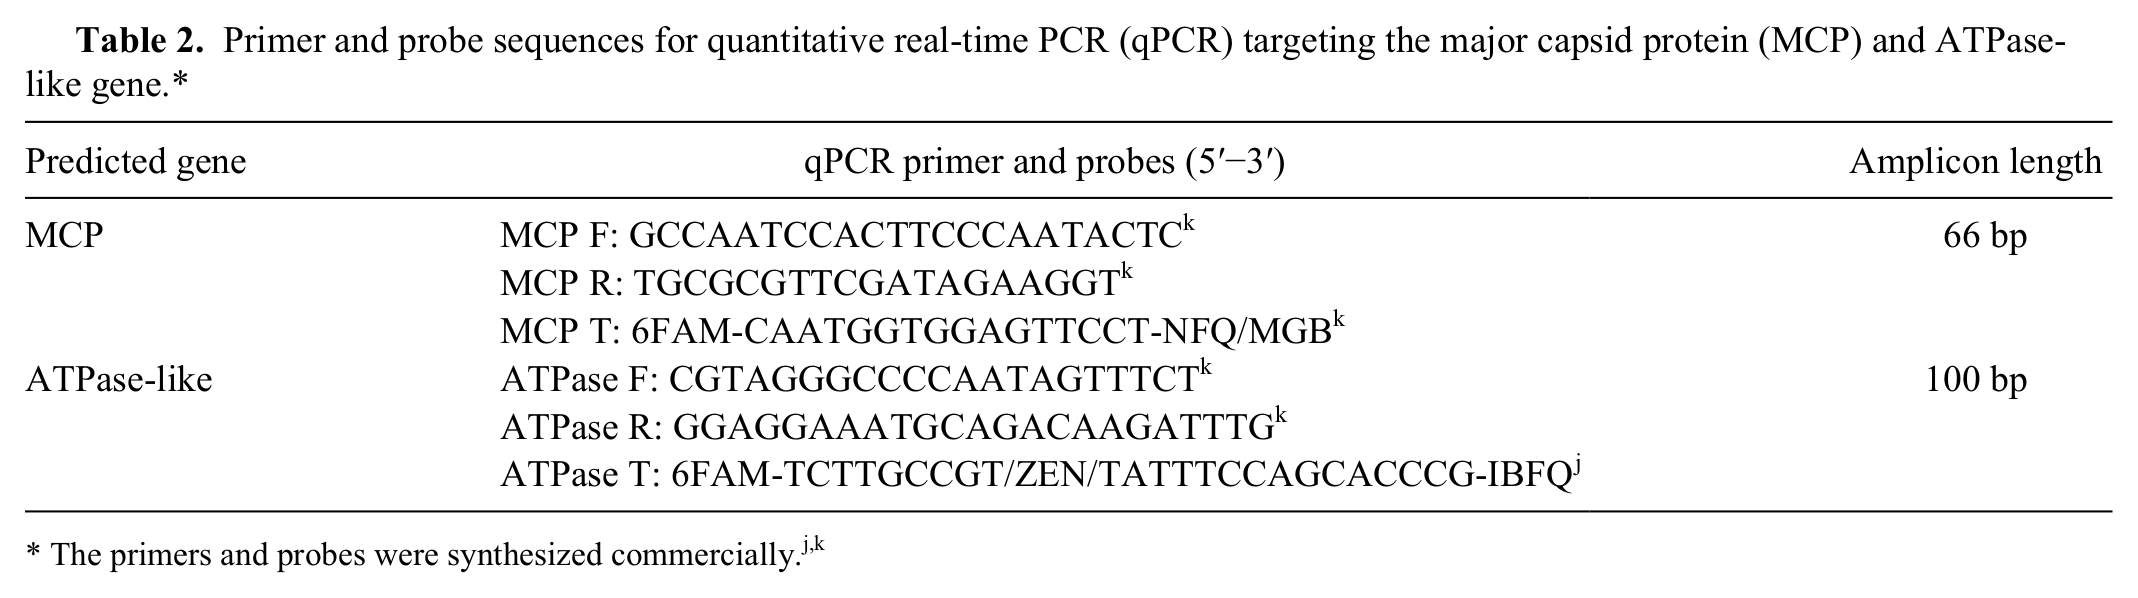
Primers and fluorescent-labeled probes were designed using a commercial program, i and sequences are provided in Table 2. Two assays targeting the MCP and ATPase-like genes were designed (hereafter referred to as the MCP and ATPase qPCR assays, respectively). An artificial positive control (APC) plasmid was designed for use as a control and quantitative standard using methods previously reported. 21 Briefly, an artificial construct that encoded target sequences for the ENV primers and probe plus the addition of an artificial probe binding site was synthesized and cloned into the commercial high copy vector. j A probe labeled with a VIC reporter dye k was designed to bind to the artificial sequence site. 23 The APC plasmid DNA was used as a positive control in separate reaction wells and to generate standard curves. The APC plasmid was used to determine absolute ENV gene copy number based on a plasmid molecular weight of 1.3 × 10⁶ g/mole (both assays), which equates to 4.7 × 10¹¹ copies/µg; copy number calculations were as described. 20 The APC plasmid DNA was diluted to a standard number of copies per microliter, serially diluted in 10-fold increments, and subjected to either the ATPase or MCP qPCR assay. Each reaction includes the ENV-specific primer and probes and the APC probe; the APC probe was included to be consistent with our standard operating procedure for testing unknown samples. However, only fluorescence obtained from the ENV-specific probe was used to generate the APC plasmid DNA standard curve. Linear regression analysis was used to relate quantification cycle (Cq) values to log copy number (r2 value range 0.994−0.996). All APC plasmid DNA was stored as aliquots at −80°C until used.
Primer and probe sequences for quantitative real-time PCR (qPCR) targeting the major capsid protein (MCP) and ATPase-like gene.*
Quantitative PCR standard operating procedures
Real-time PCR was conducted using a commercial system. k The cycling conditions were 50°C for 2 min, 95°C for 10 min, followed by 40 cycles of 95°C for 15 s and 60°C for 1 min. Reactions contained 12 µL of master mix l with 900 nM of each forward and reverse primers, 200 nM of fluorescent probe, and 200 nM of APC probe, with 5 µL of diluted DNA. Negative template controls and positive controls (APC plasmid) were included on each plate run. The test interpretation criteria were as follows: 1) no amplification in 2 replicate wells was considered a negative result, 2) sigmoidal amplification curves present in 2 replicate wells was considered a positive result, and 3) sigmoidal amplification curves present in 1 of 2 replicate wells was considered a suspect result. Suspect results would typically be repeated in quadruplicate with the goal of obtaining 2 replicate wells with positive amplification, but no suspect test results were obtained in this study.
Analytical validation
The analytical sensitivity and PCR efficiency of each of the ENV assays were evaluated using standard curves generated with APC plasmid DNA or kidney total DNA derived from an ENV-infected Pacific herring. Standard curves consisted of 10-fold serial dilutions that were subjected to qPCR. The ENV qPCRs were tested for cross-reactivity with other selected fish iridoviruses using DNA extracted from Lymphocystis disease virus 1 (LCDV-1), red seabream iridovirus (RSIV), and Infectious spleen and kidney necrosis virus (ISKNV). The within-run repeatability of the ENV qPCRs was estimated by using 10 replicate wells (in the same run) of 3 samples representing different viral copy number. To measure the between-run repeatability of each assay, the 3 samples representing different copy number concentrations were tested in 4 separate runs on 4 different days. Coefficient of variation (CV) was calculated as standard deviation/mean. Assay ruggedness was evaluated by substituting master mix formulations and incorporation of a commercial exogenous internal positive control (IPC n ; as described in Table 3).
Ruggedness of the major capsid protein (MCP) quantitative real-time PCR (qPCR) and ATPase-like qPCR assays. Evaluations included a comparison of master mix composition, incorporation of an internal positive control (IPC) n duplex, or incorporation of an artificial positive control (APC) probe into the reaction.*
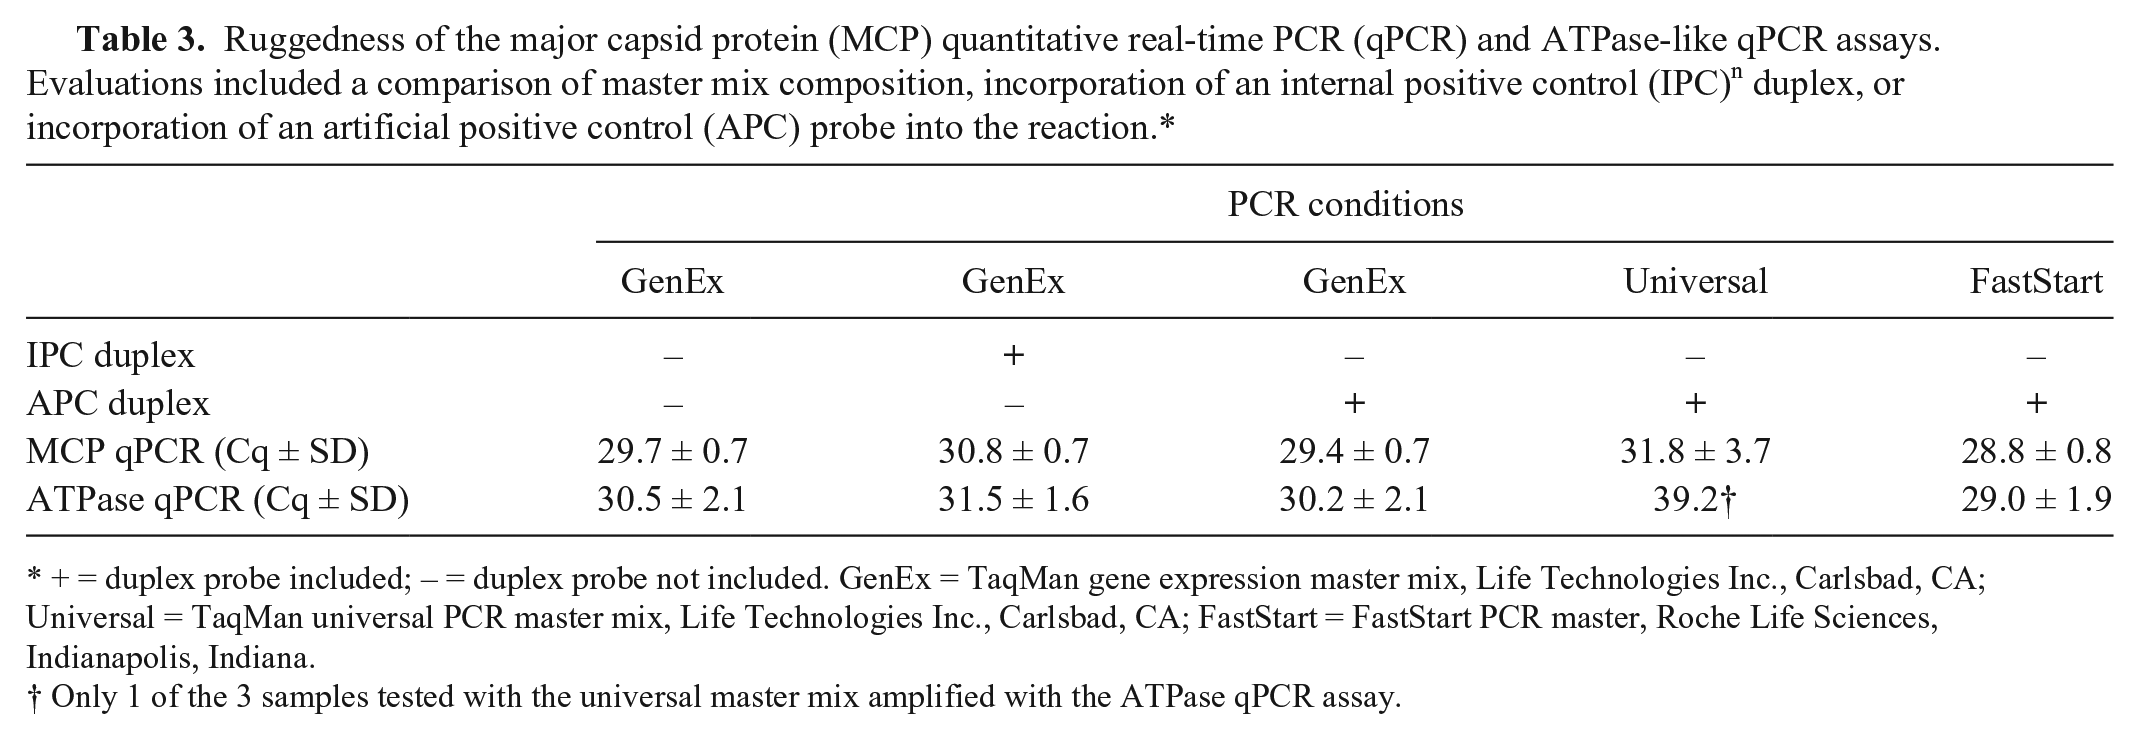
+ = duplex probe included; – = duplex probe not included. GenEx = TaqMan gene expression master mix, Life Technologies Inc., Carlsbad, CA; Universal = TaqMan universal PCR master mix, Life Technologies Inc., Carlsbad, CA; FastStart = FastStart PCR master, Roche Life Sciences, Indianapolis, Indiana.
Only 1 of the 3 samples tested with the universal master mix amplified with the ATPase qPCR assay.
Diagnostic validation
Diagnostic properties of the MCP and ATPase qPCR assays were evaluated using positive and negative populations of Pacific herring created by laboratory challenge. Briefly, tissues from ENV-infected Pacific herring were homogenized in phosphate buffered saline (PBS), subjected to centrifugation, and then 50 μL of the supernatant was injected into naïve Pacific herring (~2.6 g) to create a “true-positive” group (n = 50). Additional naïve herring were injected with PBS to create a “true-negative” group (n = 50). Fish were held in flowing seawater (mean ± SD temperature 8.5°C ± 0.2°C) and were euthanized by an overdose of buffered tricaine methanesulfonate (MS-222) at 16 days postinfection (dpi). The caudal artery was severed, blood films were produced on glass slides, and kidney tissues were sampled and stored at −20°C until used. Blood films were air dried, fixed in methanol, and stained with 3.5% Giemsa in phosphate buffer 9 ; the number of inclusion bodies per 100 erythrocytes was determined by light microscopy at 1,000× magnification (http://goo.gl/ybJ3L2). The technician reading the slides had moderate prior experience with blood smear analysis; the reader was not blinded to the test slides. DNA was extracted from kidney tissues using the methods described above and analyzed with the MCP and ATPase qPCR assays. The technician conducting the qPCR analysis was experienced in the method; the technician was not blinded to the test samples. Diagnostic sensitivity (DSe), diagnostic specificity (DSp), and positive and negative likelihood ratios (LRs) were estimated as previously described2,5,21 or by using EpiTools (http://goo.gl/BimzdF).
ENV infection progression
To investigate ENV progression, 20 naïve Pacific herring were injected with supernatant derived from ENV-infected tissue homogenates as described above. Five fish were sampled from this group at 5, 10, 15, and 20 dpi. Blood and kidney sampling, blood smear analysis, and qPCR detection of ENV DNA were performed as described above. The difference in log mean ENV DNA copy numbers in samples with and without detectable inclusions bodies was evaluated by t-test. m
Results
ENV major capsid protein
A contig with similarity to an iridovirus MCP was identified from previously described next-generation sequence data. 6 Sanger sequencing was used to confirm a 1,211 nucleotide region that included a partial ORF encoding 388 amino acids of the putative MCP. This MCP ORF appeared to lack ~70–90 amino acids of the C-terminus based on comparison to MCP sequences of other iridoviruses. We determined partial MCP sequences from an ENV-infected Pacific herring sampled near Port Townsend Bay (Port Townsend, Washington; GenBank KT211480) and near Malcolm Island (North Vancouver Island, British Columbia, Canada; GenBank KT211481). These sequences differed at 1 synonymous nucleotide substitution (0.09% nucleotide difference). The ENV MCP amino acid sequence differed from other iridovirus MCP sequences by 47–55% (Table 1). Although MCP gene sequences of other erythrocytic iridoviruses were not available in GenBank, the ENV MCP sequence determined herein did not cluster with homologs from members of any of the established genera of family Iridoviridae (Fig. 1).
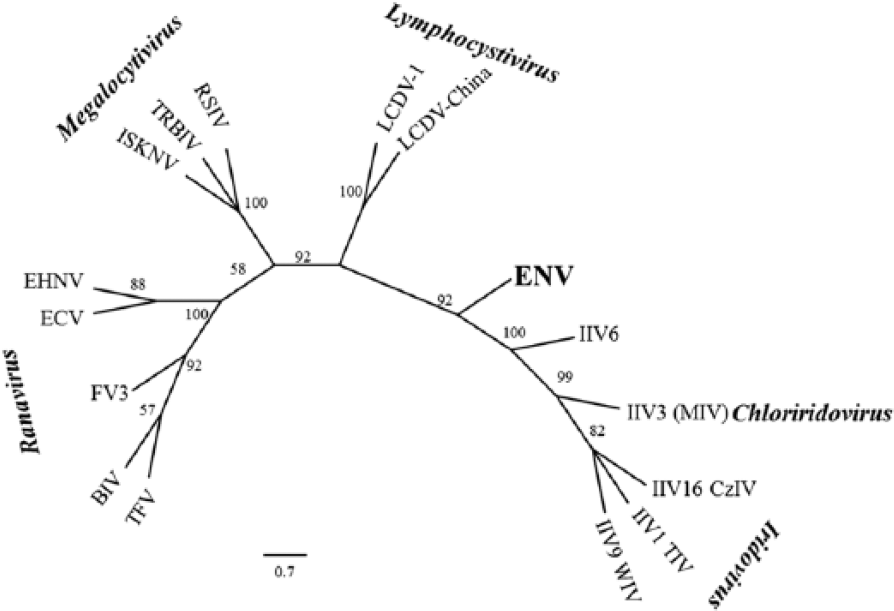
Relationship of erythrocytic necrosis virus (ENV) to other iridoviruses based on partial sequencing of the major capsid protein. Evolutionary relationships were inferred using the maximum likelihood with Poisson correction model. The numbers above the nodes represent bootstrap support after 1,000 replicates. Virus names, iridovirus genus, and GenBank accessions are listed in Table 1.
Assay development
Nucleotide BLAST 1 searches of the MCP and ATPase qPCR primer and probe sequences revealed no sequences with significant homology. Initial tests of the qPCR assays revealed that infected fish tissues can harbor extremely high ENV copy numbers (<15 Cq); templates with high copy numbers yielded better results when diluted 1:100. We observed no effect on assay sensitivity when an exogenous IPC reagent was included in the reaction (Table 3); the IPC is a control to detect false negatives due to PCR inhibitors. We observed no effect on assay sensitivity when the fluorescent VIC k -labeled APC probe was included in the reaction (Table 3); the APC probe is a control designed to detect false-positive reactions due to contamination with the artificial positive control. The IPC and APC probes are both labeled with the same reporter molecule so they were not tested simultaneously. The ATPase qPCR reaction did not perform optimally with a universal commercial master mix o as evidenced by higher Cq value, but no Cq differences were observed with the other commercial master mixesl,p (Table 3). Our standard operating procedure for the analytical and diagnostic validation used a commercial master mix l and included the APC probe in the duplex reaction.
Analytical validation
The slopes of the lines obtained when serial 10-fold dilutions of the APC plasmid were analyzed were −3.5 and −3.6 for the MCP and ATPase qPCR assays, respectively (Fig. 2A, 2C). Similar slopes were obtained for total DNA tested with the MCP (–3.9) and ATPase (–3.7) qPCR assays (Fig. 2B, 2D), indicating similar, and near optimal, PCR reaction efficiencies for both template types. Both the MCP and ATPase qPCR assays reliably detected APC plasmid DNA copies ranging from 5 × 10⁷ to 50 copies per reaction; a final dilution to 5 copies was detected in 3 of 4 technical replicates for both assays (Fig. 2A, 2C). A serially diluted total DNA sample derived from the kidney of an ENV-infected herring, which amplified with a starting Cq value of 22.0 equating to 1.3 × 10⁵ copies per reaction, was reliably detected to a lower limit of an estimated 13 copies per reaction using the ATPase qPCR assay (Fig 2D). The MCP qPCR assay detected 13 copies per reaction in 3 of the 4 technical replicates (Fig. 2B). The MCP and ATPase qPCR assays did not produce detectable amplification when DNA from other iridoviruses (RSIV, ISKNV, or LCDV) was used.
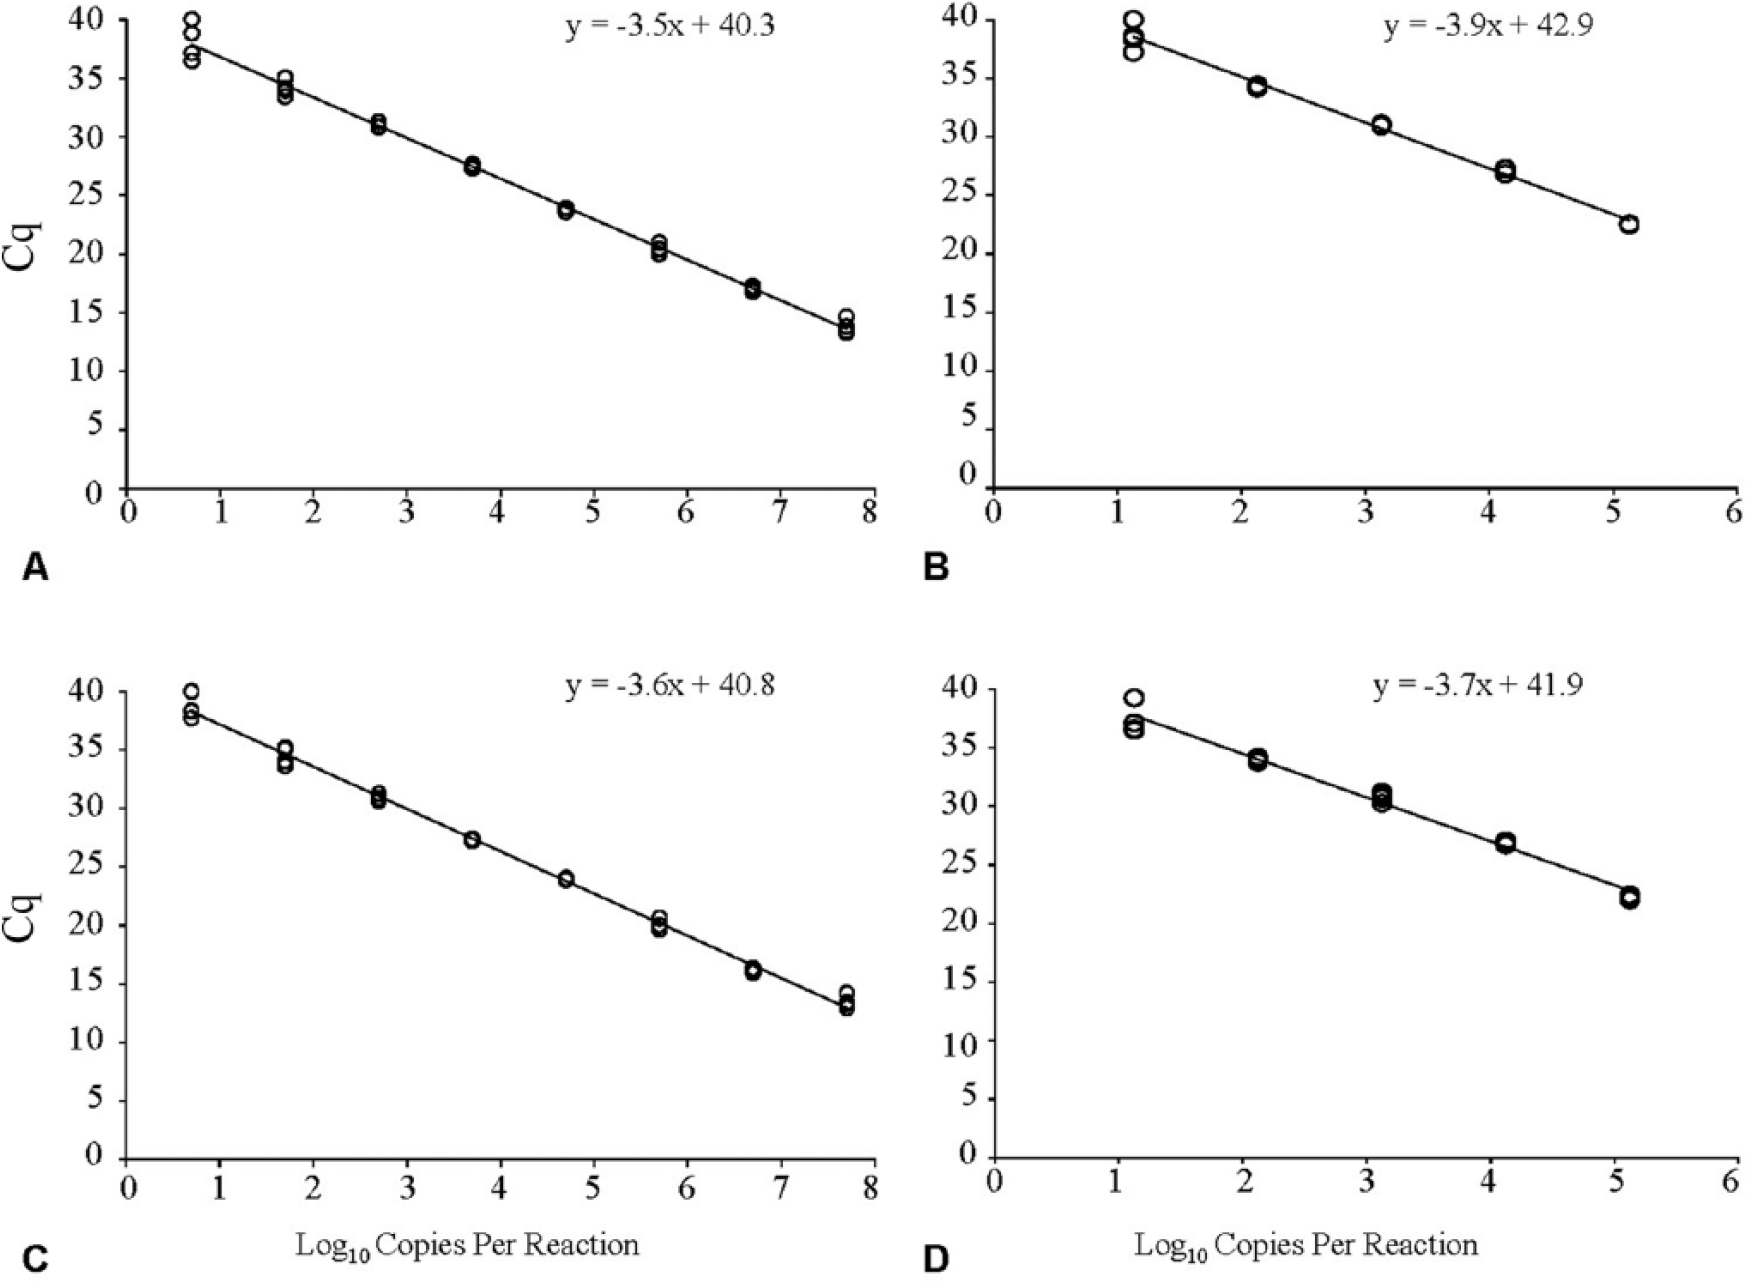
Analytical sensitivity of the erythrocytic necrosis virus (ENV) quantitative real-time PCR assays targeting the major capsid protein (MCP) or ATPase-like gene. Serial dilutions of (
Three ENV-infected Pacific herring DNA samples were tested in 10 replicate wells to evaluate the within-run repeatability. Between-run repeatability was evaluated by testing the same samples in quadruplicate over 4 separate days. For the MCP qPCR assay, the within-run repeatability CV range was 0.6–1.3% and the between-run repeatability CV range was 0.8–1.4% (Table 4). For the ATPase qPCR assay, the within-run repeatability CV range was 0.5–1.7% and the between-run repeatability CV range was 0.5–1.1% (Table 4). There was a general trend toward lower repeatability in sample 3, which had a mean Cq value of 35.9, suggesting repeatability decreased as ENV copy number decreased.
Within-run and between-run repeatability of the major capsid protein (MCP) and ATPase-like quantitative real-time PCR assays.*
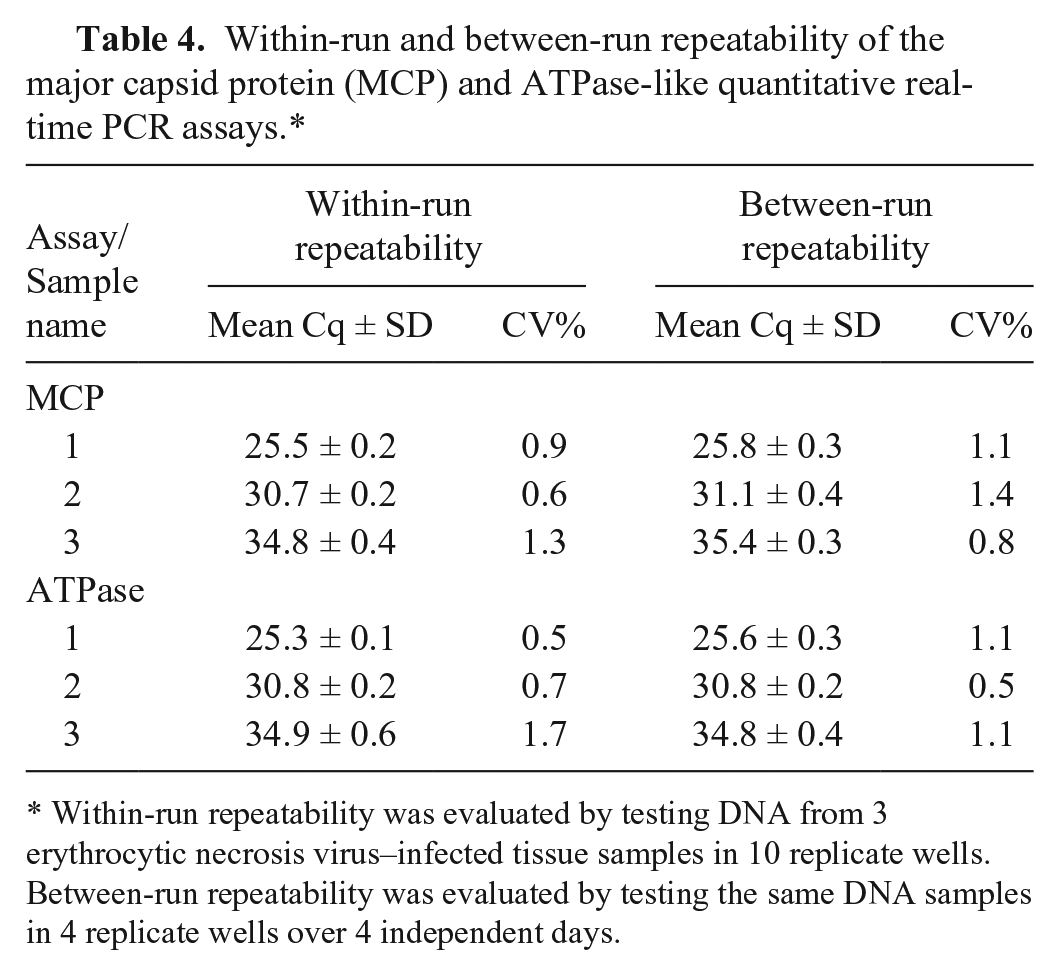
Within-run repeatability was evaluated by testing DNA from 3 erythrocytic necrosis virus–infected tissue samples in 10 replicate wells. Between-run repeatability was evaluated by testing the same DNA samples in 4 replicate wells over 4 independent days.
Diagnostic validation of ENV qPCR assays
The MCP and ATPase ENV qPCR assays were tested on a population of 100 Pacific herring for which half the fish were injected with medium (n = 50 assumed as true negative) and the other half with ENV-positive tissue homogenates (n = 50 assumed as true positives). All 50 true negative fish tested negative by the ATPase qPCR assay, whereas 49 of the 50 fish tested negative by the MCP qPCR assay. All 50 true-positive fish tested positive by both the MCP and ATPase qPCR assays. DSe of both qPCR assays was 1.00 (95% confidence interval [CI]: 0.93–1.00). DSp was calculated for the MCP assay as 0.98 (95% CI: 0.90–1.00) and for the ATPase assay as 1.0 (95% CI: 0.93–1.00; Table 5). The positive and negative LRs for both the MCP and ATPase ENV qPCR assays were LR+ = 99.0 and LR– = 0.01. Technical difficulties made a number of blood smears unreadable and so only 87 total fish were evaluated for viral inclusion bodies. Viral inclusions were noted in 0 of 48 true-negative fish and 38 of 39 true-positive fish. DSe and DSp for blood smear analysis was 0.97 and 1.0, respectively. The diagnostic odds ratio (DOR), which defines how well a test correctly classifies a sample, was highest for the ATPase qPCR assay (9,901), followed by the MCP assay (9,800), and lowest for blood smear analysis (3,761).
Comparison of 3 diagnostic tests for erythrocytic necrosis virus (ENV), including blood smears to visualize intraerythrocytic inclusion bodies, quantitative real-time PCR (qPCR) for the ENV major capsid protein (MCP) and qPCR for the ENV ATPase-like gene.*
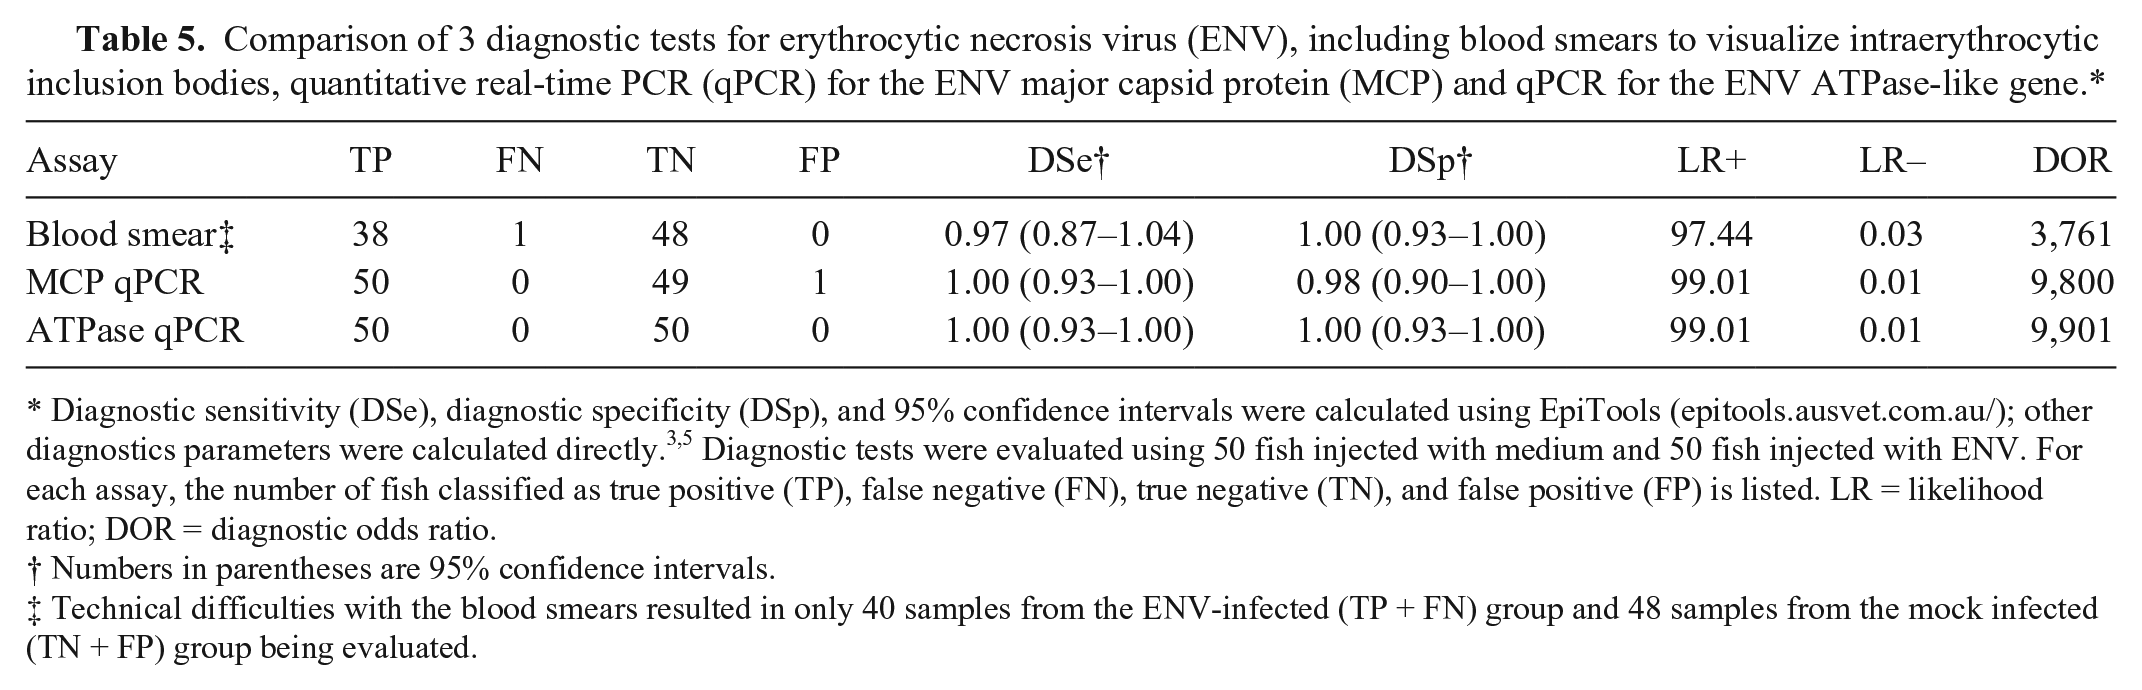
Diagnostic sensitivity (DSe), diagnostic specificity (DSp), and 95% confidence intervals were calculated using EpiTools (epitools.ausvet.com.au/); other diagnostics parameters were calculated directly.3,5 Diagnostic tests were evaluated using 50 fish injected with medium and 50 fish injected with ENV. For each assay, the number of fish classified as true positive (TP), false negative (FN), true negative (TN), and false positive (FP) is listed. LR = likelihood ratio; DOR = diagnostic odds ratio.
Numbers in parentheses are 95% confidence intervals.
Technical difficulties with the blood smears resulted in only 40 samples from the ENV-infected (TP + FN) group and 48 samples from the mock infected (TN + FP) group being evaluated.
ENV infection progression
Detection of ENV in kidney tissue by qPCR and presence of cytoplasmic inclusion bodies in the erythrocytes were evaluated in laboratory-challenged Pacific herring. Copy numbers determined by the MCP or ATPase ENV qPCR assays were highly correlated (r2 = 0.99; data not shown). ENV DNA was detected at the first sampling time point (5 dpi), continued to increase until 20 dpi, and levels remained similar until the final sample at 25 dpi (Fig. 3A, 3B). In contrast, erythrocytic inclusion bodies were not observed until 10 dpi and continued to increase until achieving maximum value at 25 dpi (Fig. 3C). Both ENV qPCR assays detected DNA in 100% of the injected fish, whereas only 72% of the fish had detectable inclusion bodies. The mean log viral load of fish that had detectable intraerythrocytic inclusion bodies was 1.8 × 10⁸ MCP copies per reaction, whereas fish with undetectable intraerythrocytic inclusion bodies had a significantly lower 2.3 × 10² copies per reaction (t-test; p < 0.001); a similar magnitude of difference between samples was assessed as positive or negative for inclusion bodies and tested using the ATPase qPCR assay (p < 0.0001; Fig. 3D).
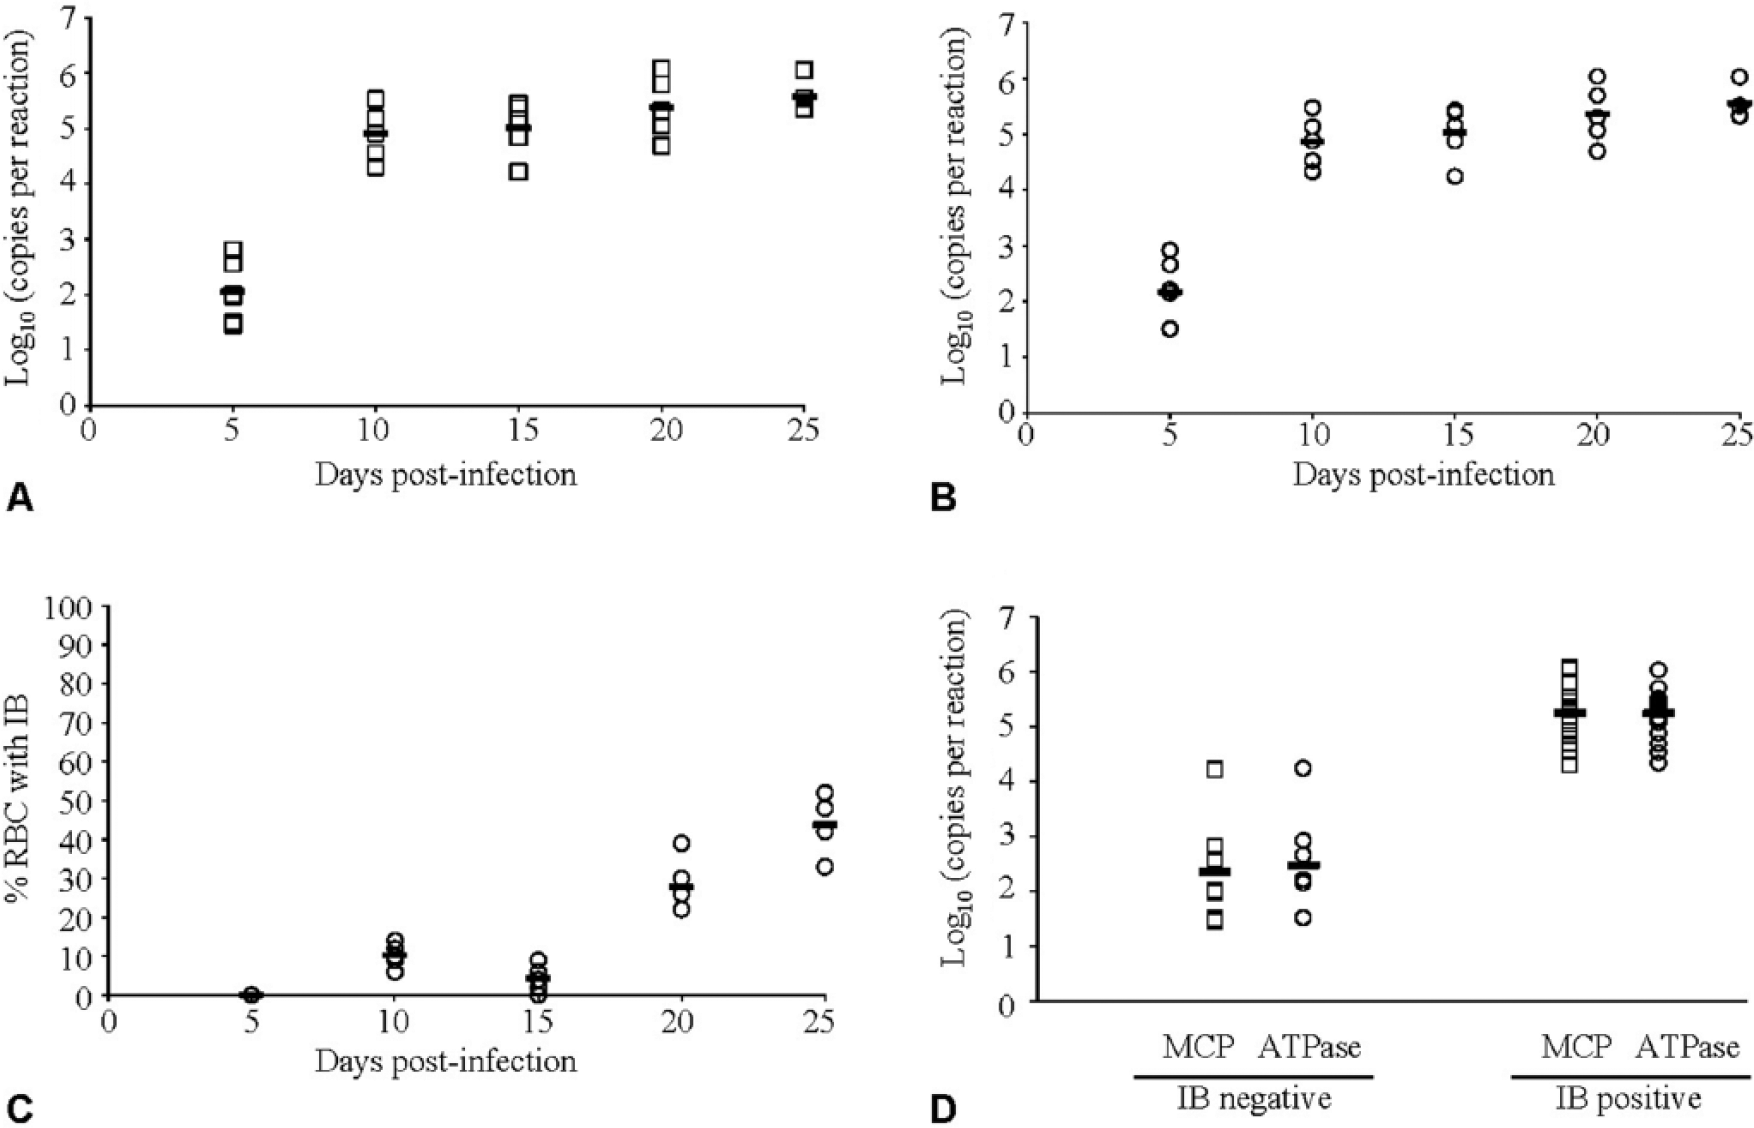
Progression of erythrocytic necrosis virus (ENV) infection in Pacific herring (Clupea pallasii) measured with quantitative real-time PCR (qPCR) assays targeting the (
Discussion
Phylogenetic analysis of the conserved DNA polymerase gene indicates that ENV groups with several reptilian erythrocytic viruses, which may constitute the sixth genus within the family Iridoviridae. 6 In our study, the MCP gene, which is often used for phylogenetic studies of iridoviruses, was evaluated. 27 Viruses from distinct iridovirus genera have ~50% amino acid variation in the MCP gene. 27 Unfortunately, MCP sequences were not available from the reptilian erythrocytic iridoviruses.4,10,26 However, the ENV MCP differed by 47–54% amino acids when compared to other iridoviruses assigned to 1 of the 5 accepted genera (http://www.ictvonline.org/virusTaxonomy.asp), supporting the conclusion that ENV is a novel member of the family. The disease VEN has been reported from a large number of marine fish species, from both the Atlantic and Pacific Ocean and Northern and Southern hemispheres. 3 It is not clear how ENV may vary across the reported wide host and geographic range or if all previous reports of ENV represent a single virus species. For instance, differences in virion ultrastructure and size were noted in Atlantic herring (Clupea harengus) and Atlantic cod (Gadus morhua) that were presumptively diagnosed with VEN. 16 We made multiple attempts to obtain ENV-infected fish tissues from other geographic locations outside the Salish Sea for use in this study but we were not successful. Thus, these assays should be used cautiously when diagnosing VEN in fish from regions outside the Salish Sea.
Diagnostic validation indicated that the 2 new ENV qPCR assays developed herein have similar DSe and DSp as blood smear analysis. The ATPase qPCR assay yielded the highest DOR value indicating that this test was the most likely to correctly classify the samples; although a very similar DOR was obtained for the MCP qPCR assay. To estimate DSe and DSp, all test samples were classified as either positive or negative by qPCR regardless of viral copy number. Viral copy quantification is not necessarily needed for ENV diagnosis but this information may contribute to a better understanding of the relationship between virus copy number and clinical disease. Our diagnostic validation study in Pacific herring examined only a single time point when intraerythrocytic inclusion bodies were evident. However, sequential sampling revealed detectable viral DNA by 5 dpi, whereas erythrocytic inclusion bodies were not observed until the next time point, 10 dpi. Thus, the qPCR assays may detect ENV DNA during early infection or in light infections. The transient delay in inclusion body formation in our progression study was consistent with previous laboratory challenge studies and confinement studies in Pacific herring, which found detectable erythrocytic inclusion bodies appearing in a low percentage of cells 4–6 days after initiation of the epizootic.9,12 Although DSe and DSp of blood smear analysis was similar to the qPCR assays, it should be noted that technical difficulties were encountered with the analysis of some blood films, where cell lysis occurred after inadvertent contact with seawater. We were not able to confidently analyze 20% of blood smear slides from the ENV-infected fish. If we had chosen to classify unreadable smears as negative test results and included these results in our DSe and DSp calculations, the molecular assays would have had significantly higher DSe relative to blood smear analysis. However, blood smear analysis has the advantage that it provides additional clinical information regarding the severity of anemia, erythroblast proliferation, and leukocytopenia.
Some naturally infected wild herring with heavy intensities of infection have demonstrated extremely high viral loads with >5 × 10⁹ DNA copies per PCR reaction (Cq values <10; data not shown). At times, extracted DNA from ENV-infected herring needed to be diluted 100-fold to obtain amplification within the linear range of the assay. The high virus copy number in samples may increase the likelihood of cross-contamination of samples during DNA extraction and assay preparation, and negative controls should be included throughout the sample processing. 19 It is advisable that samples representing different populations be processed separately to avoid cross-contamination. One approach commonly used to reduce potential false-positive test results is to select a quantification cycle cutoff value (e.g. Cq < 35) with the assumption that low levels of PCR amplification are due to probe degradation, nonspecific amplification, or cross-contamination. 2 In our study, the single false-positive test result obtained with the MCP qPCR had a mean Cq of 38.5 (0.3 viral copies per PCR reaction). Thus, a Cq cutoff of 38 would have eliminated the false-positive test result and maximized the DOR for the MCP qPCR assay. However, it cannot be excluded that the single fish classified as a false positive actually had a low level, covert ENV infection. Unfortunately, we did not have duplicate tissue samples available for retesting because of the small size of the fish used in this study. Further research is needed to determine if ENV can persist in asymptomatic carrier fish and, if so, to determine the accuracy of the existing diagnostic tests to identify these carrier fish. Ultimately, the use of a cutoff value for interpreting qPCR results depends on test purpose and the relative importance of minimizing false-positive or false-negative test results. 2
Nearly all nonmammalian vertebrates, including fish, have nucleated erythrocytes that are specifically targeted by a variety of pathogens. 15 In fish, a number of viruses are associated with intraerythrocytic cytoplasmic inclusion bodies, including ENV, erythrocytic inclusion body syndrome virus (EIBSV),14,22 piscine orthoreovirus (PRV), 7 rainbow trout Oncorhynchus mykiss erythrocytic virus (Landolt ML, et al., 1977), intraerythrocytic virus–like particle in coho salmon (O. kisutch; Hedrick RP, et al., 1987), and viral erythrocytic infection virus (VEIV). 18 Among these, genomic sequence data are available to date for only ENV and PRV,6,17 and PRV is the only intraerythrocytic virus for which polyclonal antibodies are available. 8 Thus, confirmatory diagnosis of most intraerythrocytic viruses still requires ultrastructural analysis by TEM. The sensitive and specific molecular assays reported herein will facilitate more rapid and accurate confirmatory diagnosis of ENV and will help to distinguish this virus from other intraerythrocytic viruses that form inclusion bodies. Additionally, these molecular assays will be especially useful for diagnostic cases where blood films are not collected from fresh specimens. For example, observations of fish die-offs in remote locations are typically reported by fisheries biologists and/or members of the public who typically freeze samples at −20°C until the appropriate diagnostic authority is identified. Prior to the advent of PCR-based ENV assays, the possible involvement of ENV in these fish die-off events was difficult to assess because of the inability to collect quality blood films from previously frozen carcasses.
The ENV qPCR assays developed in our study can be used as a primary screening surveillance tool for ENV infections or for confirmatory diagnosis of presumptive VEN. However, the diagnostic utility of these ENV qPCR assays should be considered limited because our study only targeted Salish Sea populations of Pacific herring using laboratory challenges with endemic strains of ENV to create populations of known infection status. More work is needed to validate these ENV assays in natural populations, including their applicability for use in other host species and geographic locations. Sequencing of ENV genes, particularly the MCP gene, from a broad range of fish demonstrating clinical cases of VEN will help to better define the potential genetic diversity present in this viral species.
Footnotes
Acknowledgements
Dr. Tom Waltzek (University of Florida) provided DNA from other iridoviruses for specificity testing. Dr. Kyle Garver (Fisheries and Oceans and Canada) provided ENV-infected Pacific herring samples for our research. Technical assistance at the U.S. Geological Survey–Marrowstone Marine Field Station was provided by Ashley Mackenzie and Megan Yanney.
Authors’ note
The use of trade, firm, or corporation names in this publication is for the information and convenience of the reader. Such use does not constitute an official endorsement or approval by the U.S. Government of any product or service to the exclusion of others that may be suitable.
Authors’ contributions
MK Purcell, S Pearman-Gillman, and RL Thompson drafted the manuscript. MK Purcell and PK Hershberger contributed to conception and design of the study; contributed to acquisition, analysis, and interpretation of data; critically revised the manuscript; and gave final approval. S Pearman-Gillman contributed to design of the study, and contributed to acquisition, analysis, and interpretation of data. RL Thompson contributed to design of the study; contributed to acquisition and interpretation of data; critically revised the manuscript; and gave final approval. JL Gregg contributed to design of the study; contributed to analysis and interpretation of data; and gave final approval. LM Hart contributed to design of the study; contributed to analysis and interpretation of data; critically revised the manuscript; and gave final approval. JR Winton and EJ Emmenegger contributed to conception of the study; contributed to acquisition of data; critically revised the manuscript; and gave final approval. All authors agreed to be accountable for all aspects of the work in ensuring that questions relating to the accuracy or integrity of any part of the work are appropriately investigated and resolved.
a.
Cyclop-eeze, Argent Chemicals, Redmond, WA.
b.
Bio-Olympic, Bio-Oregon, Longview, WA.
c.
Qiagen DNeasy mini kit, Qiagen Inc., Valencia, CA.
d.
NanoDrop 1000, Thermo Scientific, Wilmington, DE.
e.
Taq PCR core kit, Qiagen Inc., Valencia, CA.
f.
ABI 3130 genetic analyzer, Life Technologies, Carlsbad, CA.
g.
Big Dye terminator v. 1.1, Life Technologies Inc., Carlsbad, CA.
h.
Sequencher V.5.2.4 software, Gene Codes Corp., Ann Arbor, MI.
i.
Primer Express software V.3.0 Life Technologies, Carlsbad, CA.
j.
pIDT Smart vector, Integrated DNA Technologies, Coralville, IA.
k.
ViiA 7 real-time PCR system, Life Technologies Inc., Carlsbad, CA.
l.
TaqMan gene expression master mix, Life Technologies Inc., Carlsbad, CA.
m.
InStat version 3, GraphPad, La Jolla, CA.
n.
TaqMan exogenous internal positive control reagents, Life Technologies Inc., Carlsbad, CA.
o.
TaqMan universal PCR master mix, Life Technologies Inc., Carlsbad, CA.
p.
FastStart PCR master, Roche Life Sciences, Indianapolis, IN.
Declaration of conflicting interests
The author(s) declared no potential conflict of interest with respect to the research, authorship, and/or publications of this article.
Funding
The author(s) disclosed receipt of the following financial support for the research, authorship, and/or publication of this article: This project was funded by the U.S. Geological Survey and Exxon Valdez Oil Spill Trustee Council (EVOS) project 12120111-K.