
Abstract
An outbreak of low-pathogenicity avian influenza (LPAI) H7N2 occurred in 2002 in the Shenandoah Valley, a high-density poultry production region in Virginia. Infected flocks were identified through a combination of observation of clinical signs and laboratory diagnostic tests designed to detect avian influenza (AI) antibodies, virus, or H7-specific RNA. In this report, fitness for purpose of 3 virus/RNA detection assays used during the outbreak was examined: 1) antigen capture enzyme immunoassay (AC-EIA), 2) real-time reverse transcription polymerase chain reaction (RRT-PCR), and 3) virus isolation (VI). Results from testing 762 turkey and 2,216 chicken tracheal swab pooled specimens were analyzed to determine diagnostic sensitivities and specificities of these tests under field conditions using Bayesian techniques for validation of diagnostic tests in the absence of a “gold standard.” Diagnostic sensitivities (with 95% probability intervals) in turkeys of AC-EIA and RRT-PCR, in reference to VI, were 65.9 (50.6; 81.3)% and 85.1 (71.9; 95.7)% and of VI 92.9 (78.0; 98.8)% in reference to AC-EIA or 88.7 (76.0; 97.2)% in reference to RRT-PCR; in chickens, diagnostic sensitivities were 75.1 (45.6; 94.2)%, 86.3 (65.9; 97.1)%, and 86.2 (65.8; 97.1)% or 86.3 (66.4; 97.2)%, respectively. Specificities were 99.1 (97.9; 99.8)%, 98.9 (98.0; 99.5)%, and 98.6 (97.4; 99.4)% or 98.8 (97.8; 99.5)% in turkeys and between 99.25% and 99.27% with probability intervals of approximately ±0.4% for all tests in chickens. Simultaneous use of AC-EIA and RRT-PCR contributed significantly to the rapid control of the outbreak, but the AI RRT-PCR assay with >85% sensitivity and ∼99% specificity, combined with relatively low cost and fast turnaround, could be used as the sole diagnostic test in outbreaks of LPAI.
Introduction
Low-pathogenicity avian influenza (LPAI) of the subtype H7N2 was first diagnosed in a Virginia flock on March 12, 2002, with the last infected flock being identified July 2, 2002. 1 One hundred ninety-seven premises (125 commercial turkey [meat birds], 28 turkey breeder, 13 broiler, 29 broiler breeder, and 2 layer farms) with 4.74 million birds were declared infected and were depopulated to stop the spread of the virus.
Systematic sampling and rapid detection of infected birds are essential for control and eradication of any contagious avian disease. The Virginia Department of Agriculture and Consumer Services (VDACS), prior to the outbreak, had been conducting AI serologic surveillance in all commercial turkey flocks at slaughter using the agar gel immunodiffusion (AGID) test. In addition, broiler and turkey breeder flocks were tested quarterly by AGID, and all sick birds submitted for diagnostic evaluation were tested by AGID, histopathology, and virus isolation.
Upon initial detection of the LPAI H7N2 virus, premovement testing of all breeder birds, commercial turkeys, and broilers, as well as mandatory testing of all flocks with respiratory disease signs, were im- plemented by the Virginia Avian Influenza Task Force. 1 In addition, weekly testing of all flocks within the 10 counties affected was implemented regardless of clinical status. This program was referred to as “barrel surveillance” because daily mortalities were collected and placed in barrels at the end of the driveway of each premises. Barrel surveillance speci- mens were first tested by antigen capture enzyme immunoassay (AC-EIA)* a at the VDACS laboratory in Harrisonburg, Virginia, then shipped to the National Veterinary Services Laboratories (NVSL) in Ames, Iowa, where they were tested by real-time reverse transcription polymerase chain reaction (RRT-PCR) 11,12 and by virus isolation (VI). Regulatory criteria for declaring a premises positive for AI were based on detection of H7N2 by VI or the presence of at least 2 of the following: 1) clinical signs compatible with AI or presence of antibodies (positive AGID test), 2) positive AC-EIA, 3) positive RRT-PCR.
Of the 197 confirmed positive flocks, AGID contributed to the detection of AI in 59 cases; the AC-EIA in 170 cases; the RRT-PCR, which was introduced after the peak of the outbreak, in 44 cases; and virus isolation in 153 cases. Clinical signs contributed to the diagnosis in 141 cases; in 90 cases, clinical signs were the first indication of infection. Clinical signs (respiratory distress in meat birds or respiratory signs plus a drop in egg production in breeders or layers) were seen in 115 of 153 (75.2%) positive turkey flocks but only in 26 of 44 (59%) chicken flocks infected with the LPAI H7N2 virus (Fisher's Exact P = 0.038).
The objective of this study was to estimate diagnostic sensitivity and specificity and fitness for purpose of the AC-EIA and the RRT-PCR, which had not been validated for use in poultry at the time of the Virginia LPAI H7N2 outbreak.
Materials and methods
Specimens
All pooled tracheal swab specimens that were collected for the barrel surveillance program 1 from April 30 through May 15, 2002, which were tested with all 3 diagnostic tests, i.e., AC-EIA, RRT-PCR, and VI, and for which complete records were available, were included in this study. The 2,978 pooled specimens originated from 714 premises in 10 Virginia counties, with 762 specimens from turkeys and 2,216 specimens from chickens.
Between 8 and 125 turkey specimens were received each of 13 days between April 30 and May 15, 2002. Turkey specimens originated from 235 premises, with 1 to 23 swab specimens collected per premises. Seventy-eight specimens were from breeder farms and 684 from grower farms, with 380 specimens from all female flocks and 252 from all male flocks (sex of the flock was not recorded for 130 specimens). Two hundred forty-two specimens were received from 57 premises that became positive at some point during the outbreak.
Between 26 and 378 chicken specimens were received each of the same 13 days. Chicken specimens originated from 479 premises, with 1 to 40 specimens collected per premises. One hundred thirty-one specimens were from breeder flocks, 1,954 from broiler flocks, 73 from layer flocks, and 58 from pullet farms. Eighty-two specimens were received from 23 premises that became positive at some point during the outbreak.
Specimen collection
All poultry producers in the affected counties were required, on 1 morning each week during the outbreak, to place 10 birds per house of the previous night's mortalities or sacrificed birds in a specially designated container at the entrance to their premises. Specimens were collected between 9:00 AM and 12:00 PM the same day. By the time of specimen collection, birds may have been dead for amounts of time ranging from minutes to 12 hours or longer. Collectors swabbed the exposed and opened trachea of each dead bird with a dry cotton swab. Five swabs were then placed (pooled) in a tube containing 2 ml of brain-heart infusion (BHI) broth that had not been supplemented with antimicrobials or antimycotics. Swabs were squeezed out against the side of the tube and removed from the tube prior to closing the tube. Tubes were delivered on the day of specimen collection to the VDACS laboratory in Harrisonburg. After testing of specimens by AC-EIA for presence of AI A antigen, specimens were shipped under refrigeration to the NVSL in Ames.
Antigen capture enzyme immunoassay
Upon arrival at the VDACS, 125 μl of the swab specimen were tested by AC-EIA a according to the manufacturer's protocol. For specimens yielding a positive result, the test was repeated with omission of the influenza A monoclonal antibody (reagent #3); a positive outcome in the second, modified run characterized the first reaction as false positive, and the specimen was classified test negative.
Real-time reverse transcription polymerase chain reaction assay
Specimen preparation and testing by RRT-PCR were performed as previously described. 12 RNA was extracted from 500 μl of swab specimen with the RNeasy kit b and tested with the paninfluenza A virus matrix gene primer set and Qiagen 1-step RT-PCR kit. b Matrix gene-positive specimens were further tested for the H7 subtype. Specimens that were positive on both the matrix gene test and the test for the H7 subtype were considered RRT-PCR positive for the analyses of performance of diagnostic tests. Nine specimens that were matrix-gene positive but H7-subtype negative were considered RRT-PCR negative for those analyses. Amplification and detection were performed using the Idaho Technologies Ruggedized Advanced Pathogen Identification Device (RAPID), c the Roche Lightcycler, d or the Cepheid Smart Cycler e thermocyclers and software. 12,13
Virus isolation
Specimens for virus isolation were processed as previously described. 10 Briefly, the swab specimen tubes were centrifuged at 1,500 × g for 20 minutes. The supernatant (1.0-1.5 ml) was diluted with tris-buffered tryptose broth to a quantity of 2 ml and then transferred to a vial containing 1.3 ml of antibiotic diluent. Specimen-antibiotic mixtures were incubated for approximately 1 hour at room temperature, and 0.3 ml was inoculated into the allantoic sac of 4 9- to 11-day-old embryonated chicken eggs derived from specific pathogen-free flocks. Inoculated eggs were incubated at 36 to 37°C for 4 days. Chorioallantoic fluid (CAF) was harvested from embryos dying after 24 hours and from embryos that survived after 4 days of incubation. The CAF was tested for hemagglutination activity using U-bottom microtiter plates with 0.5% chicken erythrocytes as previously described. 14 Influenza A virus was identified using standard hemagglutination inhibition and neuraminidase inhibition assays. 14,16
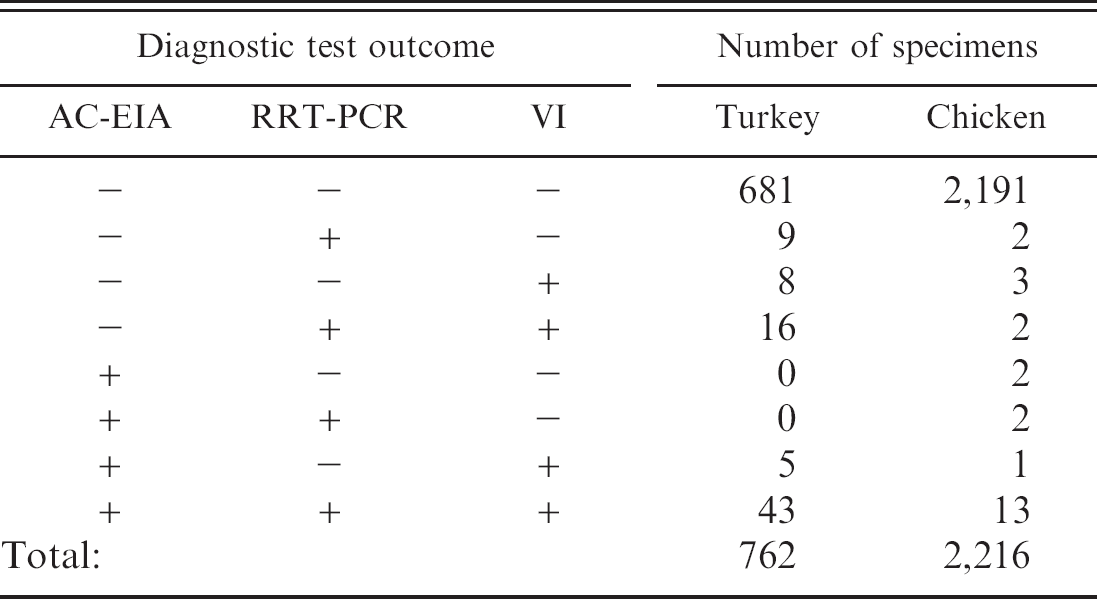
Frequencies of virus detection by antigen capture enzyme immunoassay (AC-EIA), real-time reverse transcription polymerase chain reaction (RRT-PCR) assay, and virus isolation (VI) in 762 turkey and 2,216 chicken specimens
Data analyses
The relative ability of the AC-EIA and RRT-PCR to classify specimens as originating from infected or non-infected birds was first evaluated using virus isolation as the reference test. Calculations were done using Proc FREQ of SAS®. f Percentages are presented with exact 95% confidence intervals. Agreement between AC-EIA and RRT-PCR was evaluated by calculation of the Kappa value. Diagnostic test sensitivities and specificities were determined for all 3 tests through Bayesian modeling using WinBUGS code. e The code for estimation of sensitivities and specificities of 2 conditionally dependent tests (AC-EIA and VI or RRT-PCR and VI) applied to subjects from 1 single population had been prepared by Adam Branscum 2 and posted at http://www.epi.ucdavis.edu/diagnostictests/ (accessed 10/29/2005).
Results
Turkey specimens
Of the 762 turkey specimens tested (Table 1), 81 (10.63% [8.53; 13.04]) were positive by at least 1 of the diagnostic tests, with 48 (6.30% [4.68; 8.27] specimens positive by AC-EIA, 68 (8.92% [7.00; 11.18]) positive by RRT-PCR, and 72 (9.45% [7.47; 11.75]) positive by VI. Of 72 VI positive specimens (Table 2), 48 were AC-EIA positive and 59 were RRT-PCR positive. All of 690 specimens negative by VI were negative by AC-EIA, and 681 were negative by RRT-PCR (Tables 1, 2). Forty-three (5.64% [4.11; 7.53]) specimens were positive by both AC-EIA and RRT-PCR (Kappa = 72.08% [62.62; 81.54]). Four specimens were matrix gene positive but negative for the H7 subtype by RRT-PCR. Of these 4 specimens, 1 specimen was VI and AC-EIA positive, and the premises was declared infected; 2 specimens originated from a premises, from which infected specimens were obtained on the same day from other houses and which subsequently was declared infected; 1 specimen was negative on all other tests and originated from a premises that remained free of AI throughout the Virginia LPAI outbreak.
Chicken specimens
Of the 2,216 chicken specimens tested (Table 1), 25 (1.13% [0.73; 1.66]) were positive by at least 1 of the diagnostic tests, with 18 (0.81% [0.48; 1.28] specimens positive by AC-EIA, 19 (0.86% [0.52; 1.34]) positive by RRT-PCR, and 19 (0.86% [0.52; 1.34] positive by VI. Of 19 VI positive specimens (Table 2), 14 were AC-EIA positive and 15 were RRT-PCR positive. Of 2,197 specimens negative by VI, 2,193 were negative by AC-EIA and RRT-PCR (Tables 1, 2). Fifteen (0.68% [0.38; 1.11]) specimens were positive by both AC-EIA and RRT-PCR (Kappa = 80.9% [67.1; 94.8]). Five specimens were matrix gene positive but negative for the H7 subtype by RRT-PCR. All 5 specimens were negative on all other tests and originated from premises that remained free of AI throughout the Virginia LPAI outbreak.
Results of antigen capture enzyme immunoassay (AC-EIA) and real-time reverse transcription polymerase chain reaction (RRT-PCR) in 762 turkey and 2,216 chicken specimens, in relationship to virus isolation (VI) results
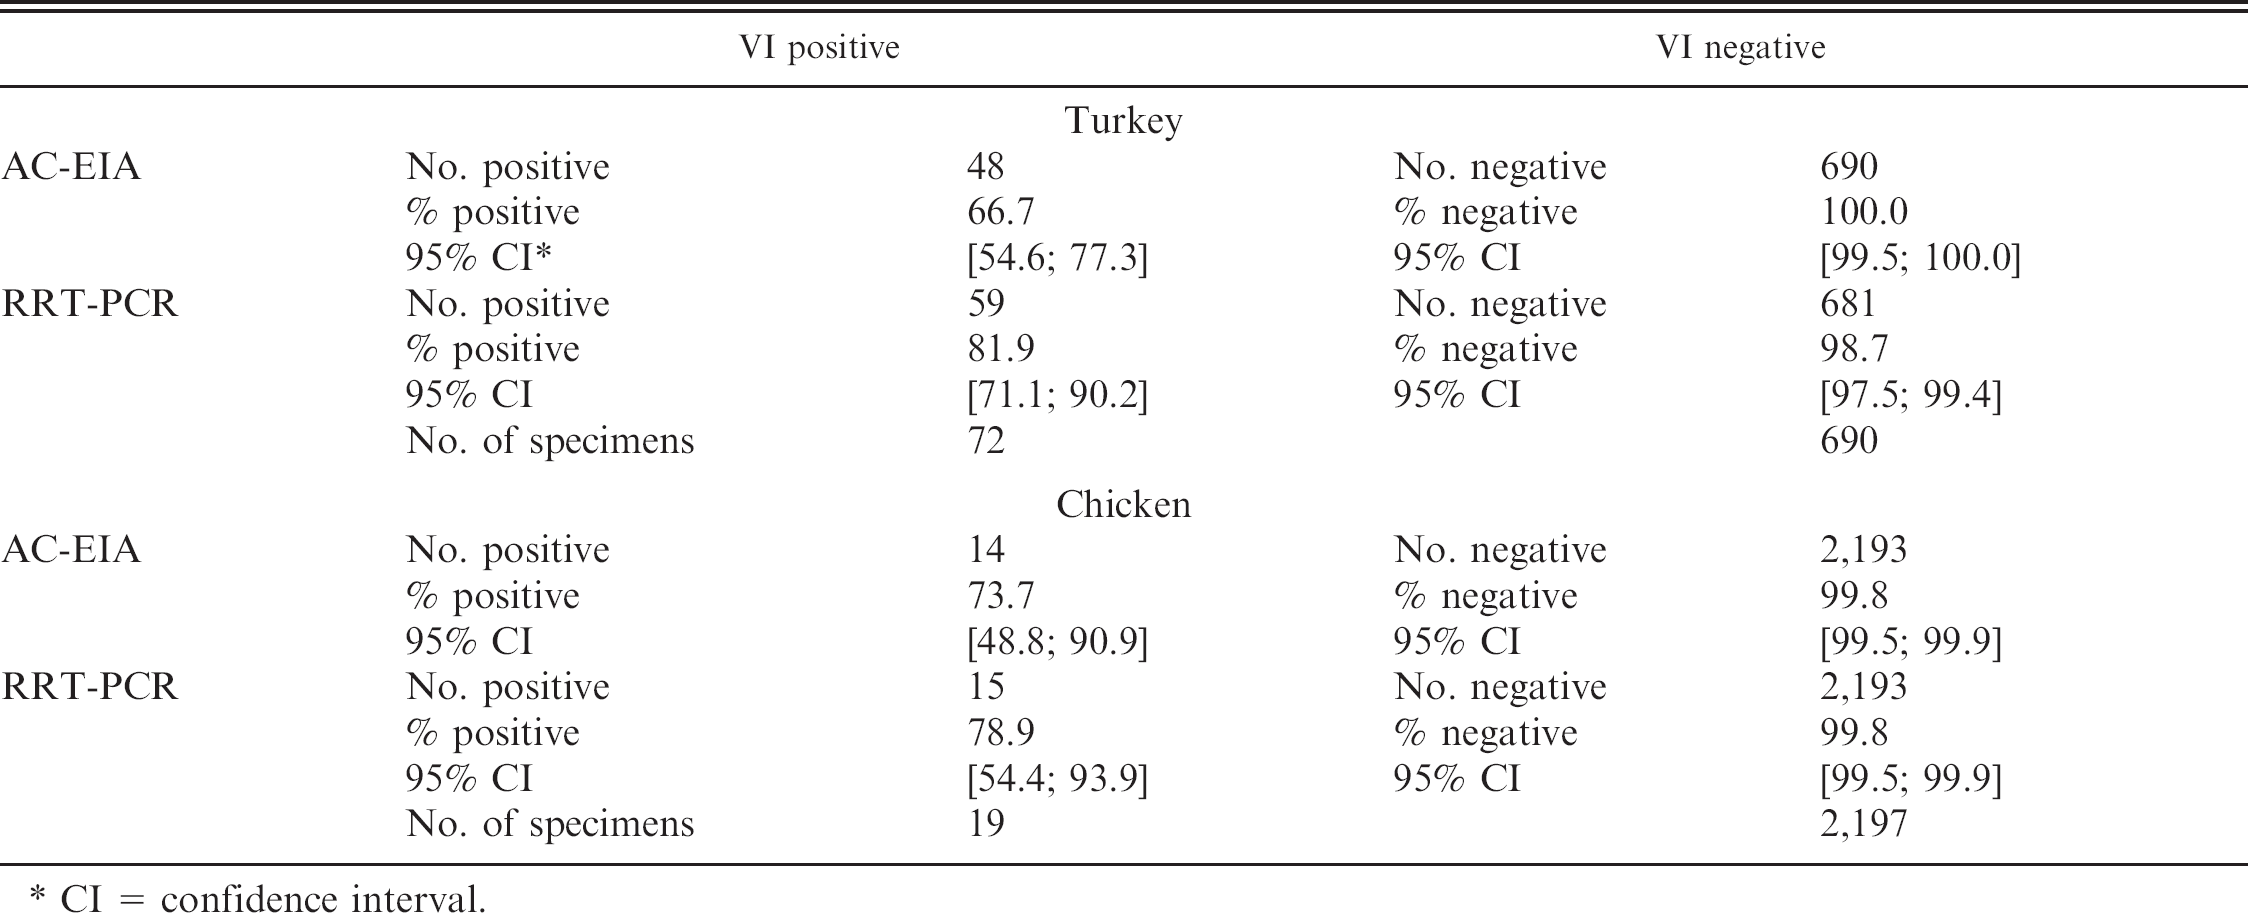
CI = confidence interval.
Medians for prevalence (p), sensitivity (se), specificity (sp), with 95% probability intervals when relating virus isolation and antigen capture enzyme immunoassay (AC-EIA, panel A) and virus isolation and real-time reverse transcription polymerase chain reaction (RRT-PCR) assay (panel B) performed on 762 turkey specimens
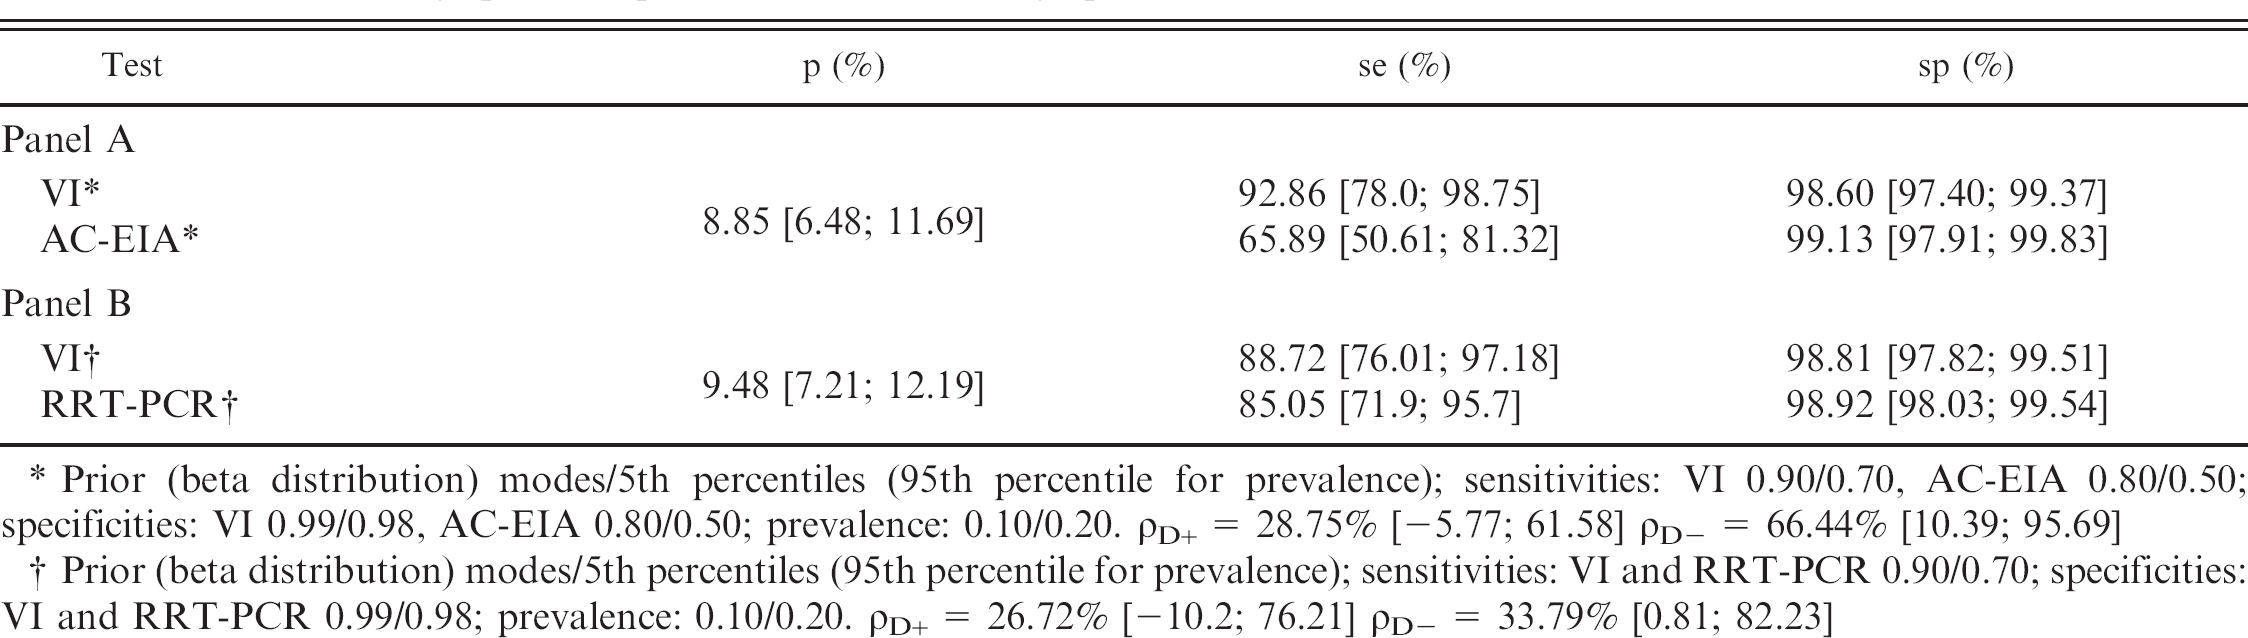
Prior (beta distribution) modes/5th percentiles (95th percentile for prevalence); sensitivities: VI 0.90/0.70, AC-EIA 0.80/0.50; specificities: VI 0.99/0.98, AC-EIA 0.80/0.50; prevalence: 0.10/0.20. ρD+ = 28.75% [-5.77; 61.58] ρD- = 66.44% [10.39; 95.69]
Prior (beta distribution) modes/5th percentiles (95th percentile for prevalence); sensitivities: VI and RRT-PCR 0.90/0.70; specificities: VI and RRT-PCR 0.99/0.98; prevalence: 0.10/0.20. ρD+ = 26.72% [-10.2; 76.21] ρD- = 33.79% [0.81; 82.23]
Validation
For validation of diagnostic tests on turkey and chicken specimens in the absence of a gold standard, beta-distributed prior sensitivities for VI and AC-EIA were selected with mode/5th percentiles of 0.90/0.70, and 0.80/0.50, respectively; for specificities, beta-distributed priors were selected to have mode/5th percentiles of 0.99/0.98 and 0.80/0.50, respectively. The prior sensitivities and specificities used for validation of VI and RRT-PCR were set for both tests at 0.90/0.70 and 0.99/0.98. The prevalence of AI in turkey specimens was modeled using a beta distribution with mode/5th percentiles of 0.10/0.20; in chicken specimens, prior prevalence parameters were 0.01/0.05. Uniform distributions were used for the 2 covariances.
Medians for prevalence (p), sensitivity (se), specificity (sp), and conditional correlations for infected (ρD+) and noninfected (ρD-)animals with 95% probability intervals when relating VI and AC-EIA and VI and RRT-PCR in turkey specimens are presented in Table 3. The point estimates for sensitivities of VI and AC-EIA were 92.9% and 65.9%, respectively, while point estimates for specificities were 98.6% and 99.1%, respectively, for an estimated prevalence of presence of virus in specimens of 8.9%. The point estimates for sensitivities of VI and RRT-PCR were 88.7% and 85.1, respectively, while point estimates for specificities were 98.8% and 98.9%, respectively, for an estimated prevalence of virus presence in specimens of 9.5%.
The same parameters for chicken specimens are presented in Table 4. The point estimates for sensitivities of VI and AC-EIA were 86.2% and 75.1%, respectively, while point estimates for specificities were each 99.3%, for an estimated prevalence of virus presence in specimens of 0.4%. The point estimates for sensitivities of VI and RRT-PCR were each 86.3%, while point estimates for specificities were each 99.3%, for an estimated prevalence of virus presence in specimens of 0.4%.
Discussion
Evaluation of the diagnostic performance of assays must take into consideration the context in which they were used. All specimens for these analyses were field specimens collected and pooled from 5 birds during control and eradication efforts of an outbreak of LPAI H7N2. The RRT-PCR was introduced after the peak of the epidemic, by which time the numbers of positive specimens available for inclusion in these analyses were declining. The consequence was a lower number of positive test results during the study period and thus a reduced precision of sensitivity estimates.
Point estimates of sensitivities of tests on turkey specimens were 65.9%, 85.1%, and up to 92.9% for AC-EIA, RRT-PCR, and VI respectively, with corresponding specificities of 99.1%, 98.9%, and greater than 98.6% (Table 3). In chickens the point estimates of sensitivities for AC-EIA, RRT-PCR, and VI were 75.1%, 86.3%, and 86.3% respectively, with corresponding specificities just less than 99.3% for all 3 tests (Table 4). Given the low number of positive specimens available for these analyses in chickens, and to a lesser degree in turkeys, 95% probability intervals for sensitivities tended to be wide, with lower limits for sensitivity of AC-EIA being about 46% and for VI and RRT-PCR about 66%. The probability intervals for specificities were very narrow, especially in chickens, given the large number of negative specimens available for analysis. Test results from the AC-EIA and RRT-PCR also showed very good to excellent agreement, as indicated by Kappa values of 72% in turkeys and 81% in chickens.
Medians for prevalence p, sensitivity se, specificity sp, with 95% probability intervals when relating virus isolation and antigen capture enzyme immunoassay (AC-EIA, panel A) and virus isolation and real-time reverse transcription polymerase chain reaction (RRT-PCR) assay (panel B) performed on 2,216 chicken specimens
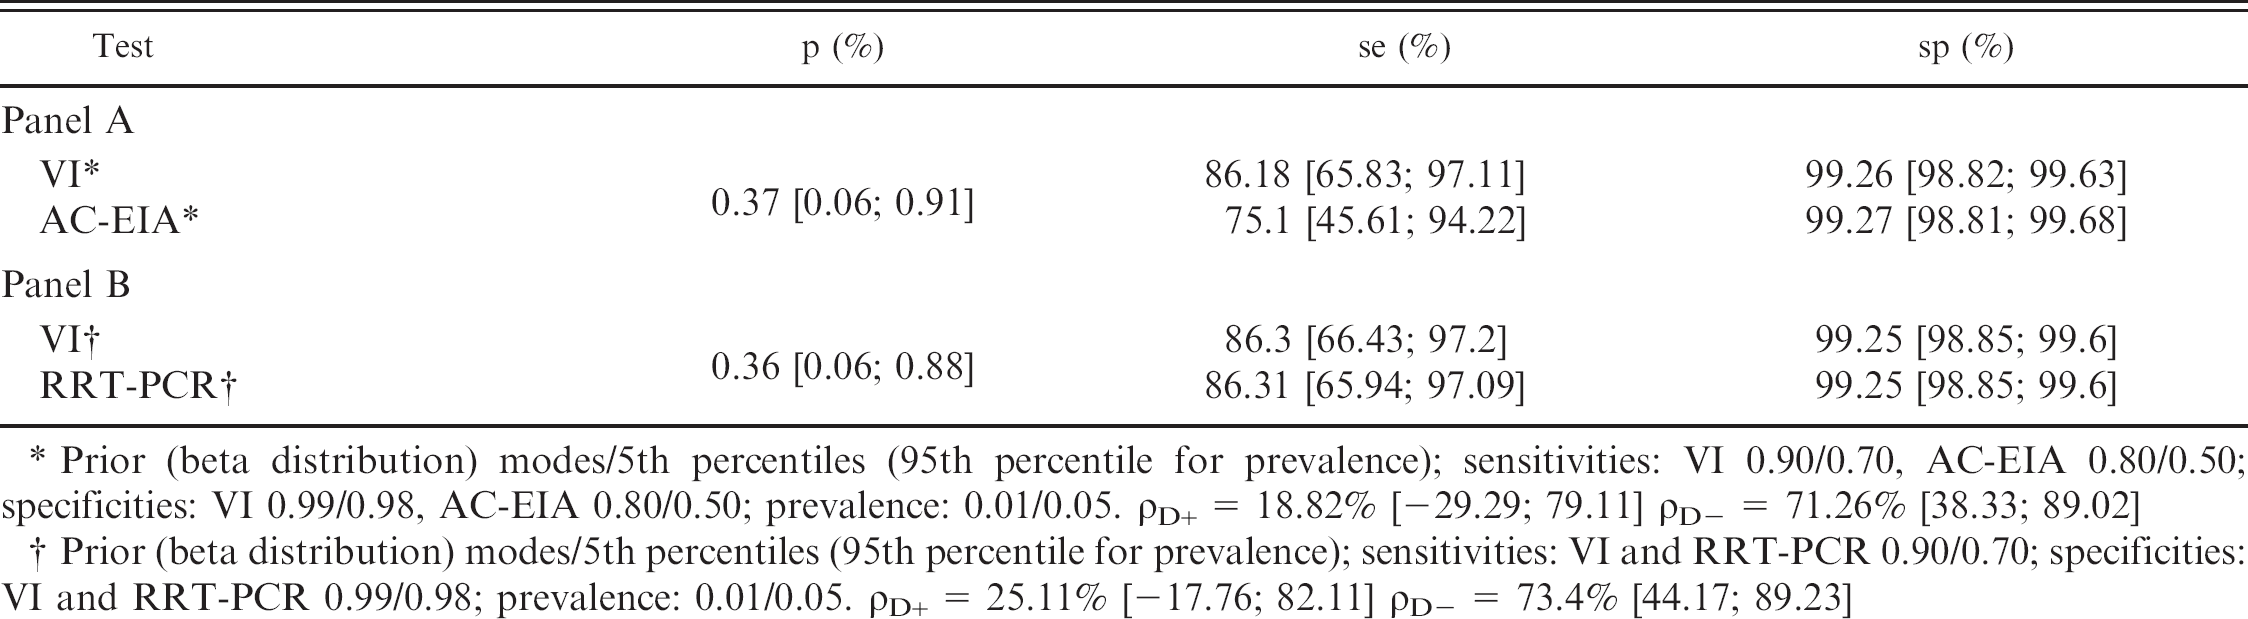
Prior (beta distribution) modes/5th percentiles (95th percentile for prevalence); sensitivities: VI 0.90/0.70, AC-EIA 0.80/0.50; specificities: VI 0.99/0.98, AC-EIA 0.80/0.50; prevalence: 0.01/0.05. ρD+ = 18.82% [-29.29; 79.11] ρD- = 71.26% [38.33; 89.02]
Prior (beta distribution) modes/5th percentiles (95th percentile for prevalence); sensitivities: VI and RRT-PCR 0.90/0.70; specificities: VI and RRT-PCR 0.99/0.98; prevalence: 0.01/0.05. ρD+ = 25.11% [-17.76; 82.11] ρD- = 73.4% [44.17; 89.23]
Tests were considered conditionally dependent in these analyses, 6 given that all 3 tests detect the presence of virus, either live or its antigen or nucleic acid. Inclusion of the value of zero in the probability intervals of the correlation coefficient (ρD+) indicates independence of positive test results, which was not expected but was most likely due to the low number of positive specimens available for these analyses and the resulting very wide probability intervals. Higher values of ρD-, with narrower probability intervals greater than zero, indicated, as expected, conditional dependence of tests (Tables 3, 4).
Bayesian modeling for estimation of diagnostic test characteristics also allowed estimation of proportions of true positives in the sampled population for the considered time frame. Overall, in this outbreak a greater number and proportion of turkey flocks than chicken flocks became infected. 1 Turkeys also have been shown to be experimentally more susceptible than chickens to this LPAI H7N2, 15 which in these analyses is reflected in the estimated proportions of positive specimens: the prevalence of presence of virus in specimens was estimated at between 9 and 10% in turkeys and only about 0.4% in chickens.
Several factors may have affected assay performance, including condition of the birds at the time of specimen collection, condition/preservation of specimens, and time between specimen collection and testing. Although the AC-EIA was generally performed within 4 to 8 hours of specimen collection, the RRT-PCR and VI tests were not set up until after shipment and arrival of specimens at the NVSL in Ames, which added a delay of 24 to 36 hours. Although specimens were kept either refrigerated or on ice from the time they were collected until they were tested, some specimen tubes showed visual evidence of bacterial and/or fungal growth in the unaugmented media. The possible effects of degradation of these specimens on performance of RRT-PCR and VI are unknown, but potential problems with PCR inhibition, RNA degradation, which both could have a depressing effect on sensitivity of the RRT-PCR, or viral inactivation, which would reduce sensitivity of the VI, could have affected test results. It was also noted prior to collection of the specimens included in this study that occasional specimens tested positive on the AC-EIA but could not be confirmed by VI, presence of compatible clinical symptoms, or additional sampling and testing, and those specimens therefore were classified as AC-EIA false positives. Consultation with the manufacturer of the AC-EIA test kits revealed that a large excess of alkaline phosphatase in the specimen, as could happen when moderate to severe autolysis of the tissues of the dead birds being sampled had occurred, could lead to such false-positive results. Subsequent to this discovery, and as instructed by the manufacturer, all specimens that tested positive by AC-EIA were retested using the modified protocol described in the Materials and methods section, which omitted the influenza A monoclonal antibody. Positive test results under this protocol would imply that a high alkaline phosphatase level in the specimens was the cause of the positive results, and those specimens were declared negative on that AC-EIA (data not recorded). This extended protocol was introduced prior to testing of specimens included in these analyses. The AC-EIA test characteristics were calculated here for the extended test protocol, obviously resulting in a higher specificity than the test performed under the nonmodified protocol, which however might have reduced its sensitivity. The performance of the AC-EIA on specimens from chickens during this outbreak mirrored previously reported levels. 4 The assay's performance in turkeys had not previously been reported, and although exhibiting a lower sensitivity in turkey specimens than in chickens, the assay demonstrated the same high specificity in turkey specimens than in chicken specimens.
Although VI was used as a reference test for early evaluation of the RRT-PCR and AC-EIA tests during the outbreak, it is clear that this type of “relative sensitivity,” as presented in Table 2, underestimates the sensitivities of both tests. This may also have been the case in an earlier study, in which the point estimates of relative sensitivity and also relative specificity were even lower. 12 Virus isolation cannot be considered 100% sensitive, and, consequently, some positive test results either by AC-EIA or RRT-PCR of a VI-negative specimen could be correct. At least 2 premises from which specimens were RRT-PCR positive but VI negative were later confirmed as positive by the seroconversion of the flocks on the AGID test; seroconversion, however, could not be used to evaluate most affected premises because flocks that met 2 criteria for being positive were depopulated before birds could seroconvert. We used Bayesian methods 3,5,7,9 with published models and available code 2 for analysis in WinBUGS g to take into account a non-perfect reference test. Bayesian models use prior information based on expert opinion or from earlier evaluations of the tests under investigation, in combination with the new data, to generate posterior test performance and disease prevalence estimates. Although one would expect VI and eventually even RRT-PCR to be 100% specific, contamination or other human errors in specimen handling, which could occur at collection, labeling, receiving, test execution and result entry, or reporting, could lead to a falsely attributed result for any specimen under the real-world field conditions for which the evaluation in this report was performed. These specimen-handling rather than test-related factors could have contributed to the specificity <100% of any of the 3 tests. Imperfect diagnostic sensitivity and specificity under field conditions both have to be addressed in the context of determination of fitness for purpose and when designing and carrying out detection, control, and eradication programs. Imperfection in tests can be compensated for by adjustments of sampling schemes and of response protocols to positive tests. Only a few false-positive test results can be expected, given the high specificity of all 3 tests; however, these must be identified as false positive through clinical and epidemiologic evidence or additional testing to either confirm or reject the positive test result. Testing of multiple specimens from a premises or house will compensate for reduced sensitivities; for example, in the Virginia outbreak, 2 pooled specimens were collected from each house, which augmented the sensitivity of sampling and testing by RRT-PCR for an infected turkey house from 85% for a single infected specimen to 97.7% for 2 specimens from infected birds. Similar sensitivity of sampling of about 96% could only be reached with simultaneously testing 3 infected specimens per premises when testing turkey specimens by AC-EIA. These calculated sensitivities need further adjustment for the prevalence of infection on infected premises at the time of specimen collection to determine surveillance sensitivity.
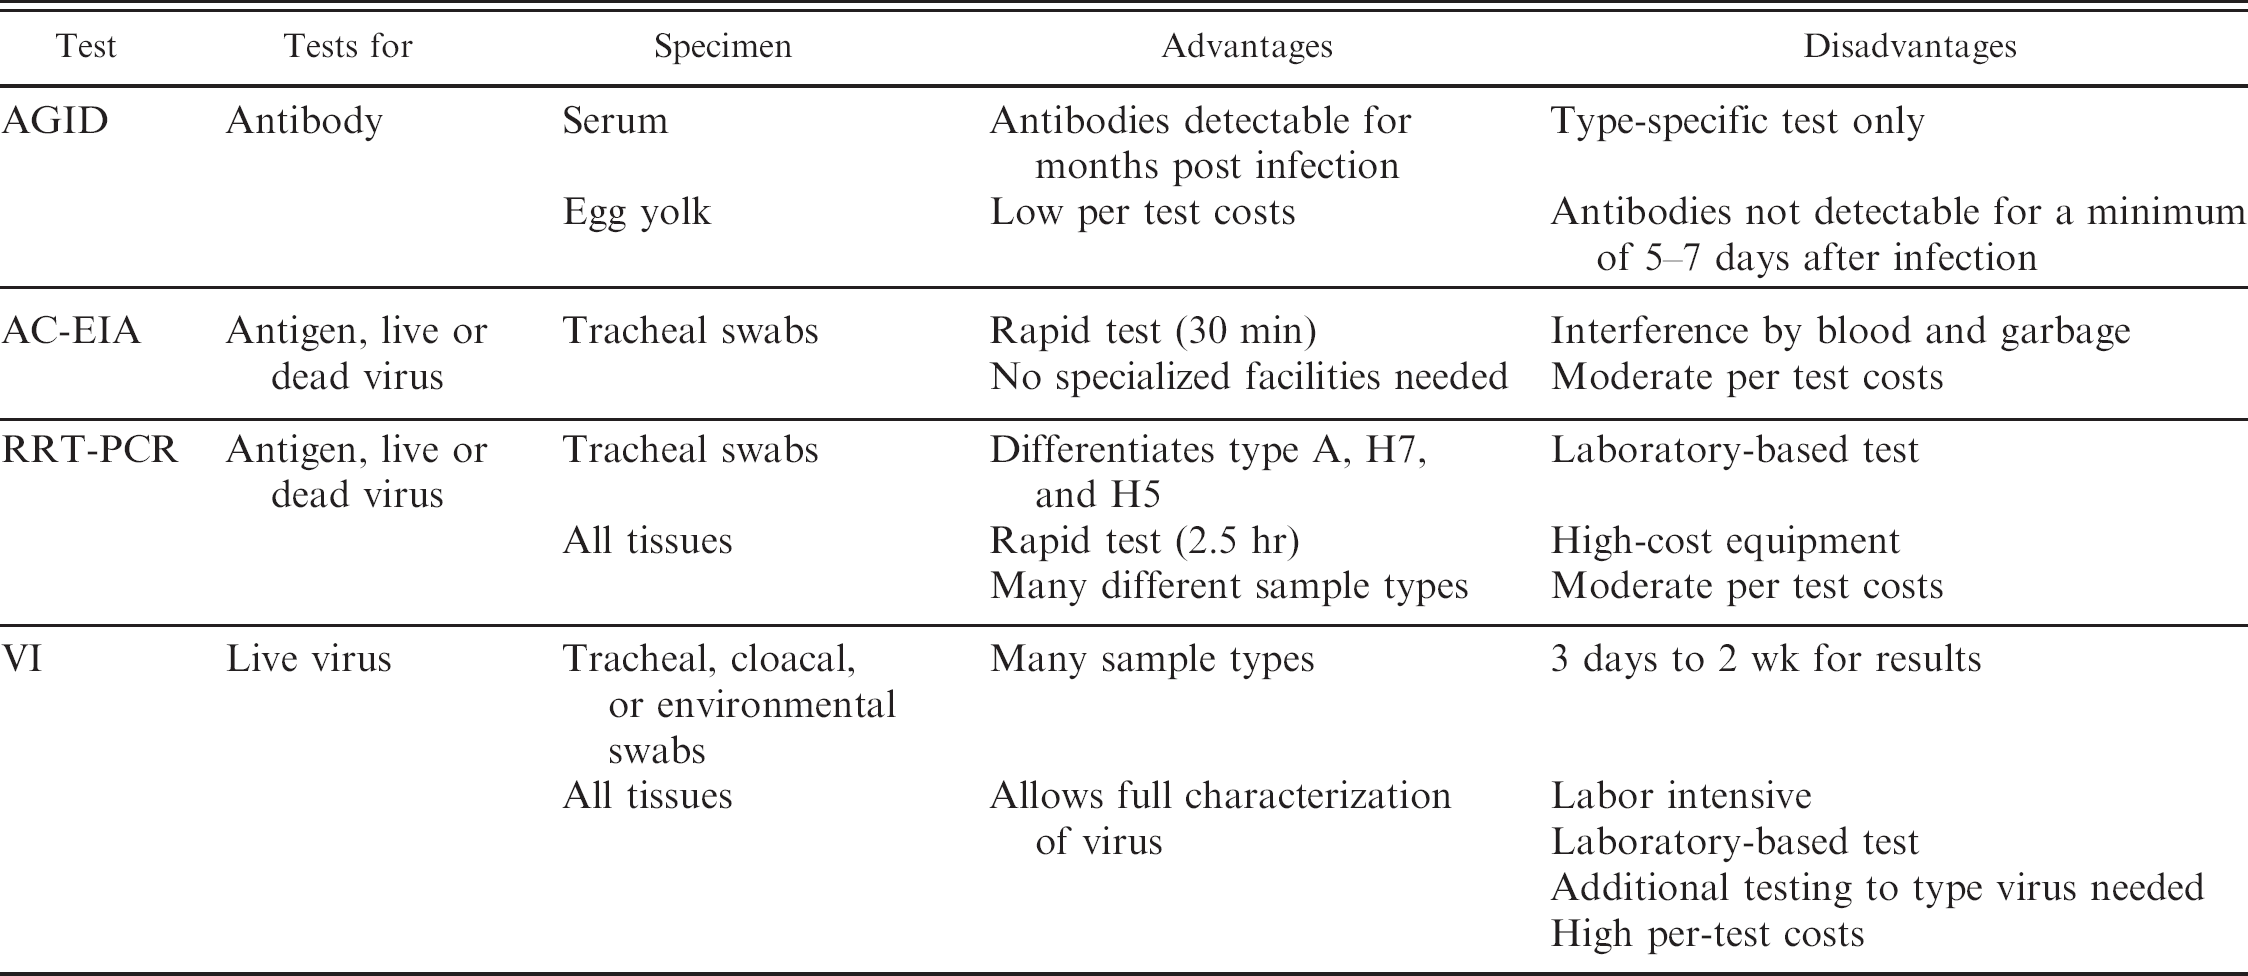
Apart from the focus on the diagnostic performance of the tests, technical and practical aspects must be taken into account when evaluating if a test fits the intended purpose. Ease of use, types of testable specimens, turnaround times, and costs (Table 5) all are essential when considering the deployment of a diagnostic test in surveillance, disease control, and eradication programs. Costs of the AC-EIA were about $20 per test for purchasing the kit, while costs of consumables and reagents for the RRT-PCR are estimated to be $8 per negative specimen and $12 for matrix gene test – positive specimens, which require additional testing for the H7 subtype.
Rapidly available positive results of the easy-to-use AC-EIA in flocks with clinical symptoms that later also tested positive on either or both RRT-PCR or VI made the AC-EIA very useful for making rapid, informed decisions that were essential for gaining control of the outbreak. Partway through the outbreak, a preliminary assessment of the performance of RRT-PCR compared with VI conducted by the NVSL resulted in the adoption of RRT-PCR as the primary confirmatory test for all tracheal swab specimens, with VI only being conducted on RRT-PCR–positive specimens and on environmental samples. The analyses presented here fully support that decision made during a disease outbreak situation, because the performance of the RRT-PCR calculated in this report was virtually identical to that of the VI. The rapid turnaround time of RRT-PCR (approximately 3 to 4 hours of testing time) compared with VI (usually 2 to 3 days after set up for a positive specimen and at least 5 days for determination of a negative result on first passage) was a very important feature in the management of the outbreak. Establishing RRT-PCR in the VDACS laboratory, as done towards the end of the outbreak, thereby cutting out the 24 to 36 hours of specimen transport time, provided an ideal combination of screening and confirmatory testing that yielded the fast and accurate test data needed to bring about a successful conclusion to this LPAI H7N2 outbreak.
Nondiagnostic characteristics of agar gel immunodiffusion (AGID) test, antigen capture immunoassay (AC-EIA), realtime reverse transcription polymerase chain reaction (RRT-PCR), and virus isolation (VI) for detection of infection with avian influenza virus
The World Organization for Animal Health (OIE) has recently published revised guidelines for the validation of diagnostic tests. 19 Procedures for validation, especially of serologic tests, have been described and are established for serologic tests in reference to a “gold standard,” 8,17 but the process of validation of molecular diagnostic tests is not as well defined. 18,19 Workgroups currently are in the process of defining guidelines for the OIE for validation of diagnostic tests in the absence of a gold standard, including the adoption 19 of the statistical processes 2,9 used in this report.
Ideally, only tests with appropriately determined diagnostic sensitivity and specificity for the specimen type and population in which they are applied would be used; however, the exigencies of an outbreak of a disease with a high economic and social impact, such as H5 or H7 subtype AI, may require a rapid and preliminary assessment of the suitability of a new and untried assay, as was the case in this outbreak. The new RRT-PCR 11,12 was introduced in the Virginia AI outbreak prior to characterization of its performance, and the concurrent deployment of various diagnostic tests and sampling strategies was essential for the rapid control of this outbreak. The results of the RRT-PCR's diagnostic performance evaluation, yielding point estimates of >85% sensitivity and ∼99% specificity, the relatively low cost of the test, and its short turnaround time justify the deployment of the RRT-PCR in the 2002 VA H7N2
LPAI outbreak. This test, in conjunction with a well-defined sampling strategy, could be considered the sole test for surveillance and control of an H7 subtype AI outbreak in turkeys and chickens.
Footnotes
a.
Directigen® Flu A, Becton Dickinson Microbiological Systems, Cockeysville, MD.
b.
Qiagen, Valencia, CA.
c.
Idaho Technologies, Salt Lake City, UT.
d.
Roche Diagnostics, Basel, Switzerland.
e.
Cepheid, Sunnyvale, CA.
f.
SAS 9.1.3, SAS Institute, Carry, NC.
g.
WinBUGS code, Version 1.4, Imperial College and Medical Research Council, United Kingdom.