
Abstract
The Italian National Reference Center for equine infectious anemia (CRAIE; Rome, Italy) developed and validated a monoclonal, recombinant p26–based competitive enzyme-linked immunosorbent assay (cELISA) for the detection of EIA virus antibodies employing the 2010 criteria of the World Organization for Animal Health (OIE). The following parameters were evaluated: cutoff values, repeatability, reproducibility, concordance, analytical sensitivity (Se), absolute analytical specificity (Sp), and diagnostic Se and Sp. Positive and negative predictive values were also defined in relation to the estimated prevalence. When the cELISA was used as a screening test for 96,468 samples in the Italian EIA surveillance program, 17% more EIA cases were detected than by the agar gel immunodiffusion test, and the apparent diagnostic Sp estimated from these samples was 99.8%, which was more than the diagnostic Sp (80.2%) estimated from validation. The high Se and Sp of the cELISA confirm its fit for purpose as a screening test.
Keywords
Introduction
Equine infectious anemia (EIA) is a blood-borne disease of equids with a worldwide distribution caused by Equine infectious anemia virus (EIAV; family Retroviridae, subfamily Orthoretrovirinae, genus Lentivirus). Diagnosis of EIA is primarily based on the detection of EIAV antibodies that are usually produced from ~3 weeks to 3 months postinfection. 5 The virologic detection of EIAV is generally problematic 9 as in vitro viral isolation can be unsuccessful, as also is the use of molecular diagnostic methods because of the genetic heterogeneity of the virus and the variation of the viral RNA–proviral DNA loads during infection. 14 Hence, serologic methods are used for the detection of suspect cases and screening in surveillance programs. 12 The serologic methods, recommended by the World Organization for Animal Health (OIE), are the agar gel immunodiffusion (AGID) test, prescribed for international animal movement, and immunoenzymatic assays to be employed as screening tests. However, the AGID test has low sensitivity and output capacity. 10 The Italian National Reference Center for EIA (CRAIE; Rome Italy) developed and validated a monoclonal antibody (mAb)-based semiliquid phase competitive enzyme-linked immunosorbent assay (cELISA), using the major core protein (p26) as a recombinant antigen expressed in Escherichia coli. 13 The aim was to employ the method as a screening test for the detection of antibodies against EIAV in horse sera examined during surveillance programs.
The present article describes the test validation and the results obtained using 8 different panels of equine sera, containing reference and field samples. The OIE validation procedure, current at the time that the test was validated, 24 was chosen for its completeness in evaluating the performance of a test method. Its use in a 3-tier system improves the efficacy of surveillance programs for EIA. 18 This testing pathway uses different methods in series with an initial screening by ELISA (tier 1), with positive and equivocal samples confirmed by AGID (tier 2), and the use of immunoblot (tier 3) for ELISA-positive, AGID-negative samples.
Materials and methods
Competitive ELISA
Standardization and optimization
The cELISA validated in our study is a semiliquid phase competitive immunoassay using recombinant p26 antigen, expressed in E. coli, a mAb anti-p26 as catcher, and another mAb anti-p26, different from the previous, conjugated with horseradish peroxidase, acting as tracer, 18 a modification of a previous cELISA using the whole virus, cell grown, as an antigen (Cordioli P, et al. World Association Veterinary Laboratory Diagnosticians Proceedings of VI International Symposium, 1992 June 9–12, Lyon, France).
The antigen used in this ELISA is a recombinant protein of the major core protein (p26) of EIAV that was produced as follows: the sequence of the reference strain Wyoming of EIAV was used for cloning and expression of the p26 (GenBank accessions M16575, K03334, M11337, and M14855). The p26 coding sequence was amplified from a 1,547-bp BamHI-XbaI fragment, cloned into pGEM-3Zf (+/–).
a
Primers used to amplify the p26 sequence were modified at their 5′-ends by introducing restriction sites for subsequent cloning. Underlined sequences correspond to restriction sites for NcoI (p26U) and XbaI (p26L). The primers used are the following and their positions refer to the genome of the Wyoming strain (GenBank accession M16575): upper primer (p26U): A
The PCR product was digested with restriction enzymes Nco1 and XbaI and cloned into the expression vector following the manufacturer’s instructions. c Proteins expressed by the vector were fused at their N-terminal portion to a modified version of the E. coli thioredoxin (TrxA, molecular weight of 12 kDa) under the control of the trc inducible promoter. The resulting construct (pMTR1) was used to transform E. coli TOP10 strain, d and transformed colonies were grown on a selective medium containing ampicillin. The transformed colonies were screened for the presence of pMTR1 by restriction enzyme analysis of plasmid DNA, purified with a commercial kit e according to manufacturer’s instructions. The identity and sequence of the cloned insert were checked by sequencing analysis. f The TOP10 (pMTR1) clone was then inoculated in lysogeny broth g containing ampicillin, and the expression of the fusion protein, cloned under the control of the trc promoter, was induced by the addition of 1 mM isopropyl-b-thiogalactopyranoside. g Culture suspension was centrifuged for 10 min at 2,000 × g at 4°C, and the pellet was resuspended in 20 mM Tris-HCl (pH 8 ± 0.2), g 2.5 mM ethylenediamine tetra-acetic acid, g and 5 mM imidazole, g as indicated by the expression system kit. d After 3 sonication steps, 20 sec each, the suspension was subjected to 3 freeze–thaw cycles at −80°C and +37°C. Bacterial lysate was then centrifuged at 12,000 × g h for 10 min at 4°C. Both supernatant and pellet were monitored by immunoblot11,12 for the presence of the p26 recombinant protein.
The mAbs employed for the development of the cELISA were supplied by the Istituto Zooprofilattico Sperimentale della Lombardia e dell’Emilia Romagna (Brescia, Italy), and a brief description of their production and characterization is as follows: mAbs were produced by intramuscular inoculation of BALB/c mice g with the EIAV Wyoming strain (ATCC VR-778) and Freund adjuvant, g followed by 2 inoculations without adjuvant, 1 of which was intraperitoneal. Three days after the last inoculation, spleen cells were collected and hybridized with murine myeloma NS0.g,15 Screening of hybridomas was performed by ELISA and confirmed by immunoblot.11,12 Positive hybridomas were cloned by limiting dilution on a feeder layer of normal mouse spleen cells and injected intraperitoneally in pristane-sensitized mice for production of ascitic fluid; mAbs were purified as previously described. 8
Selection of mAbs was performed by comparing their reciprocal competition for antigen-binding epitopes using ELISA, with p26 as antigen. The mAb chosen as tracer was conjugated with horseradish peroxidase. 21 Working dilutions of mAbs and antigen were set by a checkerboard titration using panel 2 (USDA reference sera, see Table 1), and conditions of temperature and incubation intervals employed were those for other methods developed by the same laboratory. 2
Panels employed for the validation of competitive enzyme-linked immunosorbent assay for Equine infectious anemia virus on horse sera.
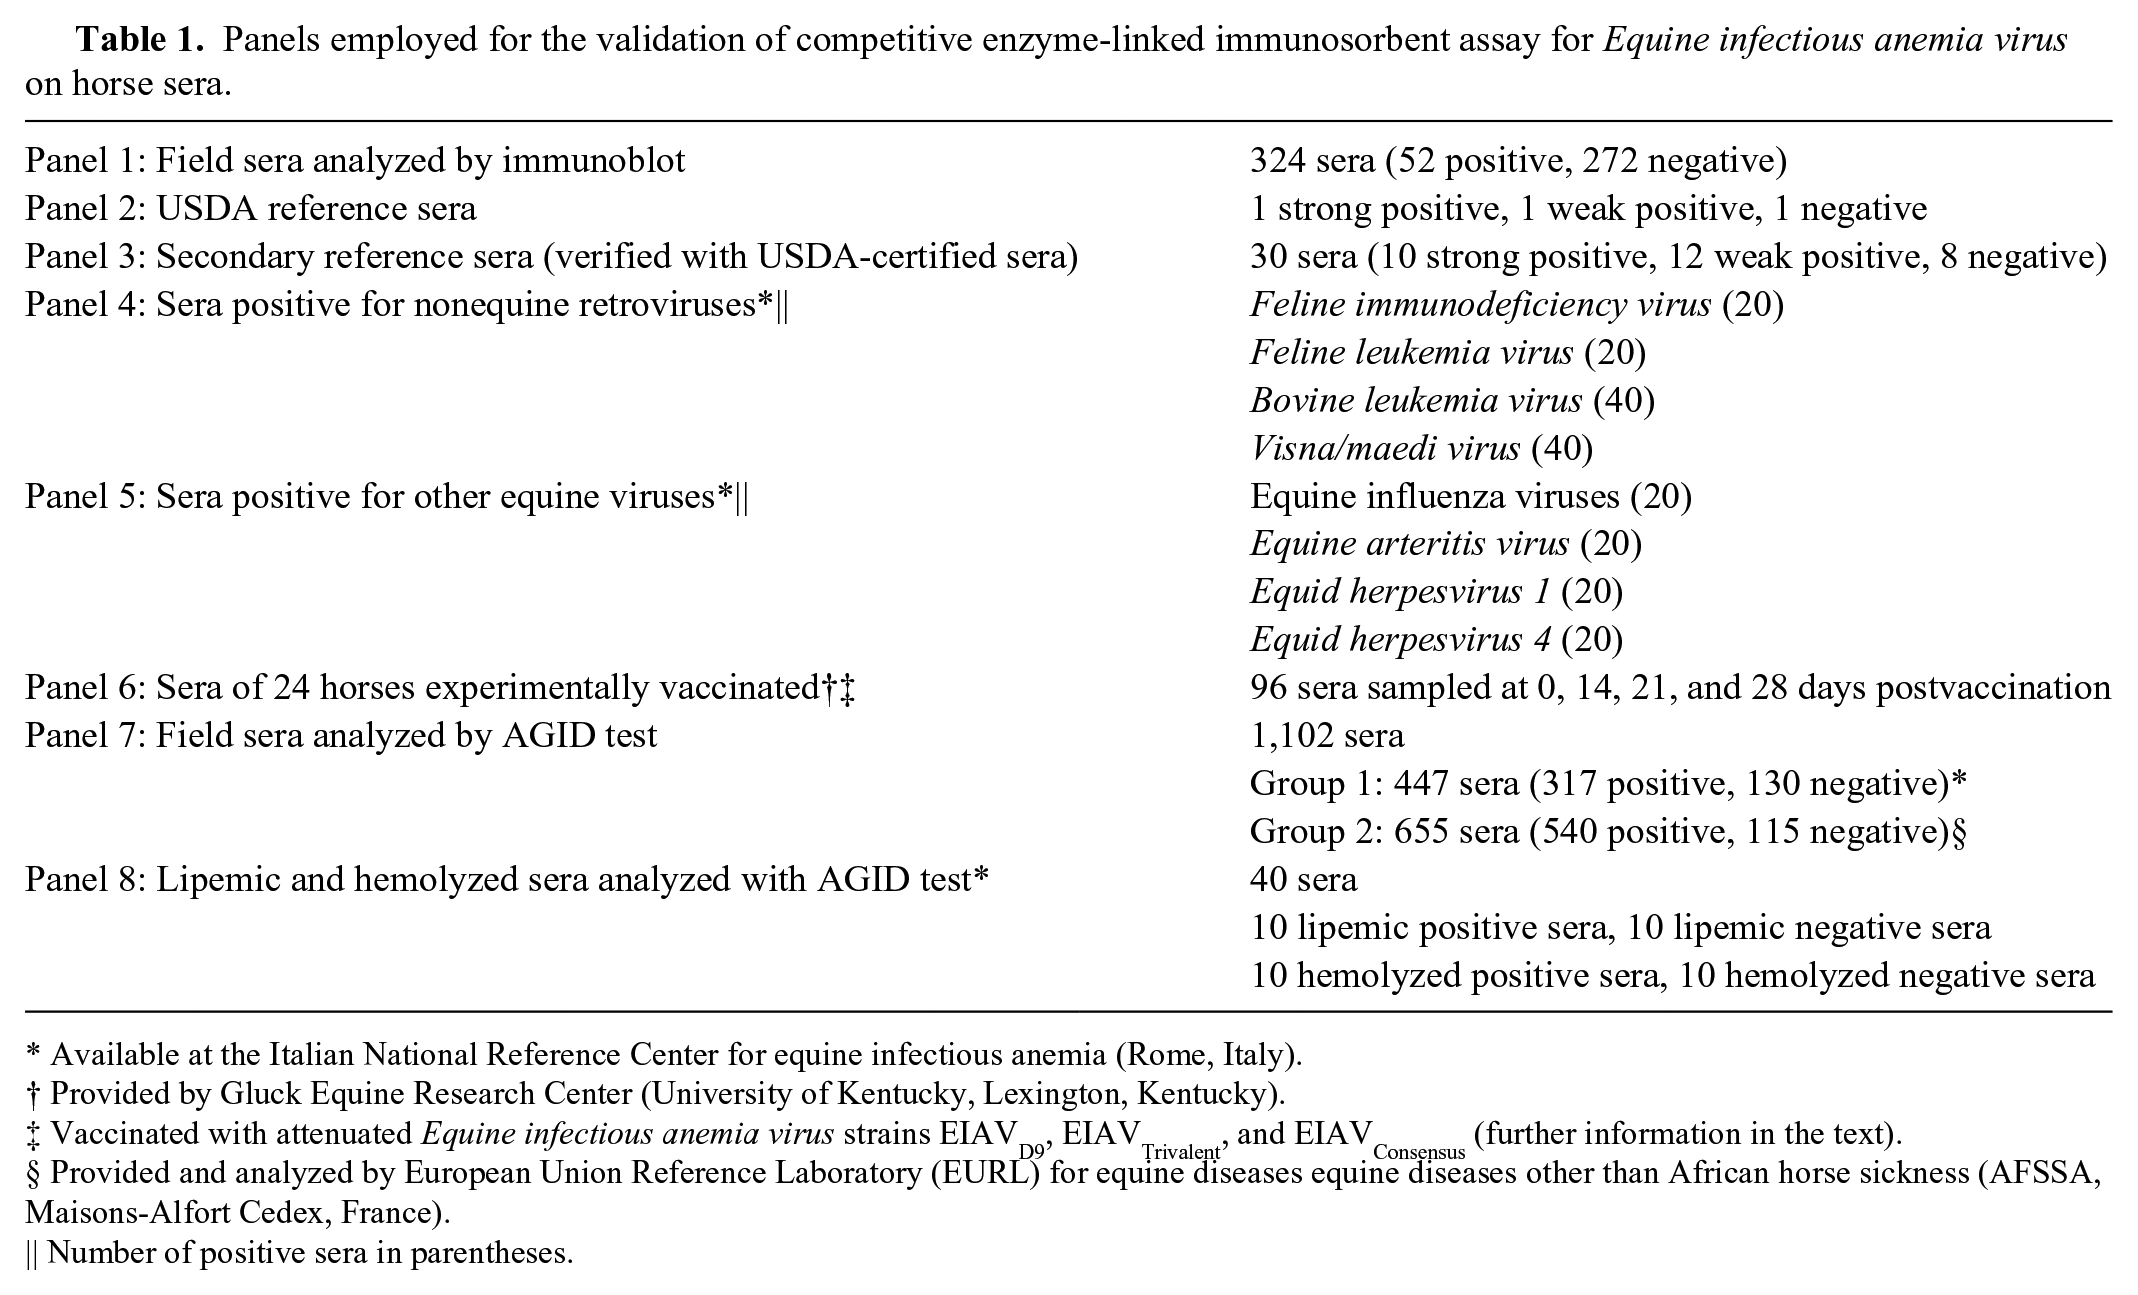
Available at the Italian National Reference Center for equine infectious anemia (Rome, Italy).
Provided by Gluck Equine Research Center (University of Kentucky, Lexington, Kentucky).
Vaccinated with attenuated Equine infectious anemia virus strains EIAVD9, EIAVTrivalent, and EIAVConsensus (further information in the text).
Provided and analyzed by European Union Reference Laboratory (EURL) for equine diseases equine diseases other than African horse sickness (AFSSA, Maisons-Alfort Cedex, France).
Number of positive sera in parentheses.
Assay procedure
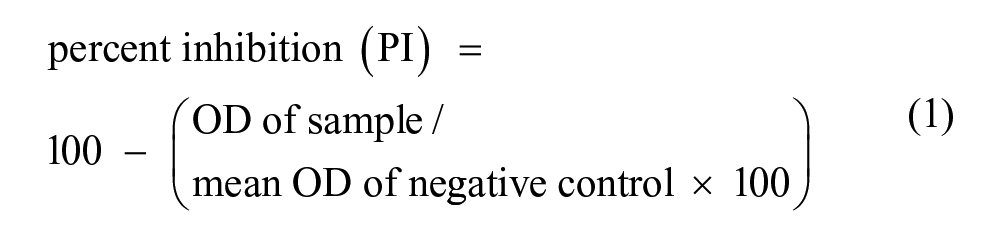
The cELISA is described as follows: microplates i were adsorbed with 50 µL/well of a fixed dilution of the mAb catcher in carbonate bicarbonate buffer (pH 9.2 ± 0.2) and incubated for 18–24 hr at 4 ± 1°C. The serum sample was diluted 1:3 on an inert microplate by adding 10 μL in 20 µL of a sample dilution buffer (phosphate buffered saline [PBS], pH 7.2 ± 0.2, containing Tween 20 j [0.05%], yeast extract k [1%], and mouse serum g [1%]). The latter 2 reagents were added to the PBS to reduce nonspecific binding by saturating sites that were still free after adsorption. Internal controls were included in each plate and are represented by the antigen, the positive and negative control sera, and the blank reaction (all of which were examined as double repetitions). A volume of 30 µL of antigen, diluted in the dilution buffer (PBS, pH 7.2 ± 0.2, containing Tween 20 [0.05%] and yeast extract [1%]) was added to all of the diluted samples and controls, except for the blank reaction control, in which 30 µL of the dilution buffer was added. At the end of a 75 ± 5 min incubation at 37 ± 1°C, 50 µL of each sample or control-antigen mixture were transferred onto the previously adsorbed microplate. A volume of 25 µL/well of the conjugated tracer mAb, diluted in dilution buffer, was added, and the plates were re-incubated at the previously described conditions. At the end of this step, after a cycle of 3 washings with PBS (pH 7.2 ± 0.2, containing Tween 20 [0.05%; washing solution]), 50 µL/well of orthophenylenediamine g substrate was added, and after 10 ± 2 min, the reaction was blocked by adding 50 µL/well of 1 M sulfuric acid. l The optical density (OD) of the samples was read at 492 nm, using a microplate spectrophotometer. m Reagents employed were laboratory grade, and water was obtained by filtration n ; furthermore, all instruments were calibrated and maintained within the Quality Assurance System ISO/IEC 17025:2005. The results were interpreted using the following formula:
For a run to be valid, the following criteria must be fulfilled: mean OD of antigen control wells ≥1.0, difference between mean OD of negative and positive controls ≥0.8, mean OD of blank wells <0.3.
Agar gel immunodiffusion test
The AGID test employed is described by the OIE Manual of Diagnostic Tests and Vaccines for Terrestrial Animals, using the same recombinant p26 antigen as for the cELISA. The internal control set is composed of positive, weak-positive, and negative sera, verified using the certified reference sera provided by the USDA, an OIE Reference Center for EIA. The internal control set was also confirmed for their reactivity by the immunoblot described below.
Immunoblot
The preparation of membranes o and the internal controlo employed for the immunoblot and the immunoblot procedure used are those as previously described,11,12 with the following modifications: individual strips of the membrane were cut and used for each serum sample tested at a dilution of 1:20, in a final volume of 3 mL. Rabbit anti-horse immunoglobulin G conjugate f was used at the appropriate working dilution and in the same final volume reported for the sample. Samples are defined as positive when they present an equal or more intensive staining than that of the internal positive control, relative to the band of p26, and for at least 1 band of the 2 envelope proteins (gp45 and gp90) of EIAV.
Panels of sera employed for the validation of the method
Eight panels of sera were employed in the study (Table 1). The panels will be referred by number in the rest of the paper, with a brief description within brackets.
Where required, except for panels 2 (USDA reference sera) and 6 (sera of vaccinated horses), the number of sera composing the panels fulfilled the minimum required for a valid statistical analysis. The minimum numbers of samples for estimating the diagnostic sensitivity (DSe) and diagnostic specificity (DSp) were calculated respectively with the following formulae:

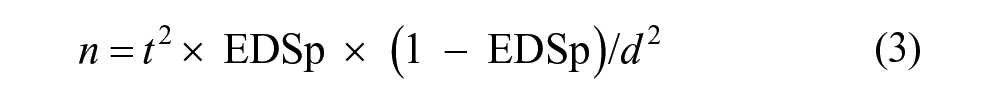
where t is the value of the t-distribution for the chosen confidence level (CL), EDSe is the expected diagnostic sensitivity, EDSp is the expected diagnostic specificity, and d is the standard error (SE); all values are expressed as a proportion.
For panels 1 (sera analyzed by immunoblot) and 7 (sera analyzed by AGID), the expected EDSe was defined at 99% and EDSp at 80%, with a CL of 95% and a SE of 5%. Panel 6 consisted of sera from 3 groups of 8 horses each, vaccinated with 3 EIAV attenuated strains (D9, Trivalent, or Consensus), and sampled at 0, 14, 21, and 28 days postvaccination (dpv). The characteristics of the D9 strain are described in the literature 6 ; the Trivalent strain is a genetically engineered EIAV that includes the UK strain and 2 of its clones, having a 6% and 13% variation relative to the amino acid content of the surface unit glycoprotein (SU-gp90). The Consensus strain includes several EIAV strains showing diversity of the SU protein (Issel CJ, personal communication, 2014).
Validation criteria
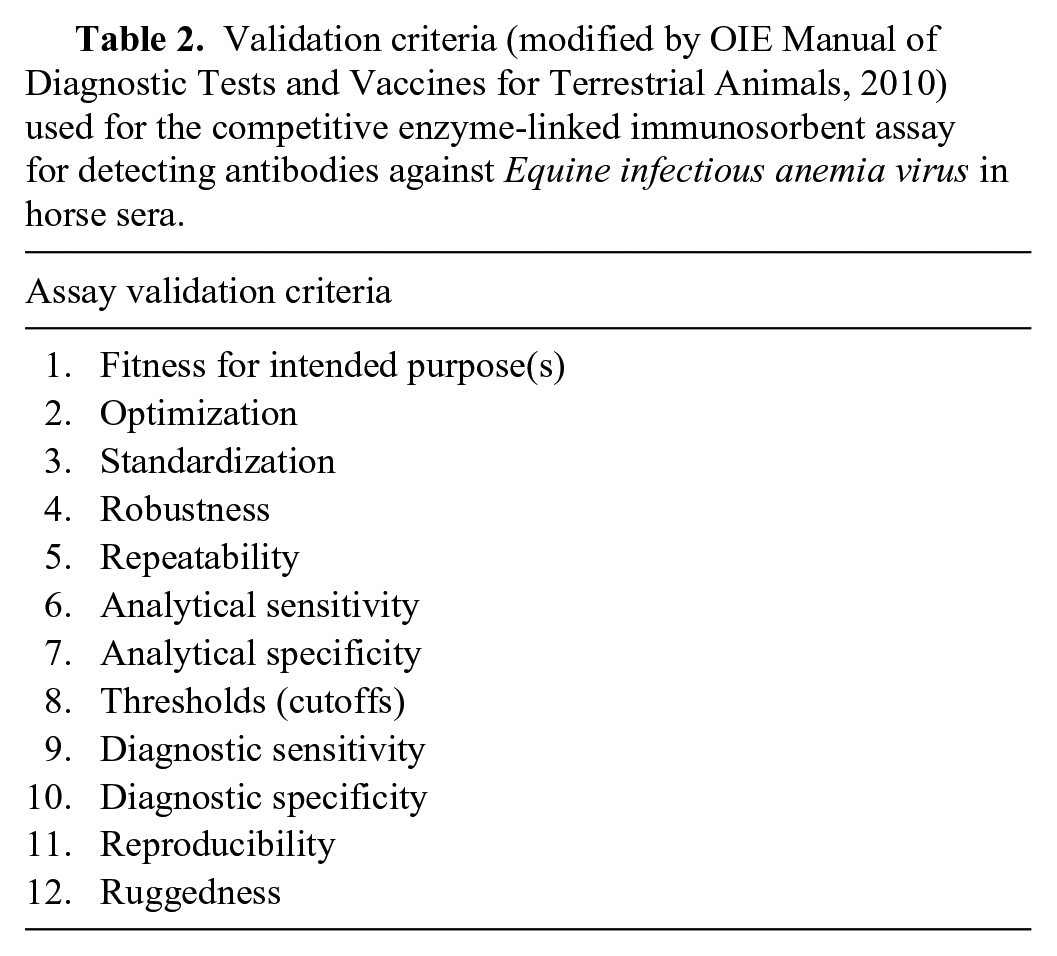
Validation parameters evaluated, as proposed by OIE 24 (Table 2)
Determination of cutoff values
The intended use of the cELISA was as a screening test in surveillance programs for EIA, requiring maximal sensitivity in order to detect the highest probable number of cases. A possible reduction of specificity was considered acceptable, as the test was to be used in the aforementioned 3-tier system that would use other assays, namely AGID and immunoblot, which would compensate for the low specificity. 13
Validation criteria (modified by OIE Manual of Diagnostic Tests and Vaccines for Terrestrial Animals, 2010) used for the competitive enzyme-linked immunosorbent assay for detecting antibodies against Equine infectious anemia virus in horse sera.
Receiver operating characteristic (ROC) curve analysis was employed for the determination of the cutoff values using the percent inhibition (PI) results of panel 1 (sera analyzed by immunoblot), and the statistical analysis was performed using commercial software. p For ROC curve analysis, the immunoblot was considered the gold standard, as the method is more sensitive and specific than the AGID test, 14 even if, in Italy, the latter is the official confirmatory test. The repeatability, reproducibility, analytical and diagnostic performances, DSe and DSp, and positive and negative predictive values (PPV, NPV) were calculated using the cutoff values defined by this analysis.
Repeatability
Repeatability estimates the intralaboratory variation that affects the precision of the assay. The repeatability was evaluated by analyzing the standard deviation (SD) of PI of 30 replicates of the sera of panel 2 (USDA reference sera), obtained from 7 independent runs carried out by 7 operators, on alternate days. As the panel is categorized by AGID, in ELISA, the weak positive serum had a high PI and therefore was diluted to obtain a mean PI defined as equivocal. The PI was used to normalize the OD of the samples allowing their comparison between different runs.
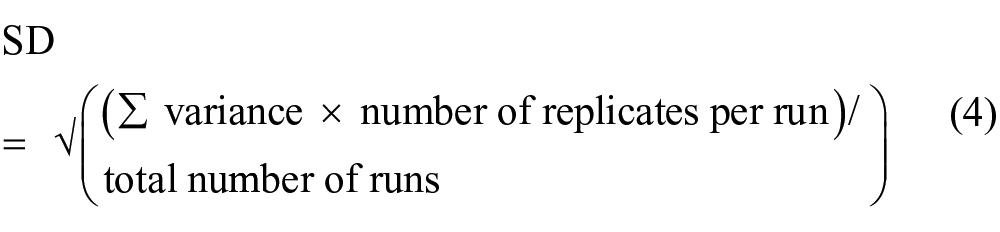
For each level of reactivity, SD and coefficient of variation (CV) were calculated (intra-run variation). Considering all runs (inter-run variation), SD for repeatability for each level of reactivity was calculated using the following formula (CVs were also calculated):
Reproducibility
Reproducibility was evaluated because of the dual nature of the cELISA result: quantitative where the result is expressed as PI, and qualitative where the result is expressed categorically as positive, negative, or equivocal. For reproducibility, panel 3 (secondary reference sera) was employed in an interlaboratory trial in which 9 of the Italian Official Laboratory Networks participated, providing them with sets of panels in which the samples were blinded.
Qualitative reproducibility, analyzed with the same parameters used for repeatability, was estimated by evaluating the concordance for each level of reactivity and each laboratory (intralaboratory variation) and the total concordance between all laboratories (interlaboratory variation). Concordance was calculated as the number of correct results on the total number of results for each level. Once optimization of the method is completed, robustness and ruggedness of an assay can be evaluated by the results obtained for repeatability and reproducibility.
Analytical specificity
Analytical specificity defines how the test distinguishes between the target analyte and other components present in the matrix using the 3 aspects of selectivity, exclusivity, and inclusivity.
Selectivity is the capability of detecting the target analyte, even in the presence of interfering substances, such as matrix components and degraded products. Thirty repetitions of the sera of panel 2 (USDA reference sera) were tested with the defined procedure, as well as using water instead of the dilution buffer and wash solution. The OD results were compared using the Student t-test, with a CL of 95%. Moreover, panel 8 (lipemic and hemolyzed sera) was analyzed to verify concordance of results and evaluate possible interferences with the ELISA.
Exclusivity is the ability of the assay to detect the target analyte, excluding all other cross-reactive biological substances present in the sample. Although the OIE Manual considers this characteristic as an essential feature for a confirmatory test, it was still evaluated for the present test, by examining the sera of panel 4 (sera positive for nonequine retroviruses), in 30 replicates.
Furthermore, although there is no evidence of cross-reactivity between EIAV and other equine viruses, panel 5, composed of sera positive for the most common equine viral diseases, 19 was analyzed to confirm this data. The antigenic expression of p26 is strongly conserved, 5 thus inclusivity, the ability of the assay to recognize various serotypes of the same biological entity, was assessed analyzing panel 7, which includes AGID-confirmed positive sera, belonging to different regions of Italy and France, collected between 1971 and 2011.
Analytical sensitivity
Limit of detection (LOD) was indirectly determined by comparing it with the LOD of the AGID test. Two-fold serial dilutions (1:2–1:1,024) of the positive serum of panel 2 (USDA reference sera) were diluted in the negative serum of the same panel and analyzed by both assays in 7 runs. In addition, to also evaluate how much earlier the cELISA detects antibody production against EIAV, when compared with the AGID test, panel 6 (sera of vaccinated horses) was examined in parallel using both tests.
Diagnostic sensitivity and specificity
The evaluation of the diagnostic performance was conducted using as the gold standard the confirmatory test the AGID, whereas the immunoblot was employed only in the case of discordant results. For the evaluation of these parameters, panel 7 was analyzed by cELISA and AGID. DSe, DSp, and predictive values (negative and positive) were calculated as described in the literature. 20
Results
Standardization and optimization
Methods of cloning and expression of p26 proved to be adequate, as both supernatant and pellet gave the expected reactivity in the immunoblot. The expressed fusion protein was detected in the supernatant of the bacterial lysate and had the expected molecular weight of ~38 kDa.
On the basis of their performance in ELISA, 2 mAbs were employed to develop the assay, 1 as catcher and 1 as tracer, and dilution of mAbs and antigen was set using panel 2 (USDA reference sera) by checkerboard titration to correctly identify the 3 levels of reactivity. Conditions of temperature and incubation periods were confirmed as those defined for similar ELISAs already developed in-house.
Determination of cutoff values
Although the minimum number of sera for the ROC curve analysis was estimated as 15 positive and 245 negative by immunoblot, the effective numbers examined are those reported for panel 1 in Table 1. The ROC curve analysis had an area under the curve (AUC) of 0.99 (CL: 95%, p < 0.001; Fig. 1). The cutoff value of PI corresponding to the highest sensitivity (96.2%) and specificity (97.8%) values was 90.65%; the highest PI without false-negative results was 57.32% with a sensitivity of 100% and a specificity of 82% (Fig. 2). Considering the purpose of the cELISA, and that the PI of the serum of one of the vaccinated animals at 21 dpv was 54.4%, a cutoff value of 50% PI was established for convenience of calculation of the formula employed. In this case, sensitivity was 100% (CI: 91.6–100%) and specificity was 73.2% (CI: 67.6–78.1%). A second cutoff value of PI was introduced at 30%, creating a range within which samples were defined as equivocal. This was established on the basis of the PI of samples of 5 EIAV-infected animals, as confirmed by PCR and immunoblot,13,18 which was 31–47% in various runs. At 30% of PI, sensitivity was still 100% (CI: 91.6–100%) and specificity was 44.12% (CI: 38.3–50.1%). On the basis of these criteria, a sample is defined as negative if the PI is <30%, positive if >50%, and equivocal if between 30% and 50%.
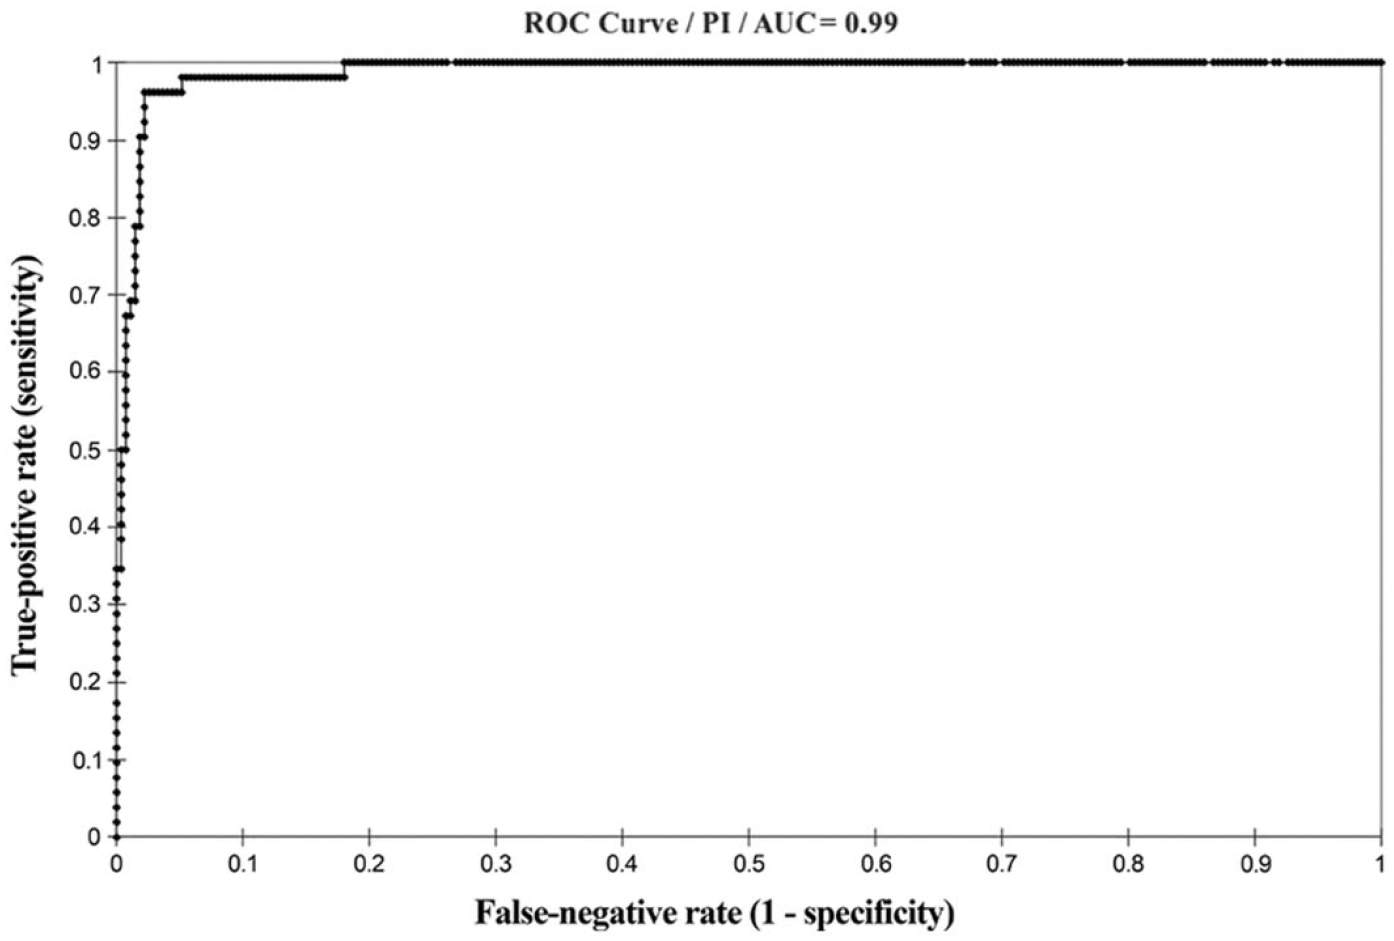
Receiver operating characteristic (ROC) curve based on percent inhibition (PI) result for panel 1 composed of 324 horse sera (52 positive and 272 negative), employed to set the cutoff values for the competitive enzyme-linked immunosorbent assay for serologic detection of Equine infectious anemia virus. AUC = area under the curve.
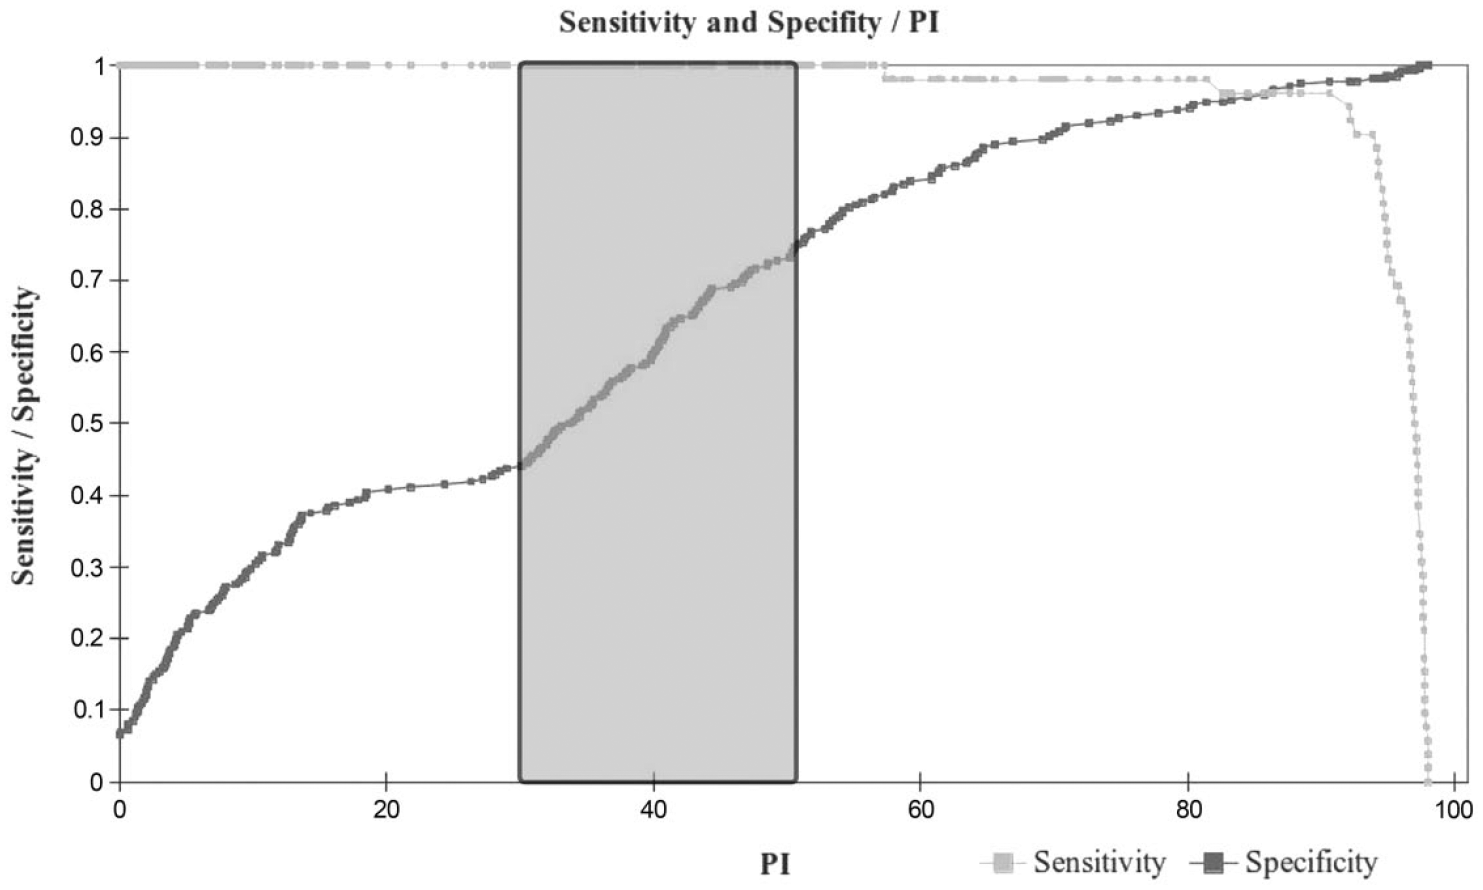
Values of sensitivity and specificity for the competitive enzyme-linked immunosorbent assay for serologic detection of Equine infectious anemia virus at the change of the percent inhibition (PI), on results for panel 1, composed of 324 horse sera (52 positive and 272 negative). Gray zone represents the range of 30–50% PI; sample values within this range are defined as equivocal.
Repeatability and reproducibility
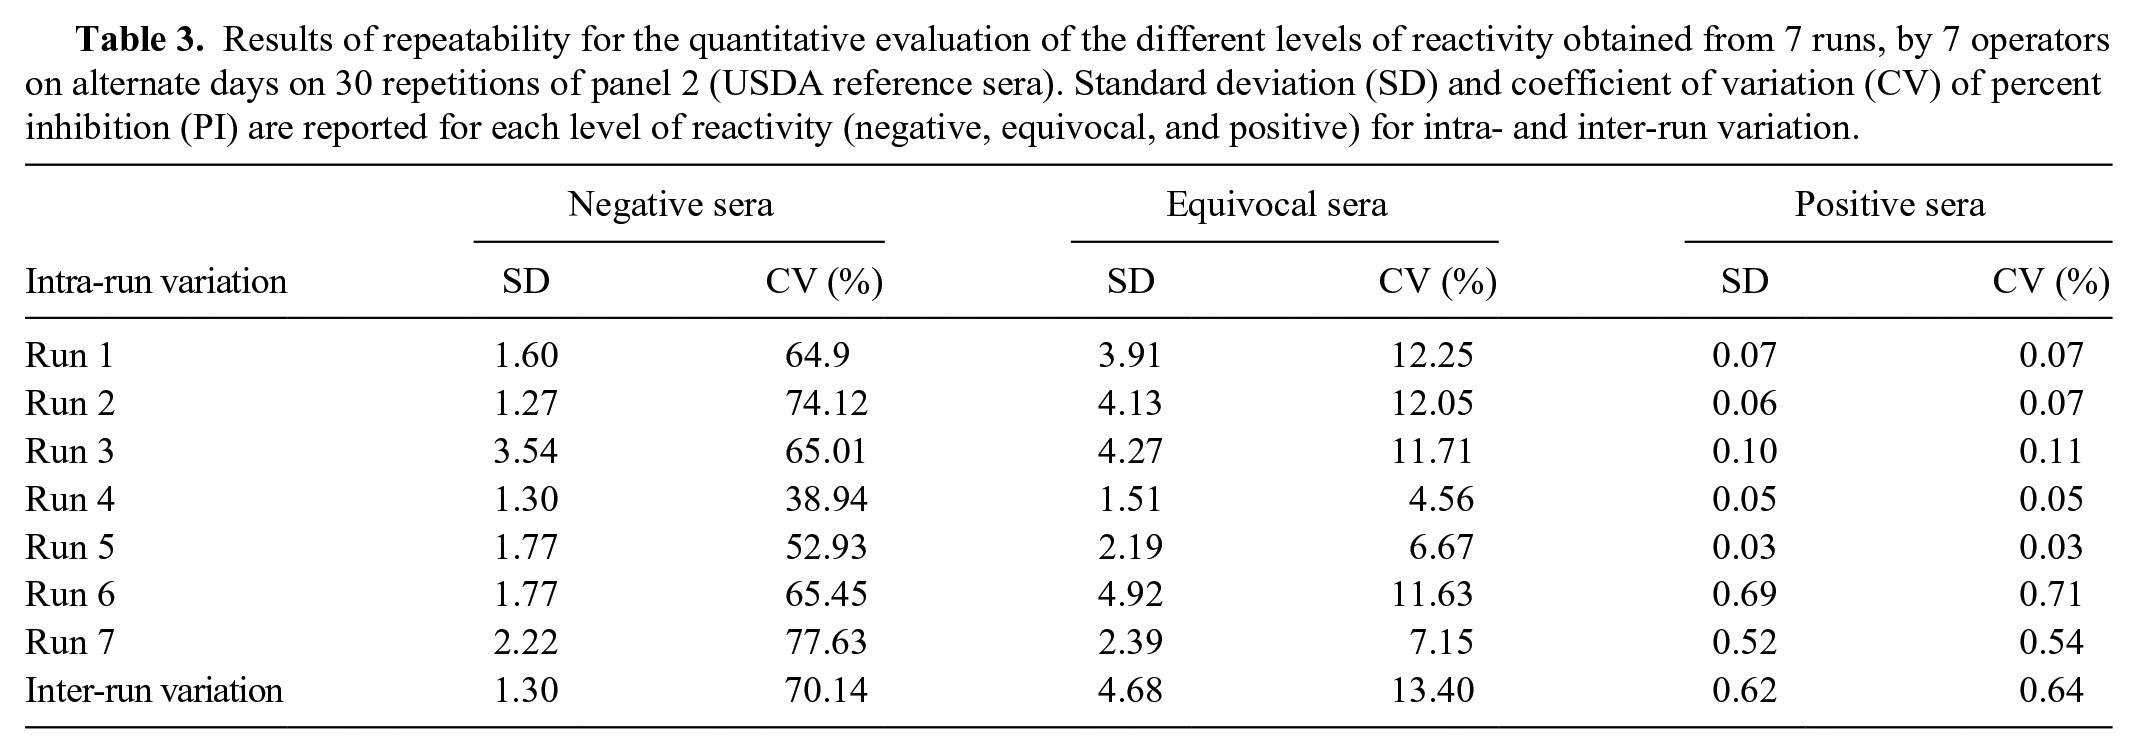
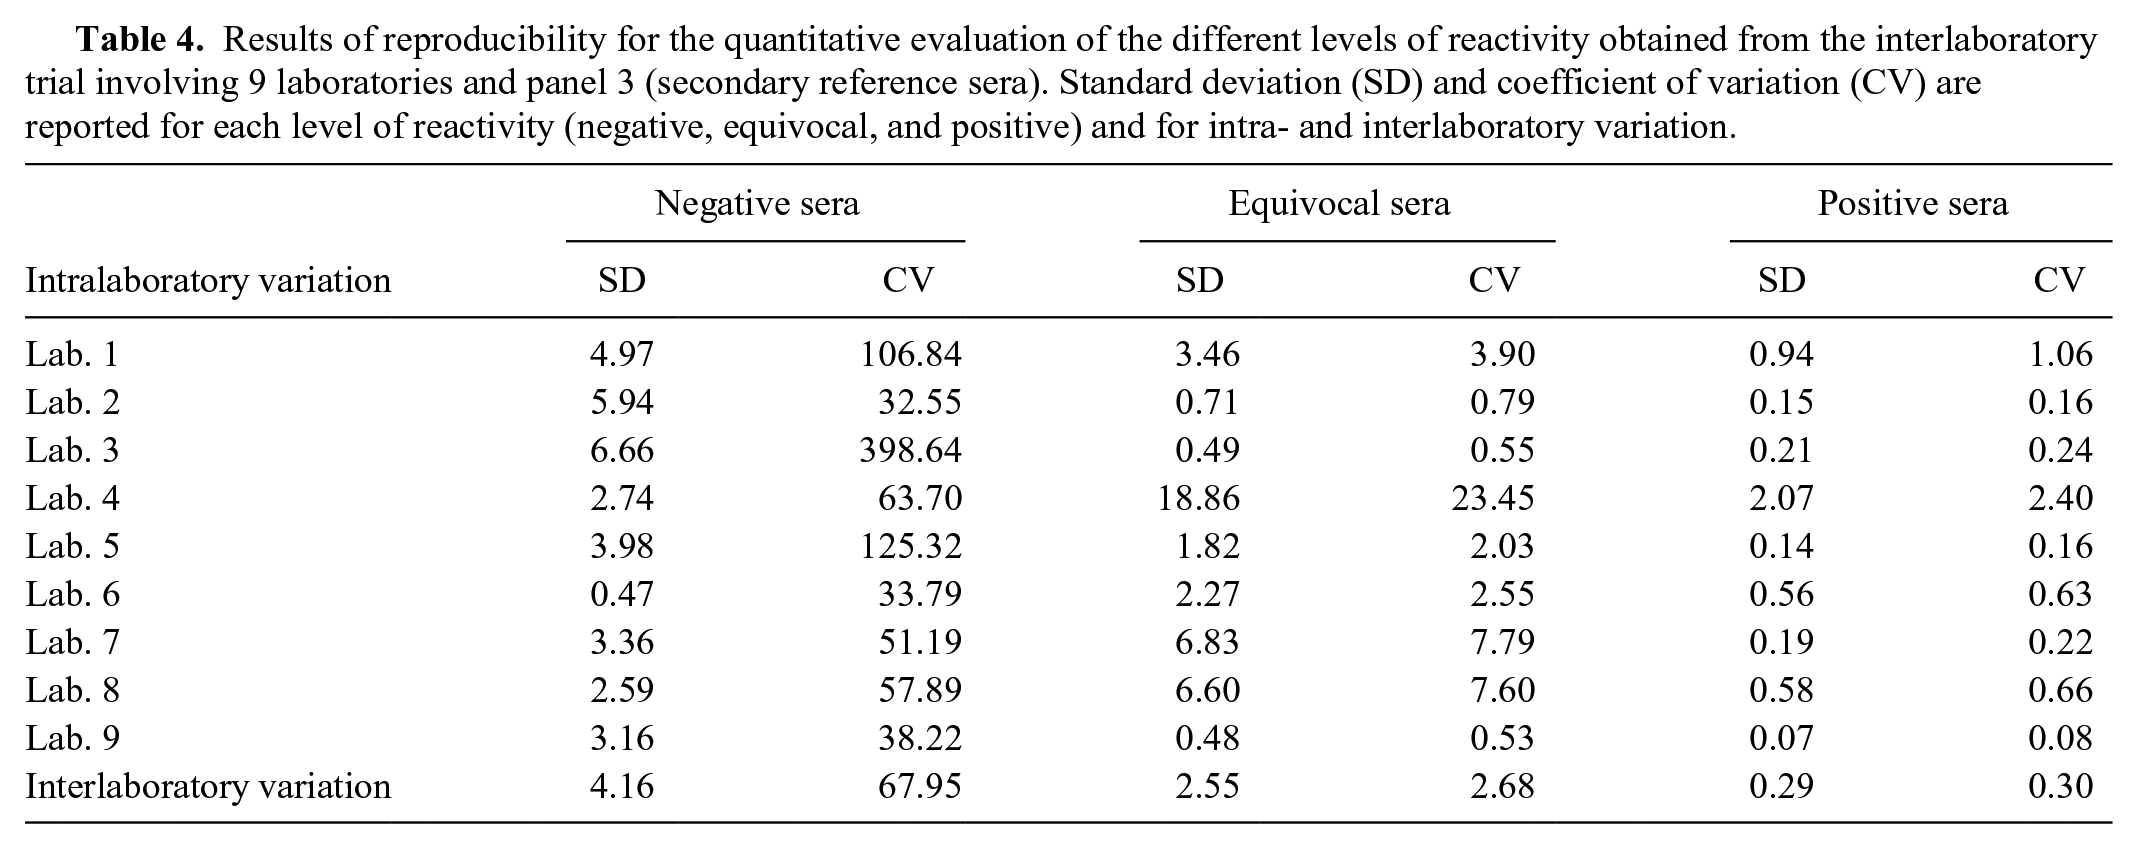
For repeatability, within all runs, SD was 1.30 (CV: 70.14%) for negative sera, 4.68 (CV: 13.40%) for equivocal sera, and 0.62 (CV: 0.64%) for positive sera (Table 3). For reproducibility, within all runs, SD was 4.16 (CV: 67.95%) for negative sera, 2.55 (CV: 2.68%) for equivocal sera, and 0.29 (CV: 0.30%) for positive sera (Table 4).
Results of repeatability for the quantitative evaluation of the different levels of reactivity obtained from 7 runs, by 7 operators on alternate days on 30 repetitions of panel 2 (USDA reference sera). Standard deviation (SD) and coefficient of variation (CV) of percent inhibition (PI) are reported for each level of reactivity (negative, equivocal, and positive) for intra- and inter-run variation.
Results of reproducibility for the quantitative evaluation of the different levels of reactivity obtained from the interlaboratory trial involving 9 laboratories and panel 3 (secondary reference sera). Standard deviation (SD) and coefficient of variation (CV) are reported for each level of reactivity (negative, equivocal, and positive) and for intra- and interlaboratory variation.
Using panel 3 (secondary reference sera), intralaboratory concordance, evaluated from the interlaboratory trial, gave a value of 1, for all laboratories and reactivity levels, except for one that obtained 0.75 for the equivocal sera. Interlaboratory concordance resulted in 1 for the negative and positive sera, respectively, and 0.97 for the equivocal sera. Discrepant results of the interlaboratory trial were provided by one laboratory misclassifying 3 equivocal sera as negative, with PI values of discrepant results of 29.30, 29.50, and 29.16, respectively.
Analytical specificity
For the evaluation of selectivity of the assay, the removal of reagents capable of neutralizing the interferences that may occur during the reaction effectively caused a misclassification of the results of panel 2 (USDA reference sera), when compared with those obtained using the standard procedure. The differences between the OD values of the 2 sets of results were statistically significant using Student t-test, for both positive and negative sera (t = 85.24 and 33.33, respectively; p < 0.01). On the other hand, all of the sera of panel 8 (lipemic and hemolyzed sera) were correctly identified using the standard procedure. No cross-reactivity was observed for the sera containing antibodies for nonequine lentiviruses (Feline immunodeficiency virus, Feline leukemia virus, Bovine leukemia virus, and Visna/maedi virus) and for the equine viral diseases evaluated (equine influenza viruses, Equine arteritis virus, Equid herpesvirus 1, and Equid herpesvirus 4), as their PI values were <5%.
Analytical sensitivity
For the LOD, the last reactive dilution of the certified positive serum, in all 7 runs, was 1:32 for the AGID test and 1:256 for the cELISA, the latter showing a detection limit of log 0.90 higher than that of the AGID test. To evaluate how early the cELISA is able to detect the development of anti-EIAV antibodies, the reactivity of this assay was compared with the AGID test using panel 6 (sera of vaccinated horses). The cELISA started detecting sera as positive from 21 dpv, for 1 horse; on 28 dpv, the sera of 16 out of the 24 had positive reactions and 2 equivocal. On the other hand, the AGID test detected positivity only from 28 dpv, and on a lower proportion of samples than those detected in cELISA, as only 80% were confirmed by AGID.
Diagnostic sensitivity and specificity
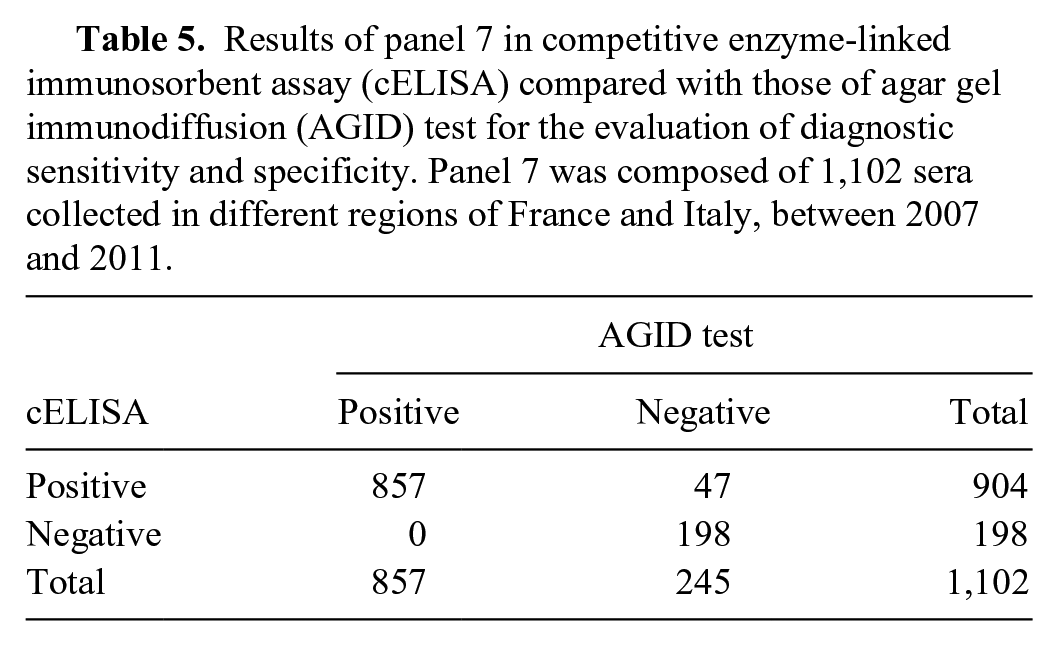
Although the minimum number of samples for determining DSe and DSp, with AGID test as the gold standard, resulted in 26 positive and 245 negative samples, the actual number used for panel 7 are those reported in Table 1. As the AGID test is still the official confirmatory test for the serologic detection of EIA antibody, the results of the cELISA were compared with those of the AGID test (Table 5).The cELISA DSe was 100% and DSp was 80.8% (95% CI: 69.7–90.99%). All 47 samples with discordant results (cELISA-positive, AGID-negative), considered as false positive for the calculation of DSp when compared with AGID, were confirmed as positive by immunoblot, confirming the lower sensitivity of the AGID test, which is a great disadvantage if this method were used as a screening test. The PPV and NPV values reflect the prevalence of the EIAV infection (Fig. 3).
Results of panel 7 in competitive enzyme-linked immunosorbent assay (cELISA) compared with those of agar gel immunodiffusion (AGID) test for the evaluation of diagnostic sensitivity and specificity. Panel 7 was composed of 1,102 sera collected in different regions of France and Italy, between 2007 and 2011.
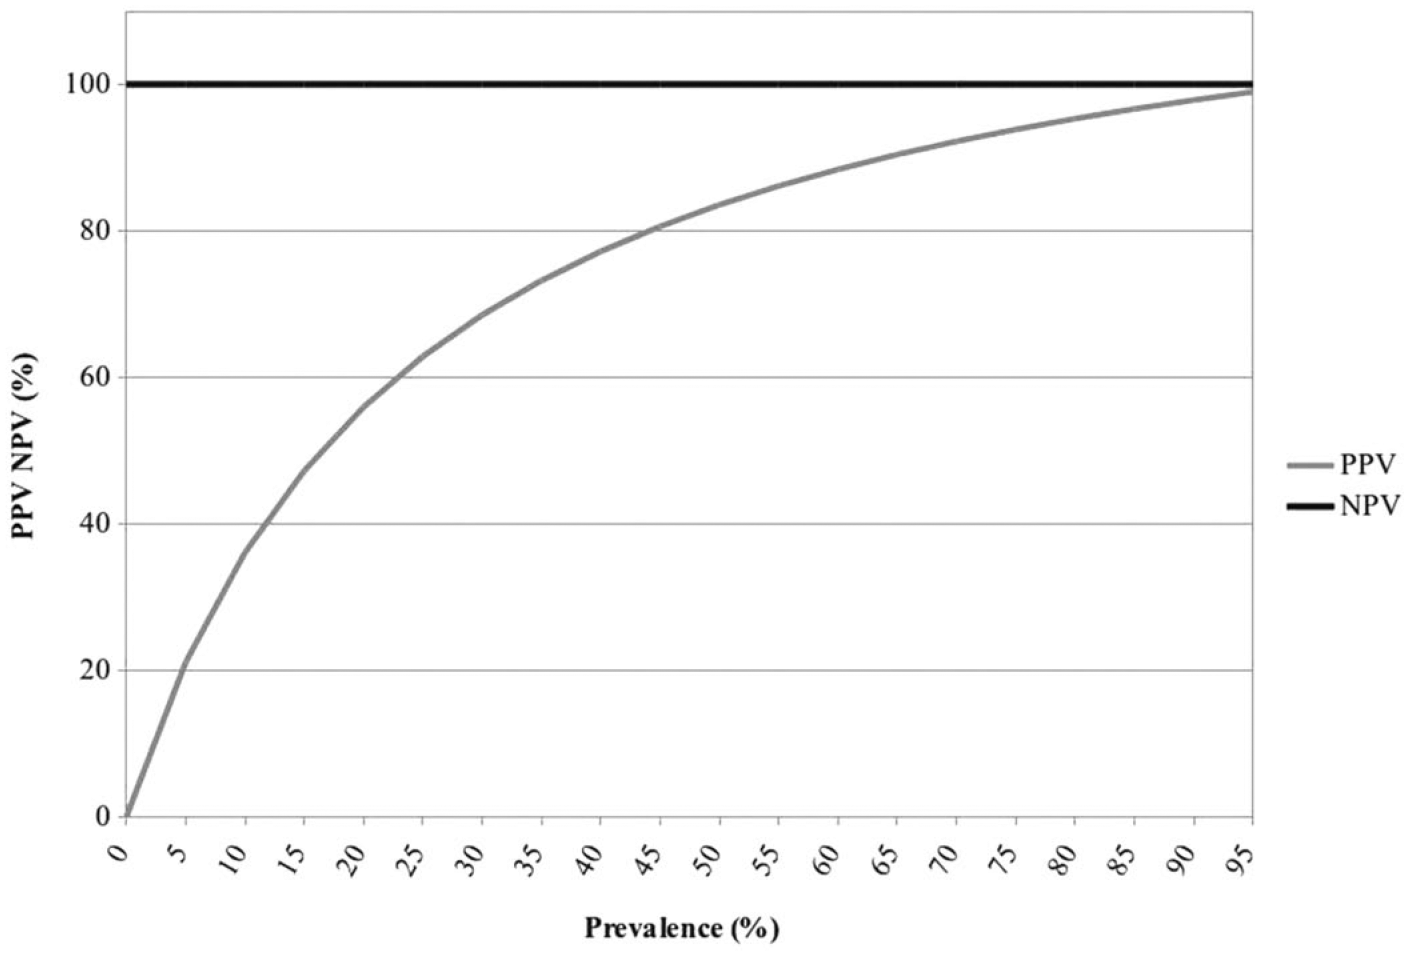
Trend of positive predictive value (PPV) and negative predictive value (NPV) of the competitive enzyme-linked immunosorbent assay for serologic detection of Equine infectious anemia virus for a prevalence of infection between 0 and 95%. Values for 100% of prevalence are not reported, as the NPV result was incomputable (0/0).
Discussion
A complete validation, according to internationally recognized criteria, such as those of the OIE, is effective in evaluating the performance of newly developed in-house ELISAs, and allows comparison of different assays used in the diagnosis of the same infectious disease. For optimal outcomes of the validation process, both users and producers should be involved. 7 Various authors have conducted such validations of serologic ELISAs for other viral diseases, employing both field and experimental samples.1,22
The cELISA in our study was developed as a screening test for EIA surveillance programs. This implies its extensive use by the Italian Official Laboratory Network, represented by more than 50 units, for which an objective estimation of repeatability, reproducibility, robustness, and ruggedness is necessary. Moreover, the aim of detecting EIAV infection, when present at a very low prevalence, as in Italy, influenced the setting of the cutoff values, balanced between the necessary levels of sensitivity and specificity and those established by statistical analysis.
Validation is usually performed on a limited, although statistically significant, number of samples, and the diagnostic performance estimated is influenced by these characteristics. The additional advantage of the present validation was that, besides the OIE procedure, data on almost 100,000 field samples examined during 4 years of surveillance was used to verify and more accurately assess the sensitivity and specificity of the test.
From the results obtained in this validation study, the EIA in-house serologic cELISA demonstrated high repeatability and reproducibility, as well as high analytical specificity, especially when compared with the AGID test, having a LOD nearly 10 times greater than the latter. The cELISA also showed optimal analytical specificity, as no cross-reactivity was detected with antibodies against other lentiviruses or against the most frequently reported equine viruses. All these features contribute to the definition of the method as robust.
The SDs of the negative, equivocal, and positive sera of panel 2 (USDA reference sera) for evaluating the repeatability of the test were low and comparable to those reported in literature for other ELISAs, even if not competitive. 23 For the evaluation of repeatability, the CV values of 13.4% for the equivocal sera and 0.64% for the positive sera, are considered as acceptable and comparable to those reported by other authors of 5.98–11.8%.3,4,17
Although SD values for reproducibility have not, to our knowledge, been reported, the value obtained for the cELISA can be considered satisfactory because the value is similar to the values obtained by other authors for repeatability.3,4,17 The same can be said for the reproducibility CV values of the equivocal (2.68%) and positive sera (0.30%), which are even lower than those reported in the literature (i.e., 7–10.6%). 3 For the negative sera, high CV values were observed, because these were estimated from the PI. In this case, small differences of the PI for this reactivity level had a greater weight than for the other levels, as is reported for positive sera when using OD values. 16 However, this high CV did not influence the outcome of the result.
In addition, intra- and inter-reproducibility, evaluated by concordance, established a high level of agreement, as the lowest value obtained was 0.75 by only 1 participant, and 0.97 relative to 1 reactivity level. In addition, the PI values obtained for the misclassified sera were at the limit of the cutoff level defining a serum as equivocal.
Inclusion of a gray zone in the described cELISA, in which the samples are defined as equivocal, was due to the detection of samples of animals confirmed as infected by EIAV within this interval. 18 For the PI interval of 30–50%, with specificity of 44–73.2%, the probability of sera with a false-positive reaction is high. However, when the effective DSp was estimated, this resulted in ~80%, which was considered acceptable for a screening method. In the CRAIE laboratory, the adoption of the cELISA as a screening test in routine testing, generated 182 sera (0.19%) with nonspecific reactions, as confirmed by AGID and immunoblot, out of a total of 96,468 samples examined. 13 For this, the screening method has an apparent DSp of 99.81%, higher than that estimated in its validation. The discrepancy between the values of specificity could be ascribed to the great divergence in the number of samples analyzed for the test validation compared with those processed during surveillance. The difference could also be attributed to the validation panel composition that could have included a relatively higher proportion of sera with cELISA-positive, AGID-negative, immunoblot-positive reactions, than those effectively present in field samples, and/or to the absence of immunoblot-nonspecific reactions. Furthermore, this discrepancy clearly demonstrates that the cELISA possesses a DSe and DSp higher than that of the AGID test (47 samples were cELISA-positive, AGID-negative, immunoblot-positive). 13
Regarding the hypothesis that there could have been an overestimation of the sensitivity in the validation process, the performance of the cELISA was superior to that of AGID test, as confirmed by the fact that cELISA used in a 3-tier system detected 17% more cases than if AGID alone was used 13 and, until now, no AGID-positive sample reacted negatively when examined by the cELISA.
Because PPV of the test decreases when the prevalence is low, as is the case in Italy, where the national prevalence is ~0.14% as estimated by CRAIE from surveillance activities, the cELISA is still capable of detecting more cases than if the AGID test was used as the screening test. The capability of the test in detecting EIAV infections in AGID low responders or in new cases, as demonstrated by the higher LOD of this test and the detection of a higher proportion of positive sera in the early phases of infection when compared with AGID test, facilitates earlier application of control measures in outbreaks.
Compared with AGID test, the cELISA uses smaller amounts of reagents, has lower production costs, provides higher output of samples and a reduced turnaround time, and the method is easily standardized with possible automation. Another advantage is that the reading of the results is carried out by an instrument, unlike the AGID test, and thus this also can be automated. Although the kit is not in a commercial format, the reagents are easily prepared and stored, and the test is simple to perform and similar to other ELISAs already used in the diagnosis of other infectious diseases. 2 At CRAIE, the test has obtained ISO/IEC 17025 accreditation based on the validation data described above.
The EIA cELISA described in our study was found to be “fit for purpose” as a screening assay at the population level to detect EIAV antibodies, and, incorporated into a 3-tier system, can also be employed to more accurately substantiate absence of infection than can the AGID test. Information available for other commercial ELISAs present in Italy for EIAV antibody do not provide sufficient data for their validation (Scicluna MT, personal communication, 2013). Further validation of the procedure is in progress to estimate its performance in mules and donkeys. Its extensive use in the past 8 years of surveillance has already demonstrated its higher sensitivity and specificity than that of the AGID test, when testing samples of these other equids.
Footnotes
Acknowledgements
We thank with affection, Dr. Paolo Cordioli, who prematurely passed away, for his involvement in the development of the method; Dr. Charles J. Issel from Gluck Equine Research Center, University of Kentucky, Lexington, Kentucky, for providing the sera from experimentally vaccinated animals; and Dr. Hans Aymeric from the European Union Reference Laboratory (EURL) for Equine Diseases for providing and analyzing field sera.
Authors’ contributions
R Nardini, GL Autorino, and MT Scicluna contributed to conception and design of the study. I Ricci, R Frontoso, F Rosone, and M Simula contributed to acquisition, analysis, and interpretation of data. GL Autorino and MT Scicluna gave final approval and agreed to be accountable for all aspects of the work in ensuring that questions relating to the accuracy or integrity of any part of the work are appropriately investigated and resolved.
a.
Vector kindly provided by Dr. FR Cook, Gluck Equine Research Center, University of Kentucky, Lexington, KY.
b.
Ultima DNA pol, Applied Biosystems, Foster City, CA.
c.
pTHIO-HIS, Invitrogen, Life Technologies, Carlsbad, CA.
d.
Invitrogen, Life Technologies, Carlsbad, CA.
e.
Plasmid mini kit, Qiagen GmBH, Hilden, Germany.
f.
ABI310, Applied Biosystems, Foster City, CA.
g.
Sigma-Aldrich, St. Louis, MO.
h.
Beckman Optima L-70 ultracentrifuge, Beckman Coulter, CA.
i.
Nunc MaxiSorp, Thermo Fisher Scientific, Waltham, MA.
j.
MP Biochemicals LLC, Illkirch, France.
k.
Liofilchem, Roseto degli Abruzzi, Teramo, Italy.
l.
Carlo Erba Reagents Srl, Cornaredo, Milan, Italy.
m.
Multiskan EX, Thermo Fisher Scientific, Waltham, MA.
n.
Milli-Q Academic, EMD Millipore Corp., Billerica, MA.
o.
Kindly provided by Dr. CJ Issel, Gluck Equine Research Center, University of Kentucky, Lexington, KY.
p.
Addinsoft, New York, NY.
Declaration of conflicting interests
The author(s) declared no potential conflicts of interest with respect to the research, authorship, and/or publication of this article.
Funding
The author(s) disclosed receipt of the following financial support for the research, authorship, and/or publication of this article: This study was conducted within the research project “Development of an ELISA for the serological diagnosis of equine infectious anaemia using recombinant antigens and monoclonal antibodies–IZS LT 001/98” funded by the Italian Ministry of Health.