
Abstract
In April 2013, a Porcine epidemic diarrhea virus (PEDV) epidemic began in the United States. As part of the response, real-time reverse transcription polymerase chain reaction (RT-PCR) assays to detect PEDV were developed by several veterinary diagnostic laboratories. Our study evaluated RT-PCR PEDV assays that detect the N gene (gN) and S gene (gS) for their ability to detect PEDV infection and the transmission potential of pigs experimentally exposed to PEDV. Detection limits and quantification cycle (Cq) values of real-time RT-PCR were assayed for PEDV samples and positive controls for both gN and gS. The limit of detection for the gN assay was 10−6 (mean Cq: 39.82 ± 0.30) and 10−5 (mean Cq: 39.39 ± 0.72) for the gS assay with PEDV strain USA/Colorado/2013. Following recommended guidelines, rectal swabs (n = 1,064) were tested; 354 samples were positive by gN assay and 349 samples were positive by gS assay (Cq ≤ 34.99), 710 samples were negative by gN assay and 715 were negative by gS assay (Cq > 34.99) of which 355 and 344 were “undetermined” (i.e., undetected within a threshold of 40 RT-PCR cycles, by gN and gS assays, respectively). The coefficient of variation (intra-assay variation) ranged from 0.00% to 2.65% and interassay variation had an average of 2.75%. PEDV could be detected in rectal swabs from all pigs for ~2 weeks postinfection at which time the prevalence began to decrease until all pigs were RT-PCR negative by 5 weeks postinfection. Our study demonstrated that RT-PCR assays functioned well to detect PEDV and that the gN assay was slightly better.
Introduction
Porcine epidemic diarrhea virus (PEDV; order Nidovirales, family Coronaviridae, 26 subfamily Coronavirinae, genus Alphacoronavirus) was first reported in the United Kingdom in 1971. 37 PEDV is spread by the oral uptake of feces from infected pigs, and the disease is characterized by severe viral enteritis, which destroys villus enterocytes, 25 resulting in vomiting, watery diarrhea, dehydration, and a high mortality rate in nursery piglets. PEDV has been reported in many other countries, including Germany, France, Switzerland, Hungary, Italy, China, South Korea, Thailand, and Vietnam, 31 and was first identified in the United States in April 2013 33 in sporadic cases of diarrhea in young piglets. By May of 2014, the outbreak had occurred in 31 U.S. states, where 8,386 confirmed cases (https://www.aasv.org/pedv/SECoV_weekly_report_140917.pdf) caused severe economic losses.
Porcine epidemic diarrhea virus contains an enveloped, single-stranded, positive-sense RNA genome that encodes major proteins, including spike (S), membrane (M), small membrane (sM), nucleocapsid (N), and envelope (E), translated from its subgenomic messenger RNA.
10
The S protein of PEDV is a type 1 transmembrane envelope glycoprotein and consists of the S1 and S2 domains, which are responsible for virus binding and fusion, respectively, and is an important site of viral neutralization.24,29 Studies have shown that all PEDV strains in the United States are clustered together within the subgenogroup 2a and are closely related to a strain from China, AH2012.12,33 However, phylogenetic analyses indicate the emergence of 2 distinct American PEDV clades.
35
As PEDV continues to spread throughout the United States, PEDV stra
Reverse transcription polymerase chain reaction (RT-PCR), which includes single and multiplex gel-based RT-PCR, has proven to be a convenient and sensitive assay for detection of PEDV genomic template.15,17 This technique has its limitations: identifying the virus by agarose gel electrophoresis is time consuming, the assay has lower sensitivity (10–100 times) than real-time PCR, and viral loads cannot be measured. In addition to enhanced sensitivity, the benefits of real-time PCR assays over conventional endpoint detection methods include their large dynamic range, a reduced risk of cross-contamination, an ability to be scaled up for high throughput applications, and the potential for accurate target quantification.3,22,30 It is important to recognize that there are differences between “real-time,” “gel-based,” or “nested” assays, which underscores the risk in comparing results between laboratories depending on sample type, test used, and context of sampling. Because RT-PCR only detects a small portion of the PEDV genome, a positive test does not confirm that the sample contains live, viable, or infective virus. Currently, bioassay (feeding some of the sample to susceptible piglets) is about the only way to answer if the sample contains live, infective PEDV.
Multiplex real-time RT-PCR was developed by several veterinary diagnostic laboratories and commercial enterprises for differential detection and quantification of the viral genomic templates of transmissible gastroenteritis virus and PEDV (including virulent and variant strains) in a variety of porcine and environmental samples including diarrheic feces.16,36 In our study, a set of 2 real-time RT-PCR PEDV assays established by the University of Minnesota1,2 in conjunction with sampling by the National Veterinary Service Laboratory and, modified at the National Animal Disease Center (NADC; Ames, Iowa), that detect the N gene (gN) and the S gene (gS), were used for the detection and relative quantification of viral loads of PEDV on rectal swabs from both experimentally and contact-infected piglets.
The goals of our study were to evaluate the gN and gS real-time RT-PCR assays as a method to assess PEDV transmission of nursery-aged pigs experimentally infected by contact. An infectious dose serial dilution pilot study was performed to evaluate the infectivity of 10-fold serial dilutions of a positive control sample of PEDV as a bioassay in 3-day-old piglets. The results indicated that this new real-time RT-PCR method had the advantages of sensitivity, rapidity, accuracy, and quantification, and provided a useful tool for studying the epidemiology and pathogenic properties of PEDV.
Materials and methods
Animal study
The animal study has been previously described, with schematic. 8 Conventionally raised pigs free of clinical disease were purchased at 3 weeks of age from a herd that was negative for Porcine reproductive and respiratory syndrome virus. The pigs were transported to the NADC and housed according to NADC Institutional Animal Care and Use Guidelines. Pigs were randomly assigned to treatment groups and acclimated to isolation rooms for 7–10 days before beginning the experiment at 0 days postinoculation (D0). On D0, a pig was orally inoculated with the PEDV USA/Colorado/2013 strain in a 2-mL volume (titer of 105.8 TCID50/mL). a On D1 and D2, 1 and 12 naive contact pigs were comingled with the infected pig in the same isolation room. On D7, 9 pigs were randomly selected from the 13 contact pigs and moved into a new isolation room to serve as the principal virus reservoir group (PG). The original inoculated pigs and 4 contact pigs remained in the initial isolation room until the end of the experiment (stationary group [SG]). One naive sentinel age-matched pig (S1) was comingled with the PG for 72 hr (D10) at which time the S1 pig was moved to a separate isolation room until autopsy on D30. On D14, the PG pigs were moved into a separate isolation room and pig S2 was comingled until D17 at which time S2 was moved into a separate isolation room until autopsy. This process was repeated on D21 and D28 with pigs S3 and S4, respectively. On D49, 5 naive age-matched pigs and the PG pigs were orally challenged with the PEDV USA/Colorado/2013 isolate (titer 105.8 TCID50/mL). All pigs were euthanized 28 days later on D78.
Sample collection
Rectal swabs were collected daily from exposed pigs at D0–D35 and D40–D77 (see Supplemental Data 1, available at http://vdi.sagepub.com/content/by/supplemental-data) using a sterile polyester-tipped applicator b immersed in a 5-mL polystyrene round-bottom tube c filled with 2 mL of minimal essential media (MEM). d All samples were frozen at −80°C until future use.
Primer and probe design
Primers and probe targeted conserved regions of the PEDV gN gene 16 and PEDV gS gene19,20 with modifications 2 specific to the PEDV strain USA/Colorado/2013 complete genome sequence isolated in North America (GenBank accession KF272920). Primers and a probe, labeled at the 5’-end with the reporter dye 6-carboxyfluorescein (FAM) and at the 3′-end with the 3′-quencher BHQ1, were targeted to the partial gS gene17,20,23 at nucleotides 1910-2021, which yielded a 111-bp DNA fragment. 2 Primers and a probe, labeled at the 5′-end with FAM and at the 3′-end with BHQ1, for gN real-time RT-PCR were targeted to the gN gene at nucleotides 941-1028, which yielded a 87-bp DNA fragment. The PED_N_Forward primer sequence was 5′-GAATTCCCAAGGGCGAAAAT-3′, the PED_N_Reverse primer sequence was 5′-TTTTCGACAAATTCCGCATCT-3′, and the PED_N_probe sequence was FAM-CGTAGCAGCTTGCTTCGGACCCA-BHQ. e The PED_S_Forward primer sequence was 5′-ACGTCCCTTTACTTTCAATTCACA-3′, the PED_S_Reverse primer sequence was 5′-TATACTTGGTACACACATCCAGAGTCA-3′, and the PED_S_probe sequence was FAM-TGAGTTGATTACTGGCACGCCTAAACCAC-BHQ. e Probes and primers were resuspended in sterile high-performance liquid chromatography–grade water to form a 10 μM and 37.5 μM solution, respectively, stored in 20-μL volume aliquots at −20°C until used.
Real-time RT-PCR
Each sample was thawed, vortexed for ~10 sec, then centrifuged to clarify. RNA extraction was performed with 200 μL of the supernatant from each rectal swab by using the a commercial pathogen RNA/DNA kit f in a compatible instrument f using program AM1836 according to the manufacturer’s feces total nucleic acid purification protocol. Viral RNA was eluted into 90 μL of buffer. PEDV gN and gS-based RT-PCR was performed on nucleic acid extracts using a multiplex one-step RT-PCR reaction master mix f according to the manufacturer’s recommendations for a real-time PCR system. f Briefly, 5 μL of RNA template was mixed with a reaction mixture containing 12.5 2× multiplex RT-PCR buffer, 2.5 μL of multiplex RT-PCR enzyme mix (10×), and 1.5 μL of primer/probe mix (to a final concentration of primer 750 nM each and probe 200 nM). RNase-free water was added to make up a volume of 25 μL. The reverse transcription was performed at 45°C for 10 min, reverse transcriptase denaturation at 95°C for 10 min, followed by 40 cycles of 95°C for 15 sec and 60°C for 45 sec during which fluorescence was collected. This protocol differs from the University of Minnesota Veterinary Diagnostic Laboratory where reverse transcription is conducted at 48°C. 2 Samples were run in duplicate. A run was considered valid when the following 5 criteria were met: 1) slopes of both standard curves were above −4 (PCR efficiency >77.8%); 2) correlation coefficient (r2) of at least 4 relevant data points above 0.99; 3) routinely included no-template control was not amplified; 4) the positive assay control was detectable; and 5) the negative assay control was not detected within the standard curve. Mean cutoff value of quantification cycle (Cq) ≤34.99 was selected as positive.
External standards
Ten-fold serial dilutions of a positive control sample of PEDV strain USA/Colorado/2013 a were prepared and stored at −80°C. Real-time RT-PCR was performed using these solutions to obtain standard curves. Repeatability or intra-assay variation (defined as the degree of agreement among individual tests) of the gN and gS real-time RT-PCR was calculated by computing the relative standard deviation (SD) of duplicates per assay. Reproducibility or interassay variation was assessed by computing the coefficient of variation (%CV) among the mean values in independent assays. Dilutions of the reference solutions were used as controls to assess the precision and reproducibility of the standard curves to quantitate PEDV genome template.
To allow accurate comparisons of the results between different samples and time points postchallenge, relative expression measures were adjusted by quantile normalization 21 so that the distribution for all samples was equal to compensate for sources of variability (Supplemental Data 1). Briefly, we performed normalization based on the positive control sample of PEDV strain USA/Colorado/2013. PEDV strain USA/Colorado/2013 diluted 100-fold was assigned to every plate and, to take advantage of this design, we performed normalization in the following way:
Multiple expression measures were averaged within each sample. Letting δ j represent the average expression value in sample j. (δ1, . . ., δ s ) represented the vector of average expression values for all conditions 1 to s.
We calculated the scale factor λ j for sample j where λ j represented the ratio of the expression in the first sample versus sample j (i.e., for λ j = (δ1/δ j ), j = 1 to s.
Finally, we normalized the raw data by multiplying the vector of data from sample j with the scale factor λ j for j =1 to s.
Plasmids
Plasmids containing the PEDV gene targets were generated as follows. RNA was extracted from PEDV strain USA/Colorado/2013 using a pathogen nucleic acid extraction kit (4462359) e according to manufacturer’s instructions. RNA was quantified using ultraviolet spectrophotometry. g Reverse transcription was performed using a complementary DNA synthesis kit e with 100 ng of RNA from the extraction. PCR was performed using DNA polymerase e with PED_N_Forward and PED_N_Reverse or the PED_S_Forward and PED_S_Reverse primers using 3 μL of the cDNA synthesis as template. Thermocycling conditions were set to mirror those used in the real-time RT-PCR protocol. PCR products were visualized on a 1% agarose gel to confirm presence of appropriate amplicon, and subsequently used in a topoisomerase I (TOPO) PCR cloning kit e following kit instructions using 4 μL of unpurified PCR product and the kit-provided vector. Two microliters of the TOPO cloning reaction was transformed into competent cells. e Positive clones were screened by growth on lysogeny broth agar plates containing 50 μg/mL of kanamycin, and plasmid DNA was purified using a plasmid miniprep kit. h PCR was performed again, and plasmids, which resulted in a positive amplicon, were submitted for Sanger sequencing to verify a correct sequence. Plasmid concentration was determined using ultraviolet spectrophotometry, g and copy number was calculated based on double-stranded DNA plasmid size: 3,630 bp for gS amplicon and 3,606 bp for gN amplicon. Plasmids were diluted appropriately to a concentration of 2 × 10⁸ copies/μL for use in real-time RT-PCR reactions.
Bioassay
To assess the infectivity of the PEDV stock virus, a bioassay consisting of inoculating susceptible piglets with samples of PEDV of known Cq values was performed (experiment A) and was repeated in experiment B, where pairs of pigs were inoculated with samples of PEDV of known titers. The sensitivity of the bioassay protocol was tested in an infectious dose serial dilution pilot study using real-time RT-PCR target gene gN detection. Three-day-old pigs from sows were purchased from a PEDV-negative farm (Table 2), and each pig was allocated to a separate pig tub housed in isolation rooms. Pigs were rectal swabbed and confirmed negative by gN PEDV real-time RT-PCR (D0; Table 2). Each pig was inoculated orally with 2 mL of a dilution of PEDV strain USA/Colorado/2013 in MEM. d Clinical signs of diarrhea, vomiting, and dehydration were monitored every 12 hr throughout the bioassay. Rectal swabs were collected from pigs at 12-hr intervals up to 96 hr postinoculation. Molecular detection of the PEDV gene target was performed by real-time RT-PCR assay using the gN probes and primers as previously described.
Results
After optimization of the conditions of the real-time RT-PCR, the assay was used to detect the gN and gS of PEDV strain USA/Colorado/2013. When FAM probes were selected, gN and gS generated distinctive products in their respective real-time RT-PCR assays.
To determine the analytical sensitivity (ASe) of the gN and gS real-time RT-PCR, 10-fold serial dilutions of USA/Colorado/2013 PEDV inoculum were analyzed and standard curves were constructed. In Table 1, the standard curves for gN and gS real-time RT-PCR had slopes of −3.436 and −3.129, respectively, indicating that the amplification efficiency was 95.45% and 89.51%, respectively (also shown in Fig. 2). The r2 were 0.996 and 0.999 for gN and gS PEDV, respectively, which suggested high correlation between Cq value and template concentration.
Intra- and interassay variation of Porcine epidemic diarrhea virus (PEDV) gN and gS quantification by real-time reverse transcription polymerase chain reaction (RT-PCR).
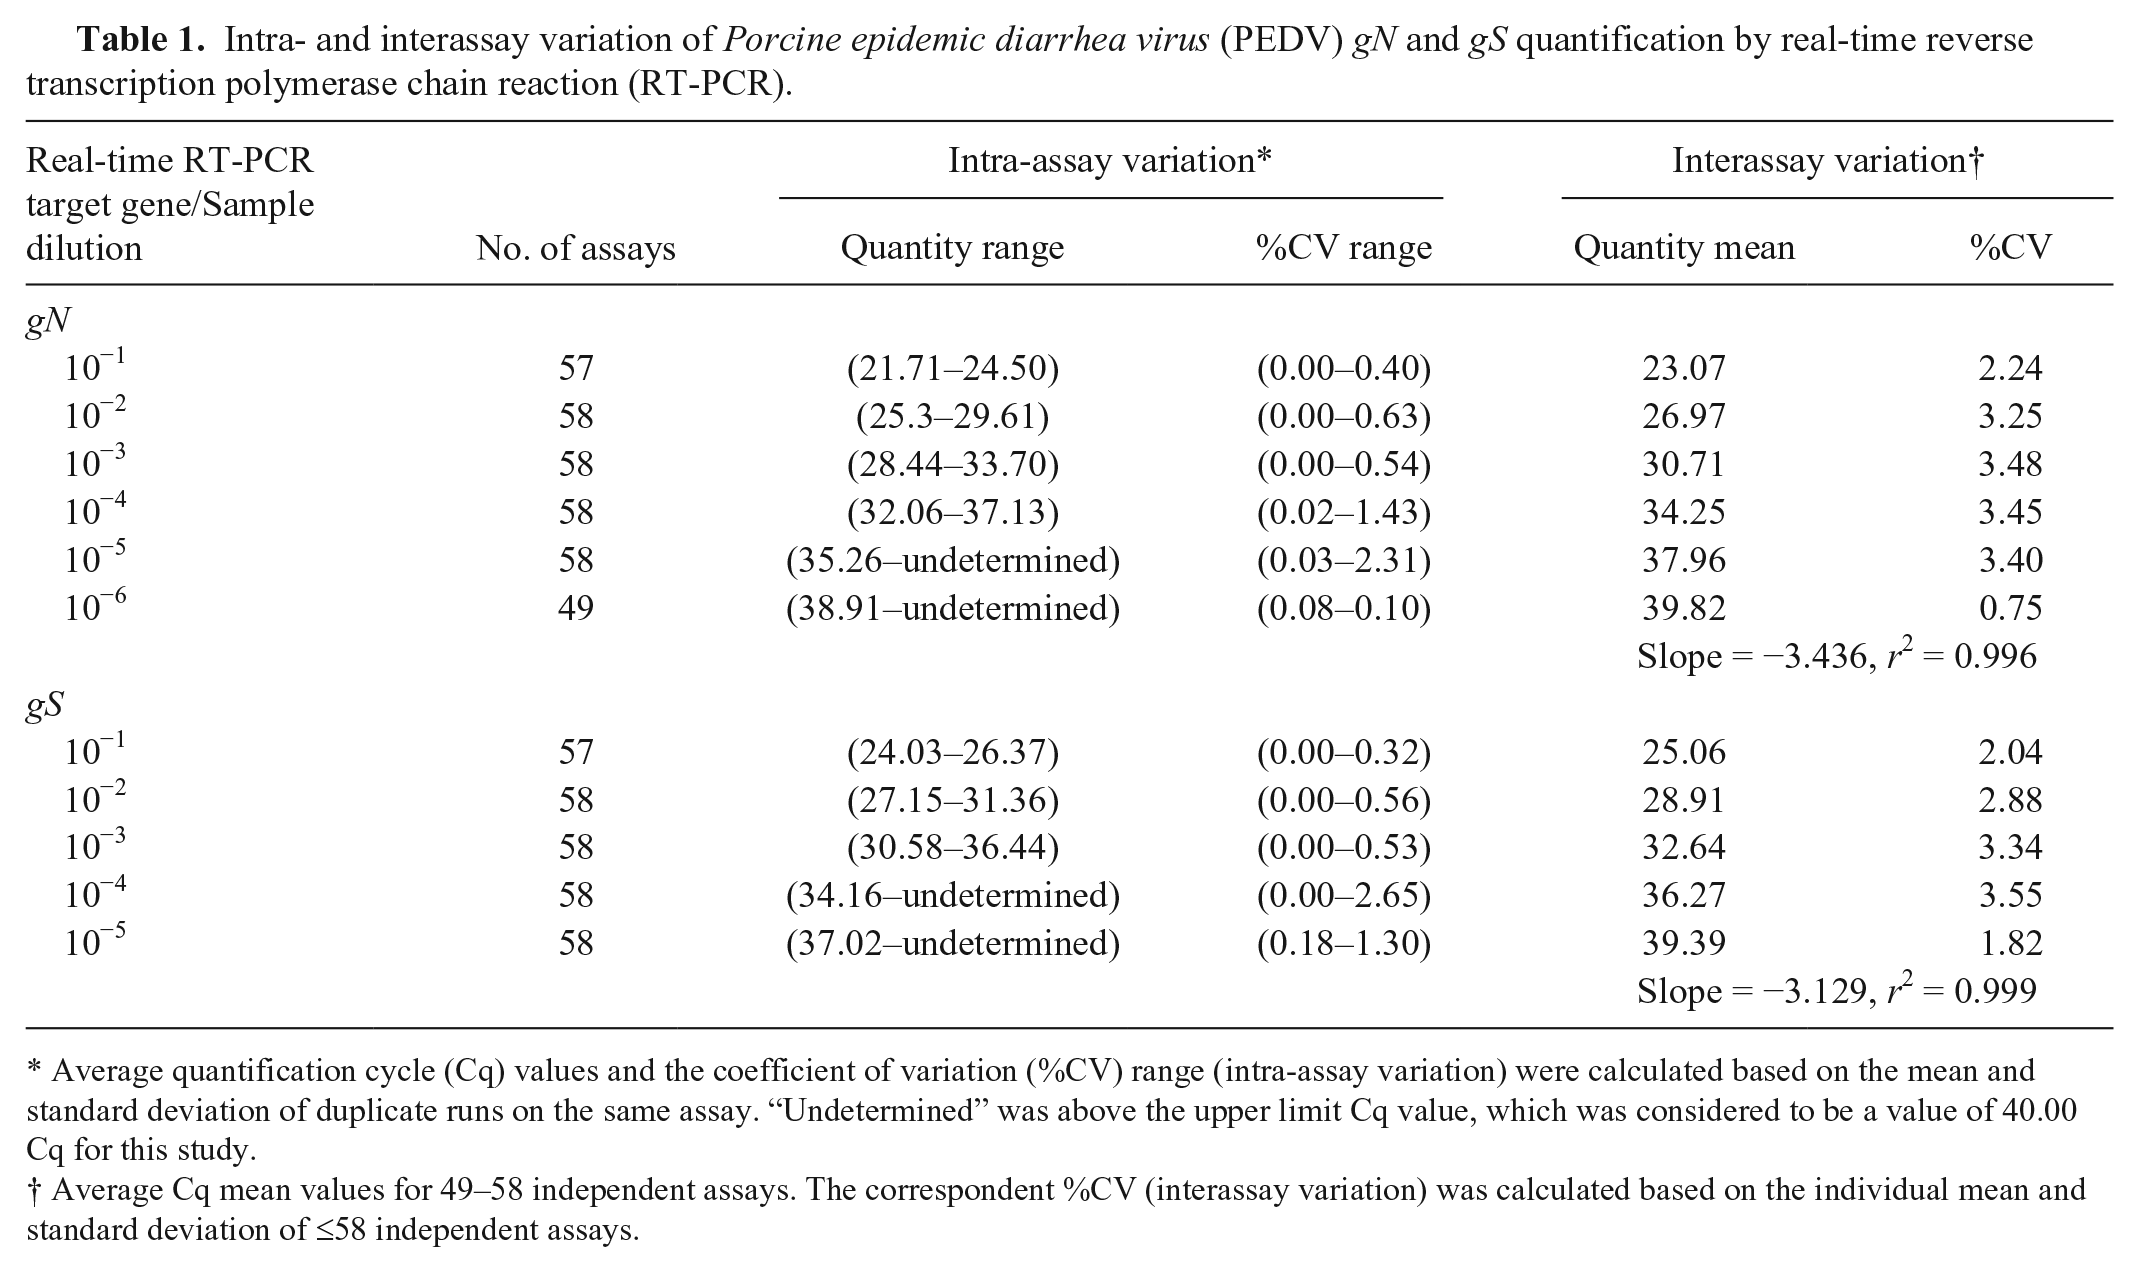
Average quantification cycle (Cq) values and the coefficient of variation (%CV) range (intra-assay variation) were calculated based on the mean and standard deviation of duplicate runs on the same assay. “Undetermined” was above the upper limit Cq value, which was considered to be a value of 40.00 Cq for this study.
Average Cq mean values for 49–58 independent assays. The correspondent %CV (interassay variation) was calculated based on the individual mean and standard deviation of ≤58 independent assays.
The assay variability, which was calculated based on %CV, was 2.76 ± 1.09% and 2.73 ± 0.77% for gN and gS, respectively (Table 1). As observed in this table, the intra-assay (or repeatability) %CV for PEDV standards ranged from 0.00% to 2.31% and 0.00% to 2.65% for amplification of gN and gS, respectively. Table 1 shows the dilution limit of detection for the gN assay was 10−6 (at a mean Cq of 39.82 ± 0.30) and 10−5 (at a mean Cq of 39.39 ± 0.72) for the gS assay for the detection PEDV strain USA/Colorado/2013.
A total of 1,064 fecal samples were subjected to PEDV diagnosis by gN and gS real-time RT-PCR. Mean Cq values >34.99 were considered equivocal but have been reported as negative in previous diagnostic laboratory reports. 1 Cq values >39.99 were reported as “undetermined” by the real-time PCR system, f and, for the purposes of relative quantification, were designated a Cq value of 40. To avoid false positives, both values contributing to the calculation of the mean were above the cutoff value of Cq 34.99. As shown in Figure 1, 354 samples were positive by gN real-time RT-PCR assay and 349 samples were positive by gS real-time RT-PCR assay (Cq ≤ 34.99), 710 samples were negative by gN real-time RT-PCR assay and 715 samples were negative by gS real-time RT-PCR assay (Cq > 34.99), of which 355 samples were equivocal by gN real-time RT-PCR assay and 371 samples were equivocal by gS real-time RT-PCR assay (Cq > 34.99 and ≤ 39.99). If a cutoff of Cq > 37, as used by some laboratories (Schwartz K, 2014, http://nationalhogfarmer.com/health/understanding-pedv-diagnostic-tests-and-tools), is selected, 401 samples were positive by gN real-time RT-PCR assay and 416 samples were positive by gS real-time RT-PCR assay (Cq ≤ 36.99), 663 samples were negative by gN real-time RT-PCR assay and 648 samples were negative by gS real-time RT-PCR assay (Cq > 36.99), of which 308 samples were equivocal by gN real-time RT-PCR assay and 304 samples were equivocal by gS real-time RT-PCR assay (Cq < 36.99 and ≤ 39.99). The 5 naive animals (N) had “undetermined” Cq at D47 and D48 prior to exposure to PEDV, which by quantile normalization and using the upper limit of Cq (i.e., 40) gave the negatively reported Cq values of 39.79 (D47) and 39.85 (D48) in the gN assay and 39.88 and 39.02 in the gS assay (Fig. 1; Supplemental Data 1). Clinically, no signs of diarrhea were shown in pigs on the same days in which they tested negative by gN and gS real-time RT-PCR assay (Cq > 34.99). 8 Therefore, if we take signs of diarrhea as a true positive standard, sensitivity (DSe) and specificity (DSp) can be estimated as DSe 96.82–100.00% (95% confidence interval [CI]) and DSp 71.85–77.47% (95% CI) for the gN assay, and DSe 96.82–100.00% (95% CI) and DSp 72.39–77.98% (95% CI) for the gS assay.
Real-time reverse transcription polymerase chain reaction (RT-PCR) Porcine epidemic diarrhea virus (PEDV) assay results visualized in a heat map. On day (D)0, a 4-week-old pig (P0) was challenged with PEDV, and 14 naive contacts (PG and SG) were comingled. On D7, 9 contact pigs (PG) were moved to a new room to serve as the principal virus reservoir group, and comingled with 1 naive age-matched sentinel (S1). Three days later, the S1 pig was moved to a separate room until necropsied. This process was repeated on D14, 21, and 28 with pigs S2, S3, and S4, respectively. On D49, 5 naive age-matched pigs (N) and the PG pig were challenged (N/C, PG/C) with homologous virus and euthanized on D78. A daily rectal swab was collected from each pig and tested for PEDV using real-time RT-PCR. Days post–primary inoculation are on the x-axis. Positive (red) where Cq ≤ 34.99, negative (green) where Cq ≥ 39.99, equivocal (white) where Cq ≥ 34.99 and Cq ≤ 39.99, and not tested are indicated by solid gray.
Plasmids containing the PEDV gN and gS gene targets were generated, and a 10-fold serial dilution was run on the corresponding PEDV real-time RT-PCR assay 3 times (Fig. 2), with a detection limit of 10 genome equivalents, which occurred around a Cq of 38.3 (gN) and 38.8 (gS). The determined slope, r2, and intercept value of the standard curve were −3.13 ± 0.04, 0.998, and 39.7 ± 0.37 for gN, and −3.14 ± 0.05, 0.998, and 39.4 ± 0.46 for gS, which can be used to transform the Cq values into estimated copies of PEDV RNA per milliliter of original material and therefore quantify viral loads in the rectal swabs.
gN and gS real-time reverse transcription polymerase chain reaction (RT-PCR) assay standard curves using external standards. N-plasmid was run on the gN Porcine epidemic diarrhea virus (PEDV) real-time RT-PCR assay (n = 3) as a 10-fold serial dilution with a detection limit of 10 genome equivalents, which occurred around a Cq of 38.3, slope = −3.13 ± 0.04, r2 = 0.998, and intercept value = 39.7 ± 0.37, where the upper limit for Cq was 40. S-plasmid was run on the gS PEDV real-time RT-PCR assay (n = 3) as a 10-fold serial dilution with a detection limit of 10 genome equivalents, which occurred around a Cq of 38.8, slope = −3.14 ± 0.05, r2 = 0.998, and intercept value = 39.4 ± 0.46. Ten-fold serial dilution standard curves of USA/Colorado/2013 PEDV inoculum were analyzed. The standard curve for gN real-time RT-PCR had a slope of −3.436 and r2 of 0.996. The standard curve for gS real-time RT-PCR had a slope of −3.129 and r2 of 0.999.
A swine bioassay was performed to evaluate the infectivity of 10-fold serial dilutions of PEDV strain USA/Colorado/2013 with known Cq values prior to inoculation. In experiment A, shown in Table 2, pigs inoculated with PEDV 105.3 TCID50/mL and PEDV 102.3 TCID50/mL were humanely euthanized before 72 and 60 hr postinoculation, respectively. Another pig inoculated with PEDV 100.3 TCID50/mL died from trauma prior to 84 hr postinoculation. No gN PEDV was detected in rectal swabs from this pig. All other pigs were euthanized and autopsied at 96 hr postinoculation. PEDV was detected at equivocal to positive Cq levels in pigs inoculated with lesser dilutions of 104.3 and 103.3 TCID50/mL at 60 hr, becoming definitively positive at 96 hr. No positive gN PEDV (Cq ≤ 34.99) was detected in the rectal swabs of pigs inoculated with dilutions of PEDV strain USA/Colorado/2013 ≤101.3 TCID50.
Porcine epidemic diarrhea virus (PEDV) bioassay.*
Undet. = undetermined.
Average quantification cycle (Cq) values were calculated based on the mean ± standard deviation of duplicate runs on the same gN real-time reverse transcription polymerase chain reaction assay.
In experiment B (Table 2), pairs of pigs were inoculated with 10-fold serial dilutions of PEDV strain USA/Colorado/2013 with known titers. One pig inoculated with PEDV 105.3 TCID50/mL and 1 pig inoculated with PEDV 104.3 TCID50/mL was humanely euthanized prior to 84 hr postinoculation. All other pigs were euthanized and autopsied at 96 hr postinoculation. PEDV was detected in the rectal swabs at 24 hr of one of the pigs inoculated with PEDV 105.3 and 1 inoculated with 103.3 TCID50/mL, and at 36 hr in the fecal samples of the pigs inoculated with PEDV 105.3, 104.3, and 103.3 TCID50/mL to a positive Cq. By 60 hr, the fecal samples of all the pigs were positive for PEDV (Table 2, experiment B).
Discussion
Maintenance of a PEDV-free status involves surveillance of susceptible swine. A critical need for the current PEDV surveillance program in the United States is the rapid detection of PEDV infection. Although a number of diagnostic procedures have been developed for detecting PEDV (e.g., RT-PCR, reverse transcription loop-mediated isothermal amplification based on M or N gene,13,18,27 multiplex RT-PCR based on S gene, 32 RT-PCR–based dot blot hybridization, 14 ELISA based on M or N protein,11,28 and immunohistochemical detection 9 ), real-time RT-PCR is preferred because this assay can be used as a high throughput test system that can detect PEDV genomic template during the acute phase of the infection or pre-seroconversion. The gN and gS real-time RT-PCR PEDV assays have been demonstrated to be very effective for the detection and differentiation of field and vaccine strains of PEDV.1,2,17 The primers and probes for the gN 16 (UMVDL, 2013, http://www.cvm.umn.edu/sdec/prod/groups/cvm/@pub/@cvm/@sdec/documents/content/cvm_content_446628.pdf) and gS (UMVDL, 2013) assays have previously been shown to be specific for PEDV, with no cross-reaction with other diarrhea-causing viruses. The goal of our study was to evaluate the gN and gS real-time RT-PCR assays to detect an acute PEDV infection in experimentally infected pigs.
Cell-adapted virus culture supernatant and recombinant plasmids can be used for determination of the sensitivity of real-time PCR.6,16 However, these analytical assays do not precisely correlate with the infectivity of a PCR-positive sample. In our study, 10-fold dilutions of PEDV strain USA/Colorado/2013 were used to determine the sensitivity of the gN and gS real-time RT-PCR assays. By using different concentrations of the primers, probes, and other reagents, as well as reaction temperatures and times, the conditions of the gN and gS real-time RT-PCR assay were optimized as described in the “Materials and methods” section. Under these conditions, the detection limits of gN and gS were dilutions of 10−6 and 10−5 per reaction, equivalent to ~10−2.2 and ~10−0.2 TCID50/mL, respectively, while the assay efficiency was 95.45% for gN and 89.51% for gS. The low mean %CV of the real-time RT-PCR assays indicated that these assays were able to generate reproducible results.
In practice, 10 copies of target DNA per PCR vessel is the lowest concentration that is amplified each time a PCR assay is performed. 34 The mathematical model of PCR is based on the assumption that each DNA template molecule is reliably duplicated once per cycle, assuming an excess of reagents. In practice, a variety of factors impact amplification kinetics, particularly when the copy number is low, causing deviation from the ideal model. These factors include RNA quality, residual inhibitors, operator technique, primer quality, efficiency of reverse transcription, and the “Monte Carlo” effect (inherent limitation of PCR amplification from small amounts of complex template caused by differences in amplification efficiency between individual templates). 4 The outcome can be a reduced yield of PCR product or scattered Cq values between replicate quantitative PCR reactions. The lower the Cq, the more genomic copies (virus) are present. Each Cq unit is 2-fold difference in quantity of virus. For example, there is twice as much target in a sample with Cq of 25 than there is in a sample with Cq of 26. A Cq of 20 is considered quite positive, and a Cq of 20 has 1,000× more target in the sample than does a Cq of 30.
It is recommended to normalize cutoffs with relative or absolute quantification approaches. 7 Real-time amplification efficiency varies within and between laboratories, and a set cutoff might not be constant across runs. Currently, diagnostic laboratories frequently select a subjective cutoff value of Cq > 35 1 or Cq > 37 (Schwartz K, 2014) for real-time amplification assays, above which a Cq value is deemed negative for infectious virus because we cannot be certain that a signal is a consequence of a target DNA amplification (considered false positive). Commonly, higher Cq values are generated by degradation of the probe-based fluorophore by cross-contamination or by nonspecific amplification of background nucleic acid. 5 Cq cutoff is an in-house characteristic: the value is linked to cycler, analysis, sample preparation, and laboratory. Adopting a common Cq cutoff is viable. One technical justification to select a Cq cutoff earlier during the reaction is to consider a Cq value false when it is below the corresponding reliable limit of detection of the assay. Any samples with no amplification (“undetermined”) are reported as negative while samples with a Cq value ≤34.99 are reported as positive. The number of equivocal samples above this Cq should be followed to detect an increase in their incidence. Future studies will involve testing suspect and equivocal samples for infectious virus using cell culture and bioassay techniques.
The sensitivity of a bioassay protocol was demonstrated with an infectious dose serial dilution pilot study tested in 3-day-old piglets with dilutions of infectious PEDV with known Cq. Rectal swabs from pigs inoculated with ≥101.3 TCID50/mL and Cq of 27.28 ± 0.07 of PEDV contained detectable Cq of PEDV (Cq ≤ 39.99) by gN real-time RT-PCR. Rectal swabs from pigs inoculated with ≥102.3 TCID50/mL and inocula Cq of 24.14 ± 0.02 of PEDV contained positive Cq of PEDV (Cq ≤ 34.99) by gN real-time RT-PCR. This indicates an infectious dose of PEDV between 101.3 and 102.3 TCID50/mL and Cq value of 24.14 ± 0.02 and 27.28 ± 0.07. From our analysis, we found that a gN real-time RT-PCR assay alone using a Cq value ≤34.99 cutoff would be a convenient, rapid, and sensitive diagnostic tool for routine surveillance of viral infection in swine by rectal swab.
Footnotes
Acknowledgements
We thank S Anderson and D Adolphson for technical assistance, J Huegel, T Standley, and J Crabtree as animal caretakers, and S Ohlendorf for secretarial assistance in preparation of the manuscript.
Authors’ note
Mention of trade names or commercial products in this article is solely for the purpose of providing specific information and does not imply recommendation or endorsement by the U.S. Department of Agriculture. The U.S. Department of Agriculture (USDA) prohibits discrimination in all its programs and activities on the basis of race, color, national origin, age, disability, and where applicable, sex, marital status, familial status, parental status, religion, sexual orientation, genetic information, political beliefs, reprisal, or because all or part of an individual’s income is derived from any public assistance program. (Not all prohibited bases apply to all programs.) Persons with disabilities who require alternative means for communication of program information (Braille, large print, audiotape, etc.) should contact the USDA TARGET Center at (202)720-2600 (voice and TDD). To file a complaint of discrimination, write to USDA, Director, Office of Civil Rights, 1400 Independence Avenue, SW, Washington, DC. 20250-9410, or call (800)795-3272 (voice) or (202)720-6382 (TDD). USDA is an equal opportunity provider and employer.
Authors’ contributions
LC Miller, KK Crawford, and KM Lager contributed to conception and design of the study. All authors contributed to acquisition, analysis, and interpretation of data; drafted the manuscript; critically revised the manuscript for important intellectual content; gave final approval; and agreed to be accountable for all aspects of the work in ensuring that questions relating to the accuracy or integrity of any part of the work are appropriately investigated and resolved.
a.
PEDV USA/Colorado/2013 isolate provided by National Veterinary Service Laboratory, Ames, IA.
b.
Puritan Medical Products, Guilford, ME.
c.
BD Falcon, Franklin Lakes, NJ.
d.
SAFC 56416C, SAFC Biosciences Inc., Lenexa, KS.
e.
MagMax 5X pathogen nucleic acid extraction kit, Superscript VILO cDNA synthesis kit, the Platinum PCR SuperMix High Fidelity, Zero Blunt TOPO PCR cloning kit, pCR-Blunt II-TOPO vector, Transform One Shot competent cells; Integrated DNA Technologies, Coralville, IA.
f.
MagMAX pathogen RNA/DNA kit, MagMAX Express instrument, Ambion Path ID multiplex one-step RT-PCR reaction master mix, 7500 Fast real-time PCR system; Life Technologies, Carlsbad, CA.
g.
Nanodrop, ThermoFisher Scientific, Waltham, MA
h.
Zyppy plasmid miniprep kit, Zymo Research, Irvine, CA.
Declaration of conflicting interests
The author(s) declared no potential conflicts of interest with respect to the research, authorship, and/or publication of this article.
Funding
This work was supported by the U.S. Department of Agriculture Agricultural Research Service “Intervention Strategies to Control Viral Diseases of Swine” (Appropriated 5030-32000-108-00).