
Abstract
The purpose of our study was to document the continued comparative proficiency of different laboratories that perform a monoclonal antibody–based enzyme-linked immunosorbent assay (macELISA) for detection of allergen-specific immunoglobulin (Ig)E in dogs. Replicate samples of 18 different sera pools were independently evaluated in a single blinded fashion by each of 16 different operators functioning in 10 different laboratories. The average intra-assay variance among reactive assay calibrators in all laboratories was 6.0% (range: 2.7–16.1%), while the average intralaboratory interassay variance was 7.5% (range: 3.9–10.9%). The overall interassay interlaboratory variance was consistent among laboratories and averaged 11.4% (range: 8.5–12.5%). All laboratories yielded similar profiles and magnitudes of responses for replicate unknown samples; dose response profiles observed in each of the laboratories were indistinguishable. Considering the positive or negative results, interassay interlaboratory concordance of results exceeded 90%. Correlation of optical density values between and among all laboratories was strong (r > 0.9, P < 0.001). Collectively, the results demonstrated that the macELISA for measuring allergen-specific canine IgE is reproducible, and documents that consistency of results can be achieved not only in an individual laboratory by differing operators but also among laboratories using the same monoclonal-based ELISA.
Introduction
Allergen-specific immunotherapy, with or without concurrent use of anti-inflammatory drugs, is often the method selected for intervention in allergic diseases in companion animals.3–5,10–12 The selection of allergens included in the allergen-specific therapeutic regimen relies on demonstration of immunoglobulin (Ig)E-mediated hypersensitivity by either intradermal skin testing or allergen-specific IgE serology.1,2,6,10 Only recently has critical evaluation of some of the currently available tests been addressed.7,8,13,14 In 2009, the performance characteristics of a monoclonal antibody cocktail–based enzyme-linked immunosorbent assay (macELISA) were described, and a preliminary interlaboratory evaluation between 2 laboratories that run this assay was provided. 7 At the same time, consistency of results between laboratories that perform macELISA and laboratories that perform an assay using the alpha chain of human high affinity IgE receptor (FcεR1α) was also documented.13,14 In 2012, it was documented that it is possible to establish and monitor intra- and interlaboratory standardization to ensure the uniformity, consistency, and reproducibility of results reported among different laboratories that perform the same testing. 8 The reproducibility of results from 6 different laboratories were compared, and the consistency of those results prompted the proposal of a prototype proficiency monitoring program for establishing an industry-wide voluntary quality assurance program for serum allergen–specific IgE testing that independently monitors performance of all laboratories and assay formats. Unfortunately, such an external and independent quality assurance program has not yet been established.
Greer Laboratories (Lenoir, North Carolina) has established a proficiency monitoring program for laboratories that routinely run the macELISA for evaluation of allergen-specific IgE in serum samples. The foundation for this program is based on the results published for the inaugural proficiency evaluations in 6 different laboratories, which documents that interlaboratory standardization and quality control measures in the veterinary arena are on the immediate forefront and that uniformity, consistency, and reproducibility of results between laboratories is achievable. 8 Greer’s program is designed not only to evaluate the proficiency of laboratories, but to ensure that individual operators yield consistent and reproducible results. The results presented in our study summarize the comparative proficiency evaluations, completed in 2014, that were observed in 10 affiliate laboratories.
Materials and methods
All serum samples, buffers, antigen-coated wells, calibrator solutions, and other assay components were aliquants of the respective lots of materials manufactured at Greer’s production facilities (Lenoir, North Carolina) and supplied as complete kits to the participating laboratories along with the exact instructions for completing the evaluations. Separate proficiency evaluations were completed in each laboratory from July 2013 through January 2014.
Participating laboratories
Ten independent Veterinary Reference Laboratories (VRLs) participated in this proficiency evaluation of macELISA. Participating laboratories included 4 separate IDEXX Laboratories (Memphis, Tennessee; Westbrook, Maine; Markham, Ontario Canada; and Ludwigsburg, Germany). Other affiliated European laboratories that participated in this evaluation included Agrolabo (Scarmagno, Italy), Artu Biologicals (Lelystad, The Netherlands), Axiom Laboratories (Newton-Abbott, UK), Univet Diagnostic Services (Barcelona, Spain), and Biovac (Beaucouzé, France). Greer Laboratories served as the prototype for evaluation of the macELISA. Because the performance characteristics of macELISA in Greer’s VRL have been well documented for use over an extended period, 7 all results observed in the other participating laboratories were compared directly with the results observed in Greer’s reference laboratory.
Serum samples
Eight separate pollen- and mite-reactive sera pools and 2 nonreactive sera pools were prepared from samples that previously had been evaluated using macELISA. The allergen-specific reactivity of each sera pool ranged from nonreactive to multiple pollen or mite reactivities. These sera pools and admixtures of the pools were used to construct a specific group of samples that exhibited varying reactivity to the allergens included in the evaluation panel. In addition, a 3-fold serial dilution of a highly pollen-reactive pool and a pool of sera moderately reactive to pollens and mites, diluted in nonreactive sera, served to document the dose response evident within the assay. Eighteen samples were included in each blinded evaluation. Two known pollen-reactive control samples and 1 nonreactive control sample were also included.
Calibrators
Calibrator solutions of predetermined reactivity in the macELISA were prepared as 2-fold serial dilution calibrators (nos. 1–4) of a sera pool highly reactive to most pollen allergens. An additional calibrator (no. 5) was prepared as a 1:6 dilution of sera shown to be negative to pollen allergens in the macELISA. The reactivity of these calibrators to a mixture of grass pollen allergens was determined in each assay run. The expected background-corrected values for each of the calibrators (1–5) was 2438, 1445, 814, 416, and 14 ELISA absorbance units (EAU), respectively.
Buffers
The buffers used throughout have been previously described,7,8 and included 1) well coating buffer: 0.05 M sodium carbonate bicarbonate buffer, pH 9.6; 2) wash buffer: phosphate buffered saline (PBS), pH 7.4, containing 0.05% Tween 20, and 0.05% sodium azide; 3) serum and reagent diluent buffer: PBS, pH 7.4, containing 1% fish gelatin, 0.05% Tween 20, and 0.05% sodium azide.
Allergen panel
The allergen panel used for proficiency evaluations in each of the laboratories was a 24 allergen composite derived from the array of allergens that are included in all of the panels used in the various laboratories. The composite allergen panel consisted of 4 grasses, 6 weeds, 6 trees, 5 mites, and 3 fungi.
Preparation of coated wells
Microwell flat bottom strip assemblies a were used throughout and served as the solid phase for all indirect bind ELISAs. The 12-well strips were individually coated with the specified allergen extracts following a previously defined procedure.7,8 Briefly, the individual extracts were diluted in bicarbonate buffer (pH 9.6), and 100 µL was added to each assigned well. Following overnight incubation at 4–8ºC, the wells were washed with PBS, blocked with 1% monoethanolamine (pH 7.5), then air dried and stored at 4–8°C in re-sealable zipper storage bags until used.
Sample evaluations: macELISA
The specific IgE reactivity to the various allergens included in the proficiency panel evident in each of the serum pools was determined using the indirect bind macELISA.7,8 Briefly, 100 µL of appropriately diluted sample (1:6) was added to duplicate wells that had previously been coated with the various specific panel-defined allergens. Following an overnight incubation (14–18 hr) at 4–8°C in a humidified chamber, the wells were washed (2 complete aspirate and wash cycles using PBS wash solution), then 100 µL of an appropriately diluted cocktail containing 3 biotinylated monoclonal anti-dog IgE second antibodies was added to each well. The wells were returned to the humidified chamber, and incubation continued at room temperature (20–25°C) for another 2 hr, and then the wells were washed (3 complete aspirate/wash cycles). Streptavidin–alkaline phosphatase enzyme conjugate was added, and incubation at room temperature continued for 1 hr. Following a final wash step (4 complete aspirate and wash cycles), 100 μL of p-nitrophenylphosphate (pNPP) b substrate was added to each well and incubation continued for precisely 1 hr. Substrate development was then stopped by adding 50 μL of 20 mM cysteine to each well. Specific IgE reactivity to the allergens was estimated by determining the absorbance of each well measured at 405 nM using an automated plate reader. All results were expressed as EAU, which are background-corrected observed responses expressed as milliabsorbance.
Statistics
A coefficient of variation was calculated as the ratio of standard deviation and means of the responses observed for the calibrator solutions within different runs in multiple laboratories. Pearson correlation statistic was used for interlaboratory comparison among individual allergens.
Results
The assay variances (%CV) observed with the calibrator solutions in the different laboratories and for different operators are presented in Table 1 and are representative of the assay reproducibility in the various laboratories and with differing operators. The average intra-assay %CV among positive calibrators (nos. 1–4) was 6.0% (range: 2.7–16.1%); substantial differences among laboratories or between assay runs were not detected. Intra-assay variability was higher with negative calibrator 5 (average: 11.8%, range: 4.9–34.3%), while the greatest intra-assay variability was evident with the background optical densities (ODs; average: 15.5, range: 2.9–42.1%). The average interassay variance (%CV) observed with the calibrator solutions within each laboratory among the positive calibrators (nos. 1–4) was 7.5% (range: 3.9–10.9%). Interassay variability was higher with negative calibrator 5 (average: 12.3%, range: 8.9–15.6%), while the greatest interassay variability was evident with the background ODs (average: 17.7%, range: 8.1–33.2%). The interlaboratory %CV among reactive calibrators (nos. 1–4) remained relatively constant (average: 11.4%, range: 8.5–12.5%). Again, the greatest variance among the various laboratories was observed with the negative calibrator 5 (18.9%), and with the background ODs (average: 26.9%).
Assay variance (%CV) of macELISA (monoclonal antibody–based enzyme-linked immunosorbent assay for detection of allergen-specific immunoglobulin E) calibrator solutions observed with different laboratory runs by multiple operators.
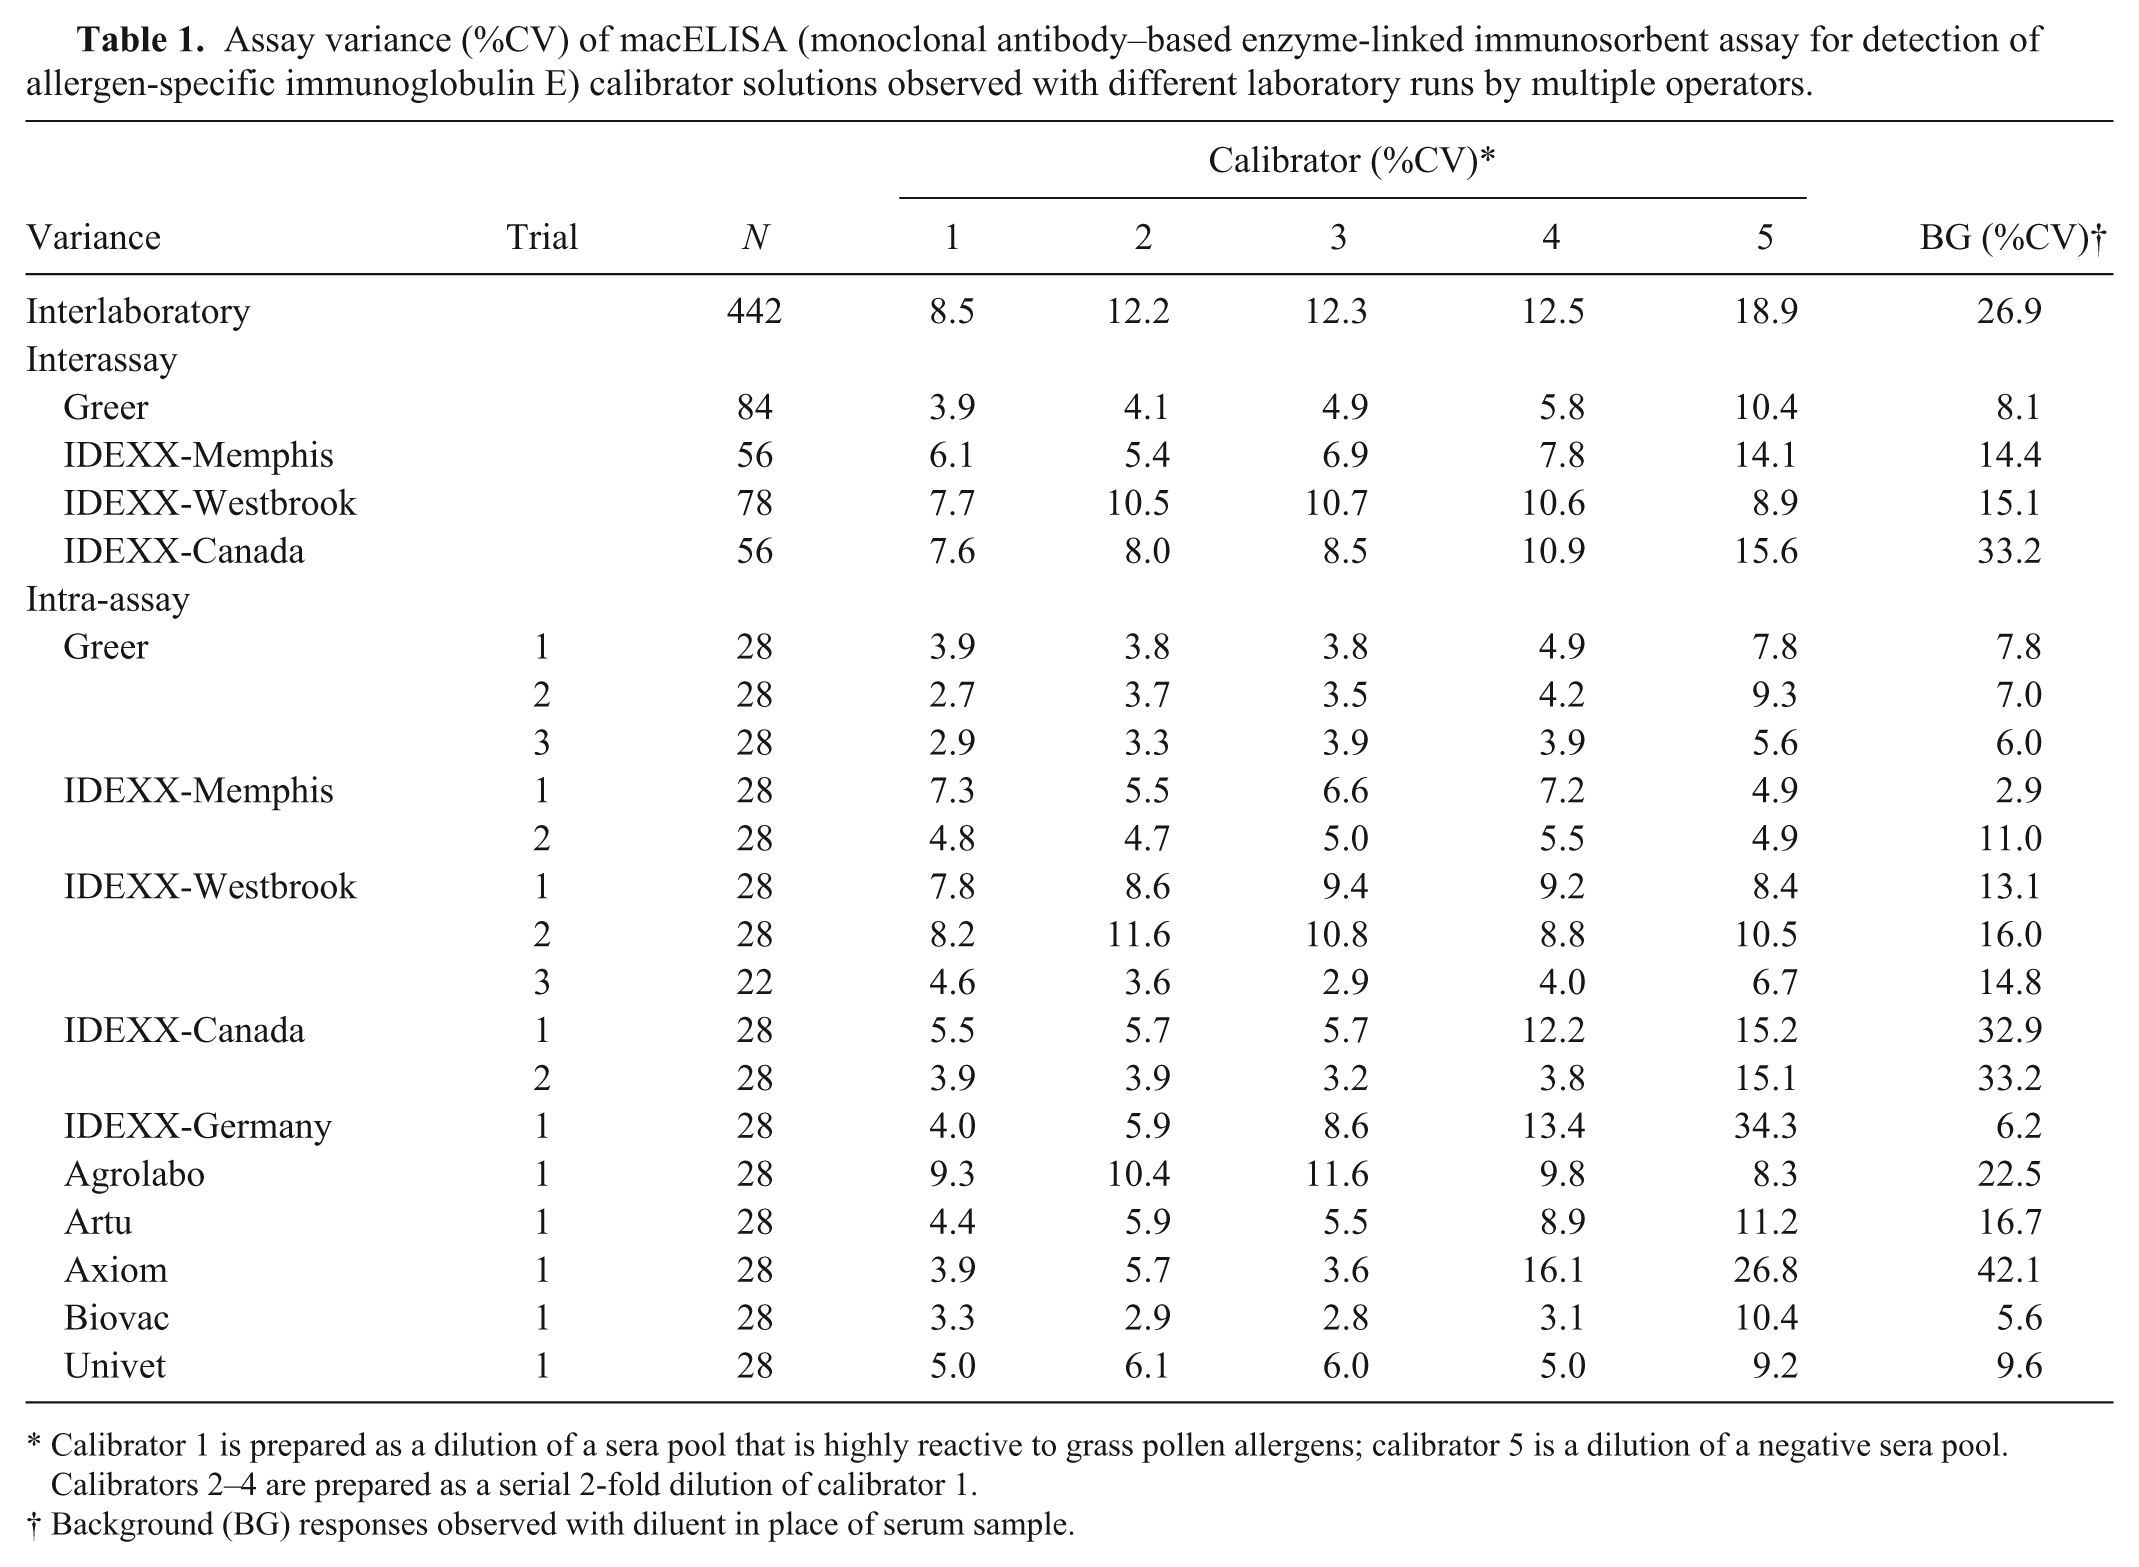
Calibrator 1 is prepared as a dilution of a sera pool that is highly reactive to grass pollen allergens; calibrator 5 is a dilution of a negative sera pool. Calibrators 2–4 are prepared as a serial 2-fold dilution of calibrator 1.
Background (BG) responses observed with diluent in place of serum sample.
The concordance of positive and negative results observed within and among laboratories for the individual allergens contained within the proficiency panel is presented in Table 2. Using predefined cutoff points of 150, 300, and 600 EAU, results were classified as positive or negative. The average interassay interlaboratory concordance of results for the mite allergens at the 150 EAU cutoff was 92.6% (range: 86.9–98.7%). Similar concordance of results was evident among all laboratories for the pollen allergens. The average concordance for grasses, trees, and weeds was demonstrated to be 94.2% (range: 93.3–95.8%), 94.5% (range: 92.2–97.7%), and 93.0% (range: 90.6–96.4%), respectively. The concordance of results for all pollen allergens was demonstrated to be 93.9% (range: 90.6–97.7%), whereas the overall average interassay interlaboratory concordance of results for individual allergen evaluations, including fungi, using the 150 EAU cutoff was 91.0% (range: 70.8–99.7%).
Interassay and interlaboratory concordance of results in relation to enzyme-linked immunosorbent assay absorbance units (EAU) cutoff.
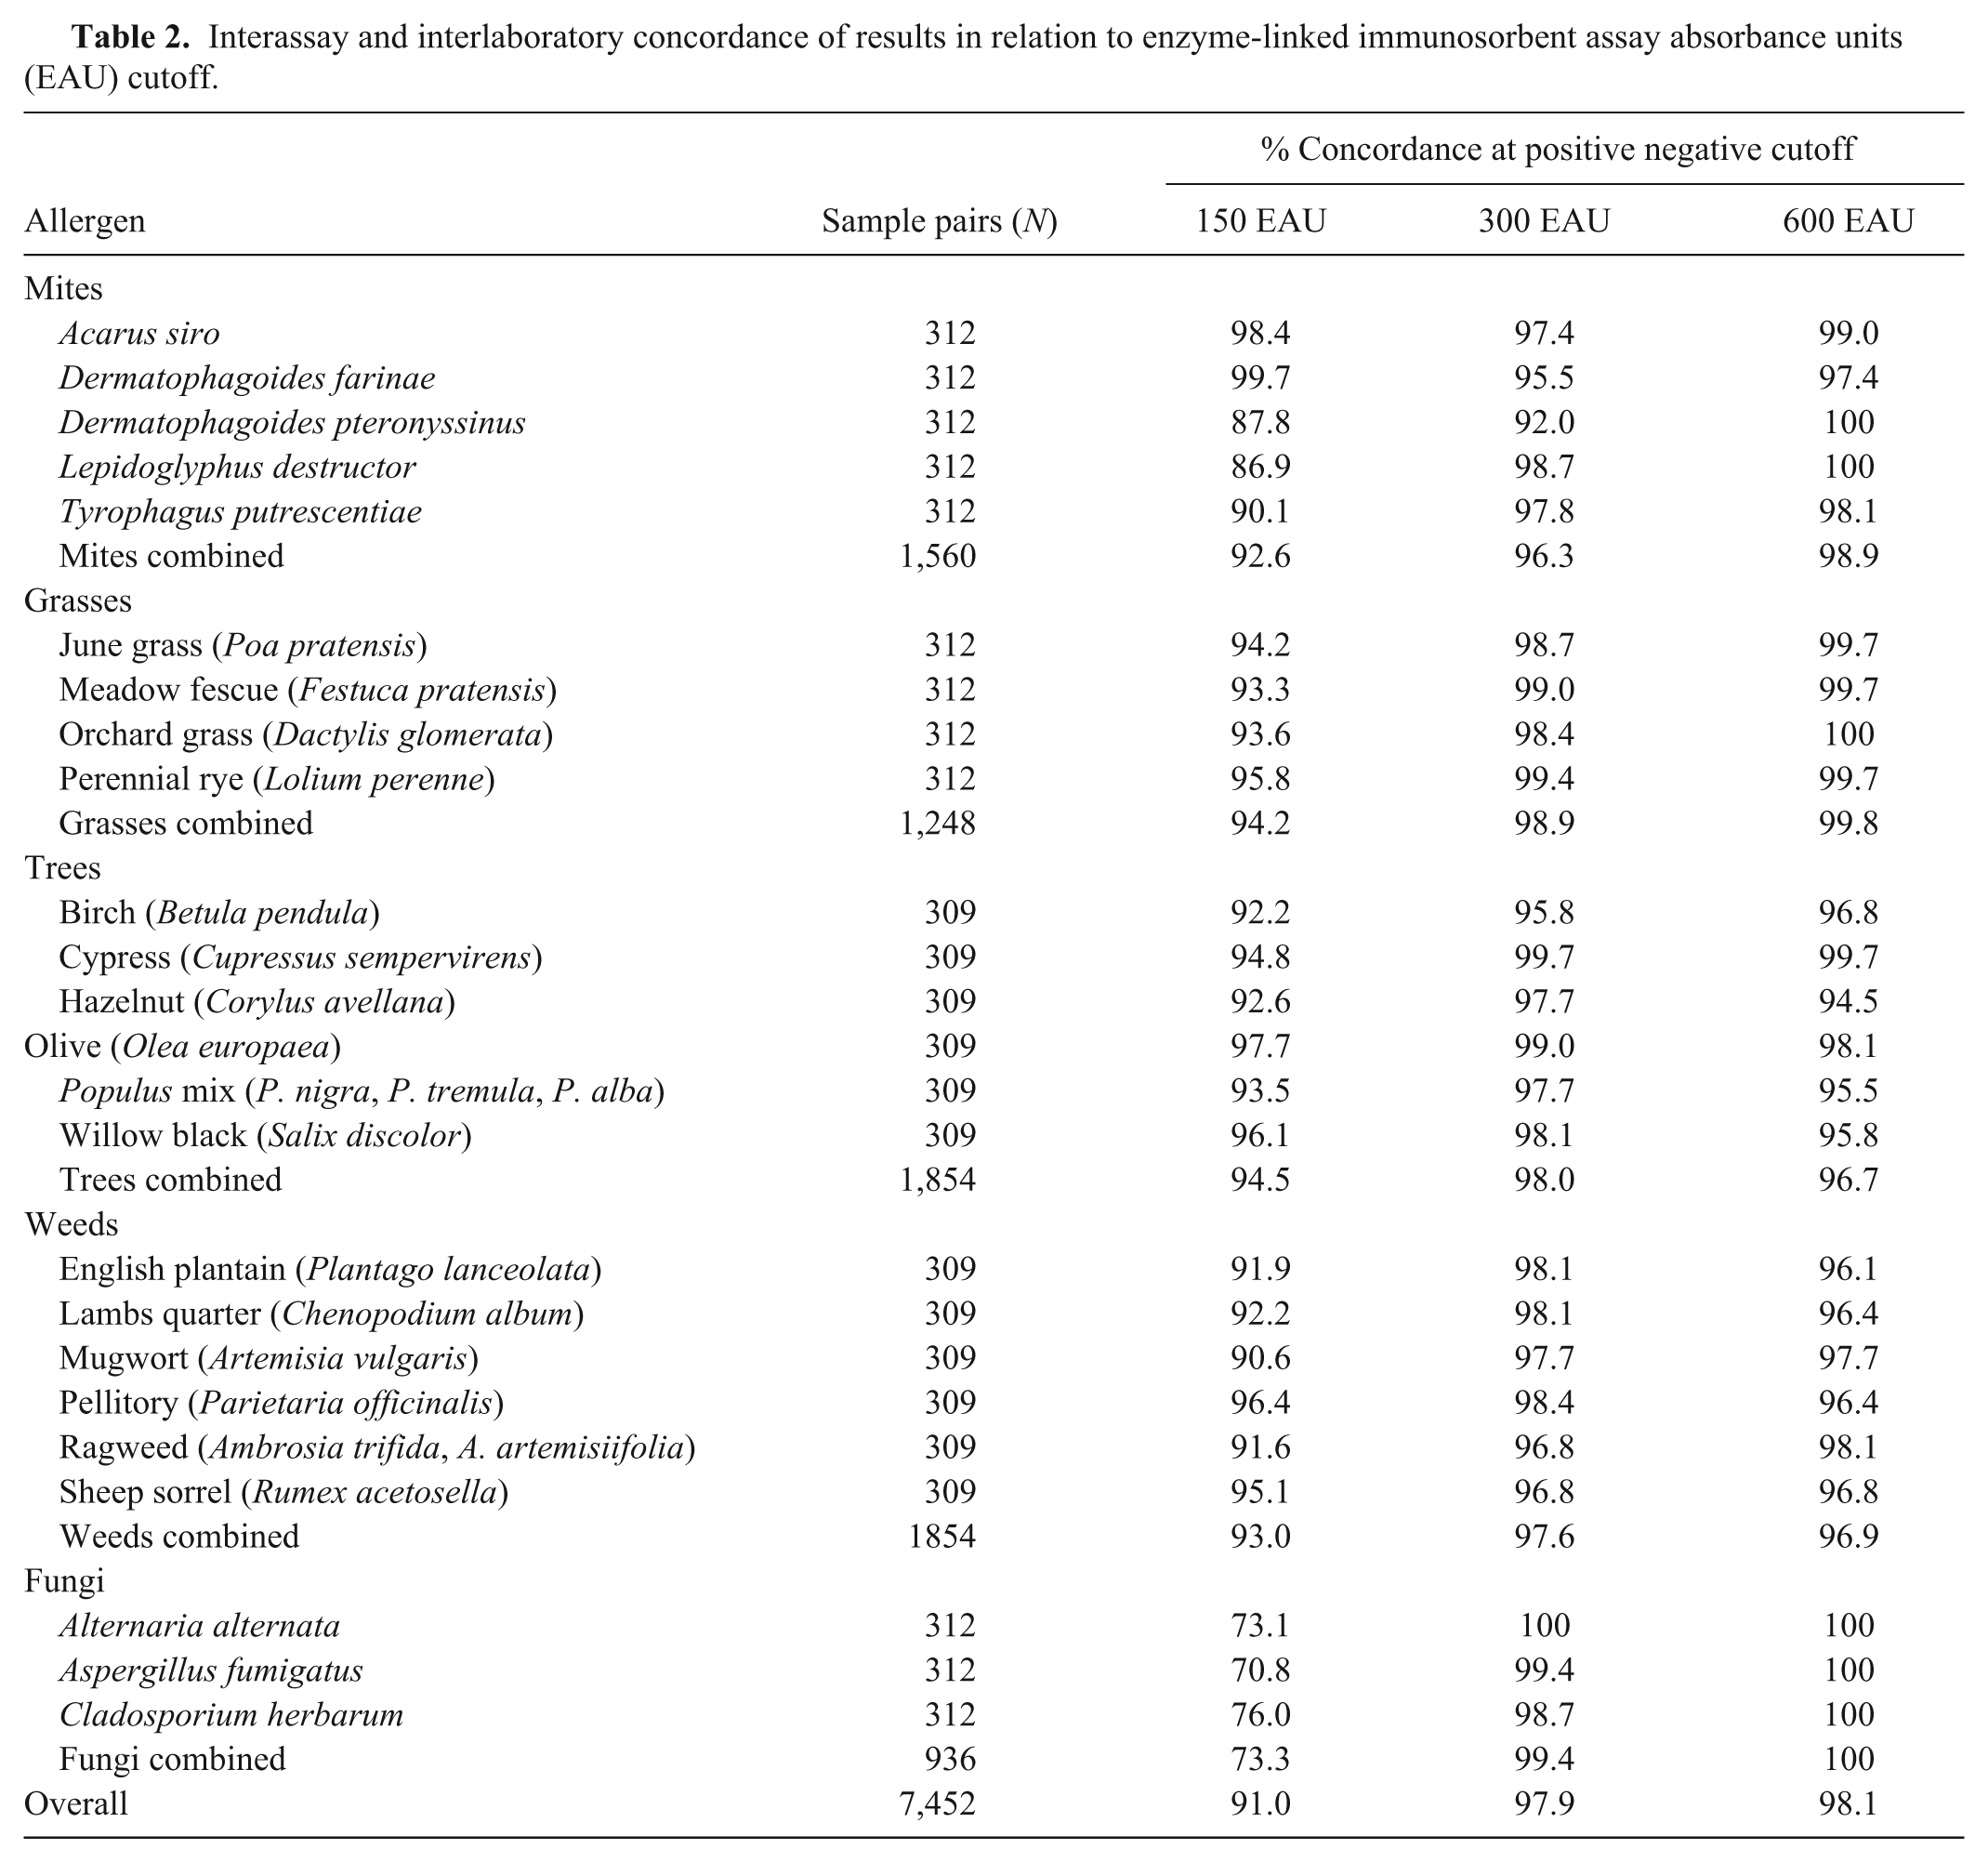
Increasing the positive–negative cutoff level to 300 EAU or 600 EAU appreciably increased the concordance of observed results. The overall average interassay interlaboratory concordance of results at a cutoff of 300 EAU was 97.9% (range: 92.0–100%), while the observed concordance at a cutoff of 600 EAU was 98.1% (range: 94.5–100%). The average interassay intralaboratory concordance of results was demonstrated to be 97.9% (range: 92.0–100%) at a cutoff of 300 EAU and 98.1% (range: 94.5–100%) when 600 EAU was the positive–negative cutoff determinant.
Although the degree of correlation with the fungal allergens was strong, for most cases the interlaboratory responses did not approach the excellent correlation that was evident for the pollen and mite allergens. The magnitude of responses for many of responses for Alternaria alternata, Aspergillus fumigatus, and Cladosporium herbarum was less than the positive–negative cutoff of 150 EAU. The magnitude of response for the remaining samples was in excess of 150 EAU; however, the maximum positive signal evident with any of the fungi replicates was 363 EAU. Overall, 76 samples were identified as negative and 109 samples were characterized as reactive to the fungi in all laboratories; whereas, variable responses at or near the cutoff were identified in the 127 remaining samples. Although extensive variability is known to exist in this range of reactions, the responses evident with fungi were included in the correlation comparison of responses among laboratories.
To evaluate the strength of association with the magnitude of EAU results observed for each allergen among the different laboratories, a Pearson correlation coefficient was determined c for each laboratory pair. The results presented in Table 3 demonstrate that high interlaboratory correlation (r > 0.90; P < 0.001) is evident between the results observed in Greer’s laboratory and those observed in all of the individual IDEXX and European affiliate laboratories for all mites and pollen allergens. Similarly, there was high interlaboratory correlation (r > 0.90; P < 0.001) between and among the various IDEXX and European laboratories (Table 4) for all allergens tested.
Interlaboratory correlation of macELISA (monoclonal antibody–based enzyme-linked immunosorbent assay for detection of allergen-specific immunoglobulin E) results observed in Greer Laboratories and the results observed in the individual affiliate laboratories.
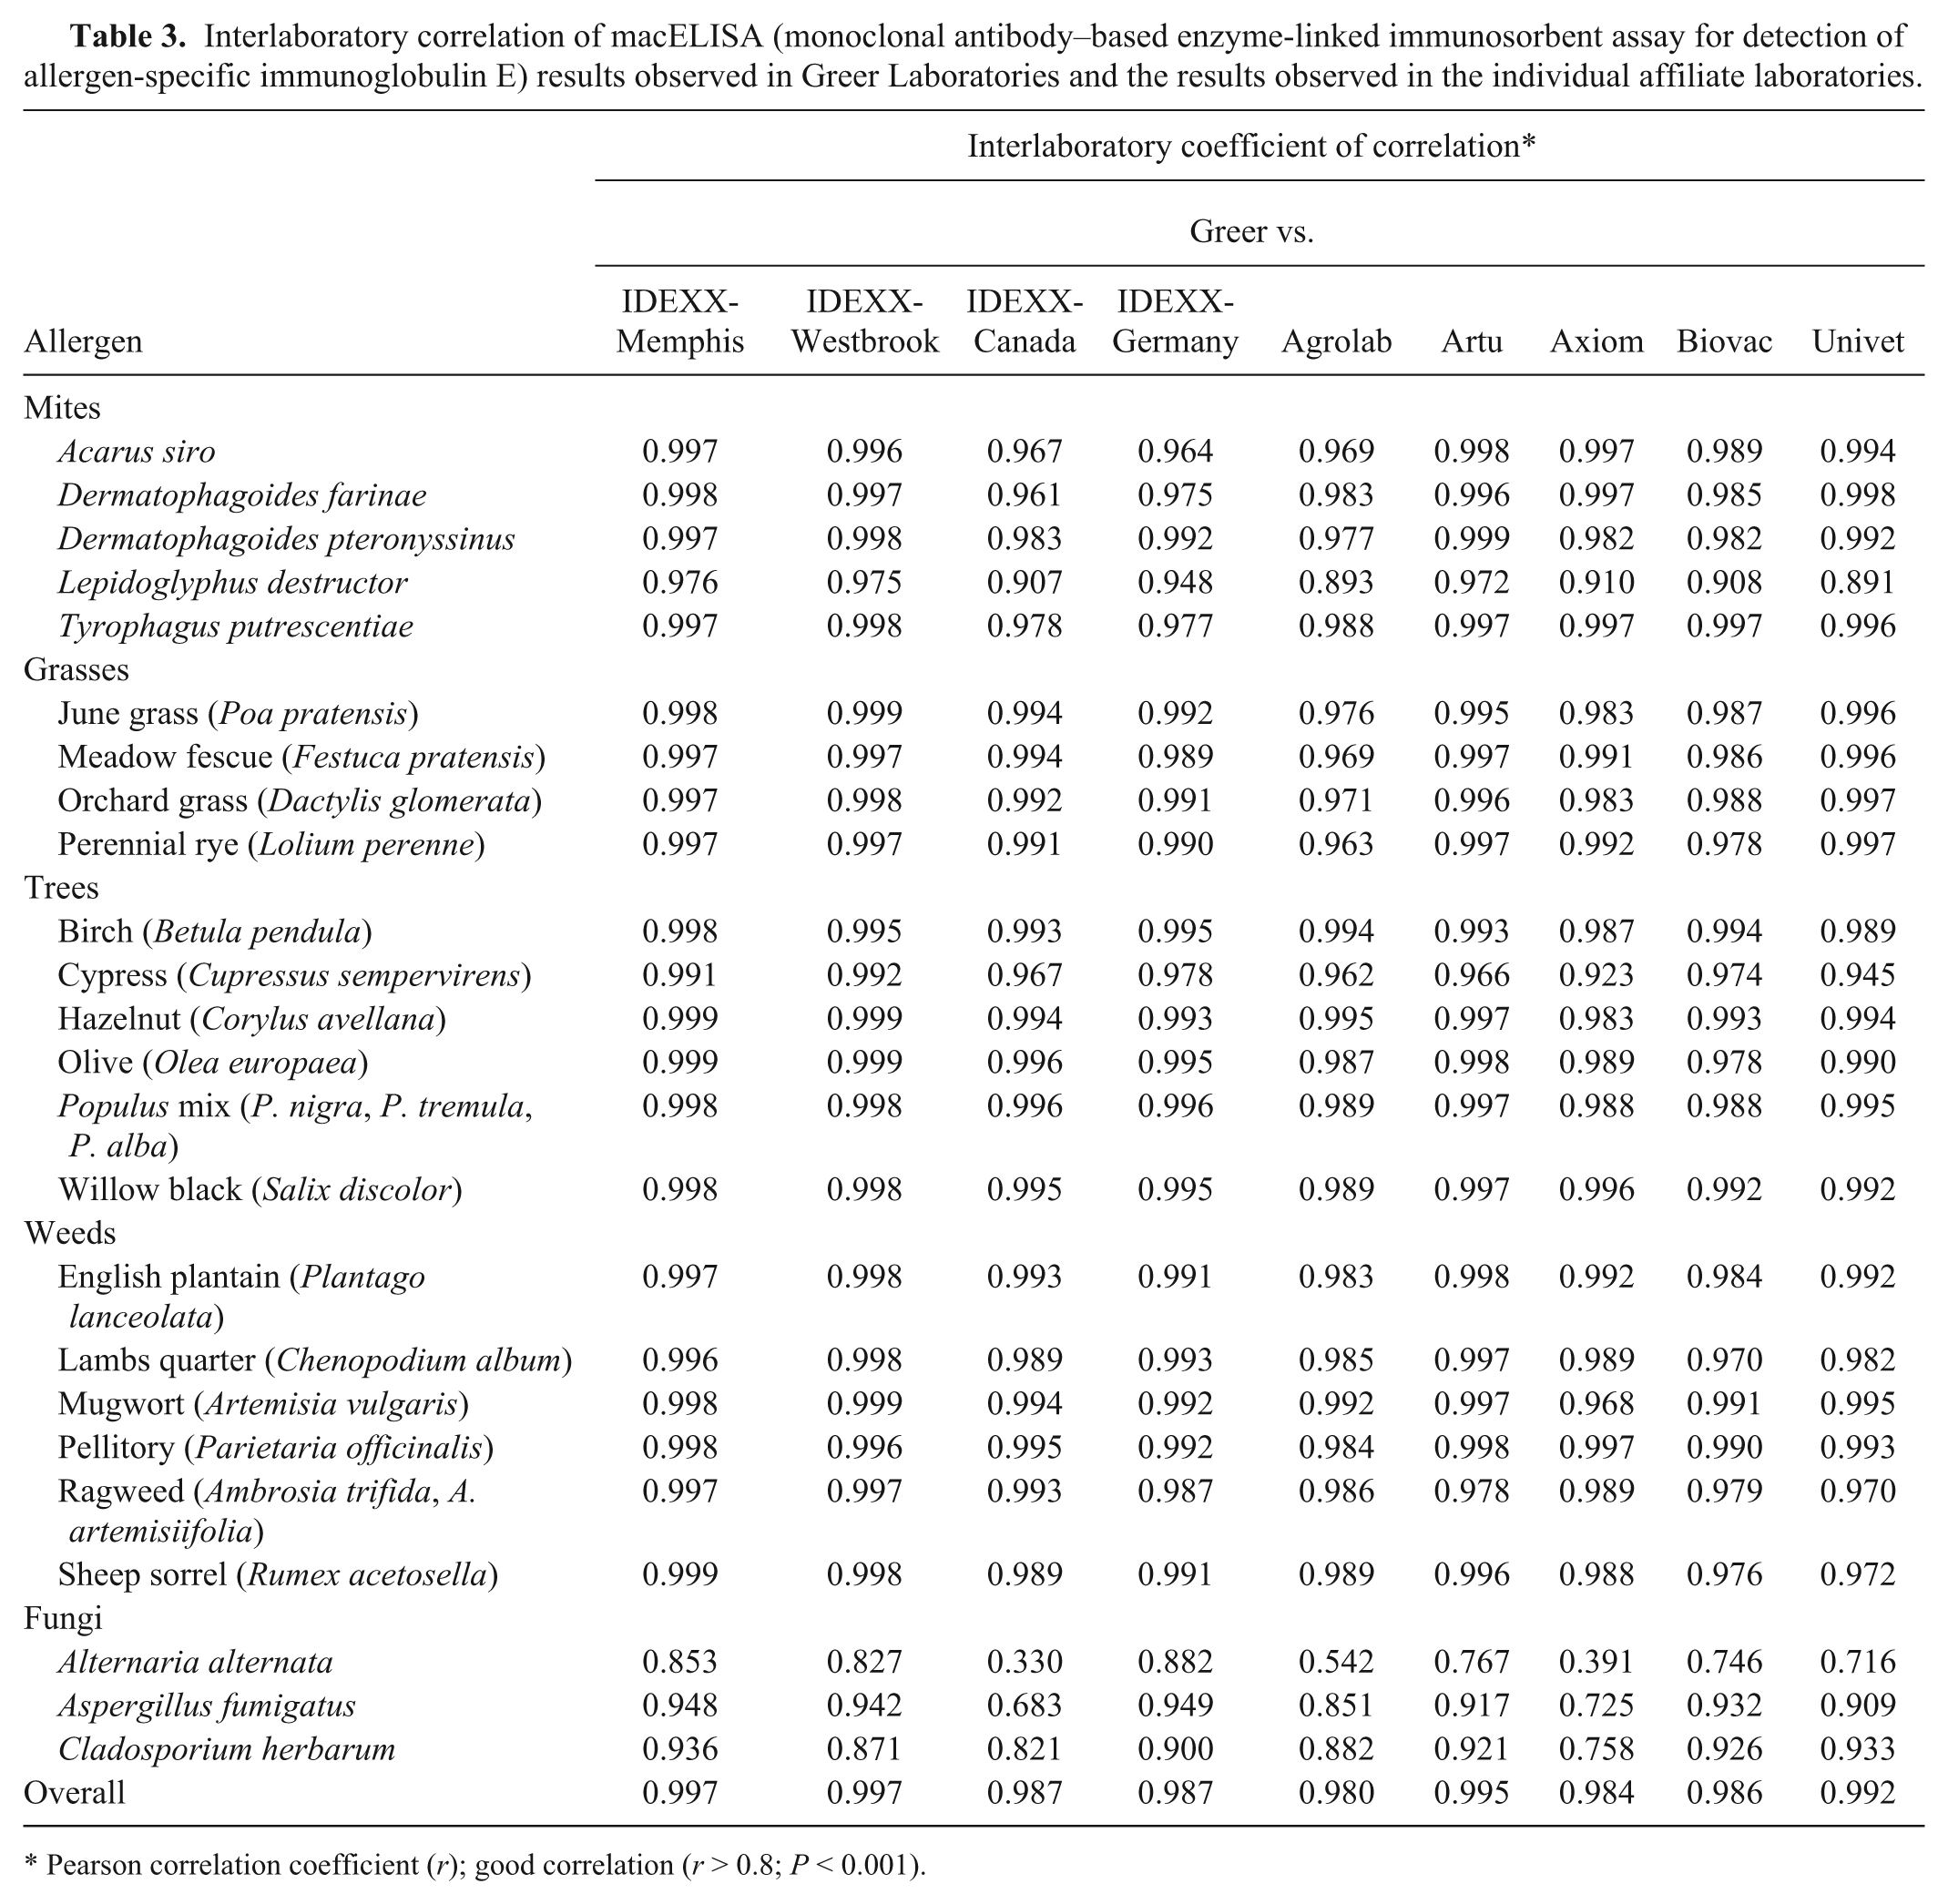
Pearson correlation coefficient (r); good correlation (r > 0.8; P < 0.001).
Interlaboratory correlation of macELISA (monoclonal antibody–based enzyme-linked immunosorbent assay for detection of allergen-specific immunoglobulin E) results observed among individual affiliate laboratories.
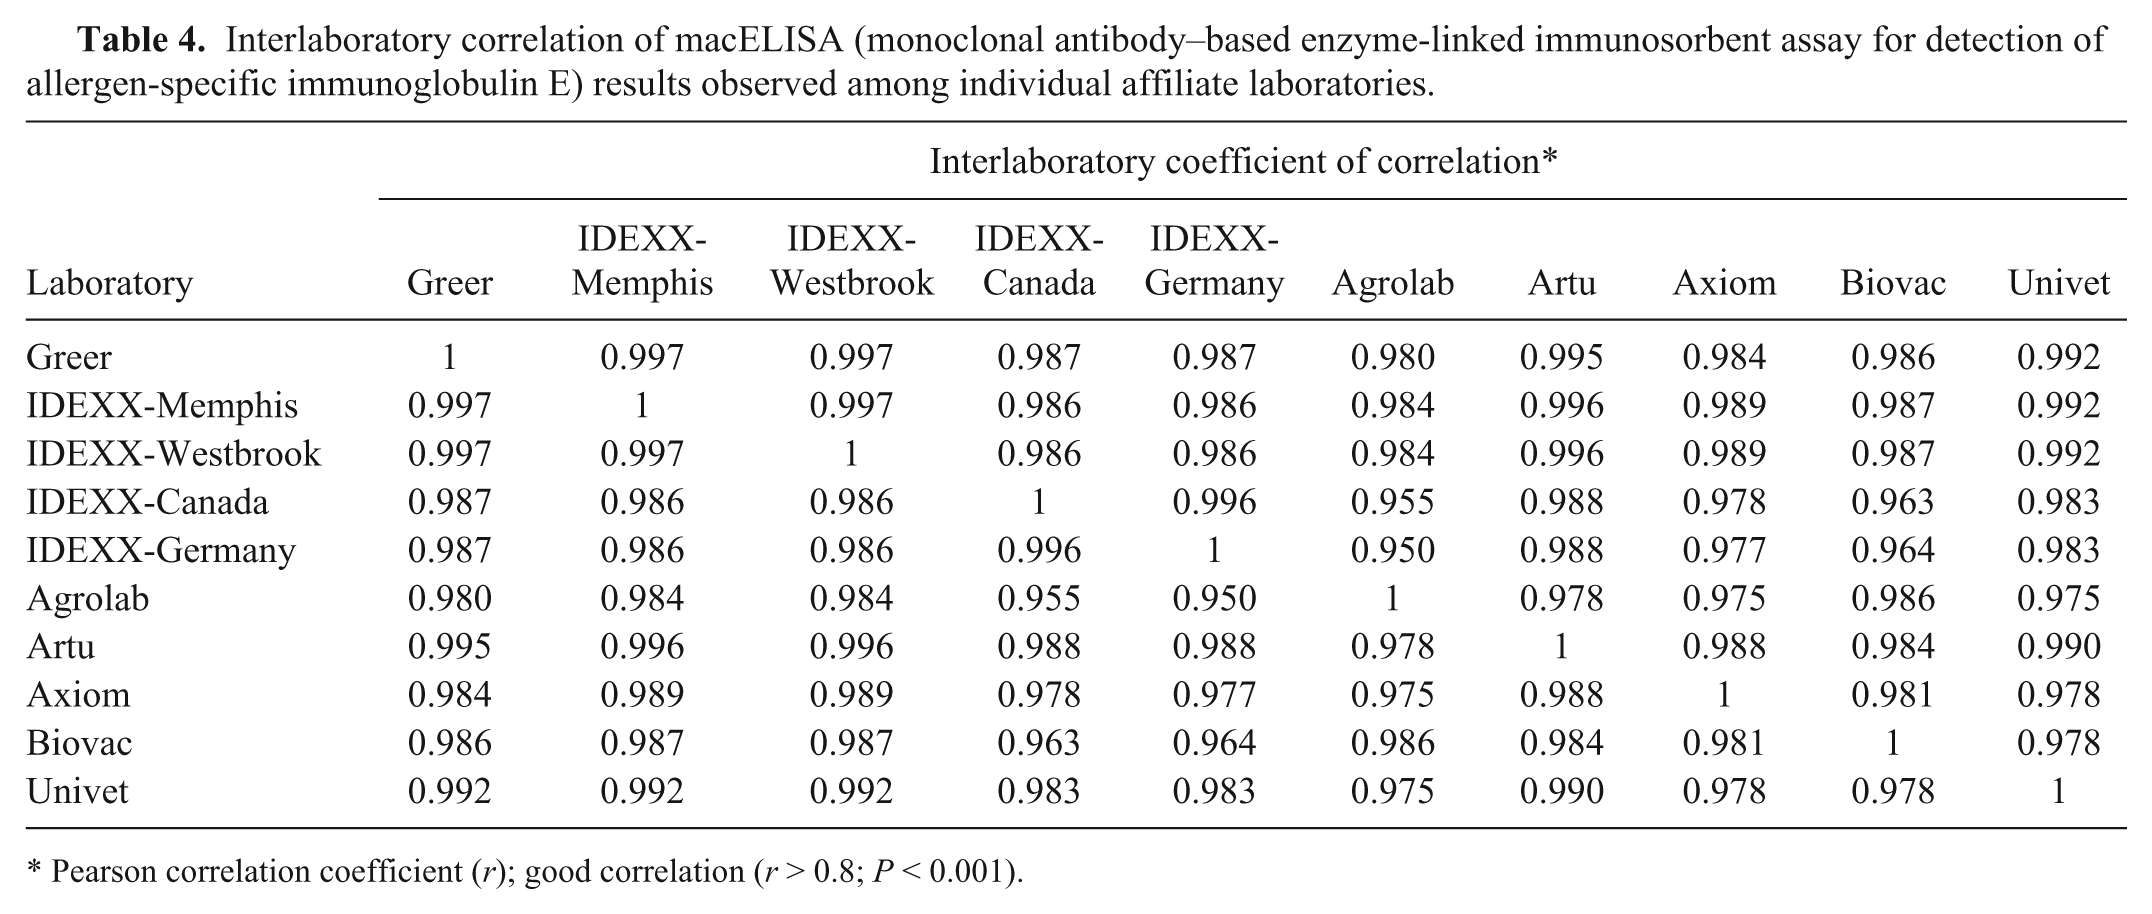
Pearson correlation coefficient (r); good correlation (r > 0.8; P < 0.001).
The final comparative evaluation for the proficiency monitoring of the various laboratories was an evaluation of the dose response that is evident in macELISA. For this evaluation, 3-fold serial dilutions of a highly reactive pollen pan-reactive sample as well as a moderately reactive sample were prepared using negative sera as diluent. Each of the dilutions was then evaluated in each of the participating laboratories as unknown independent samples. Similar responses were yielded by all of the laboratories, and the results observed within the various laboratories are encompassed by the acceptable variance limits 8 (±20%) established for macELISA. Furthermore, the magnitude of responses observed in each laboratory was reduced in direct proportion to dilution. The dose response curve that is observed in each laboratory approximates a second order polynomial function (i.e., quadratic), which is consistent with the expected reactivity profile for assays of this type. 15 Consequently, data from all laboratories were treated as a single population of responses; the resultant comparative dose response of macELISA observed with differing pollen allergens and the various sera dilutions are presented in Figure 1. The reaction profiles for specific IgE detected for the various pollen allergens present in the highly reactive sample are presented Figure 1, panels A–C, while the IgE reaction profile for the moderately reactive sample is presented in panels D–F. The responses of greatest magnitude with both sera pools were evident with the grass pollen allergens, and these responses were reduced in direct proportion to dilution; the magnitude of responses ranged from near maximum to those that were indistinguishable from background responses. The response profiles for the grasses are not only parallel, but they also appear to be nearly identical. Whether or not these like responses result because of a similar level of cosensitization or allergen epitope similarity combined with cross-reaction remains to be determined. Although the responses evident to tree and weed allergens are more variable in magnitude of response, the observed response in each laboratory was reduced in direct proportion to dilution. The positive response profiles evident with these allergens also appear to be consistent with responses that might be expected for ELISA, and, with appropriate dilution, the magnitude of response will reach extinction.
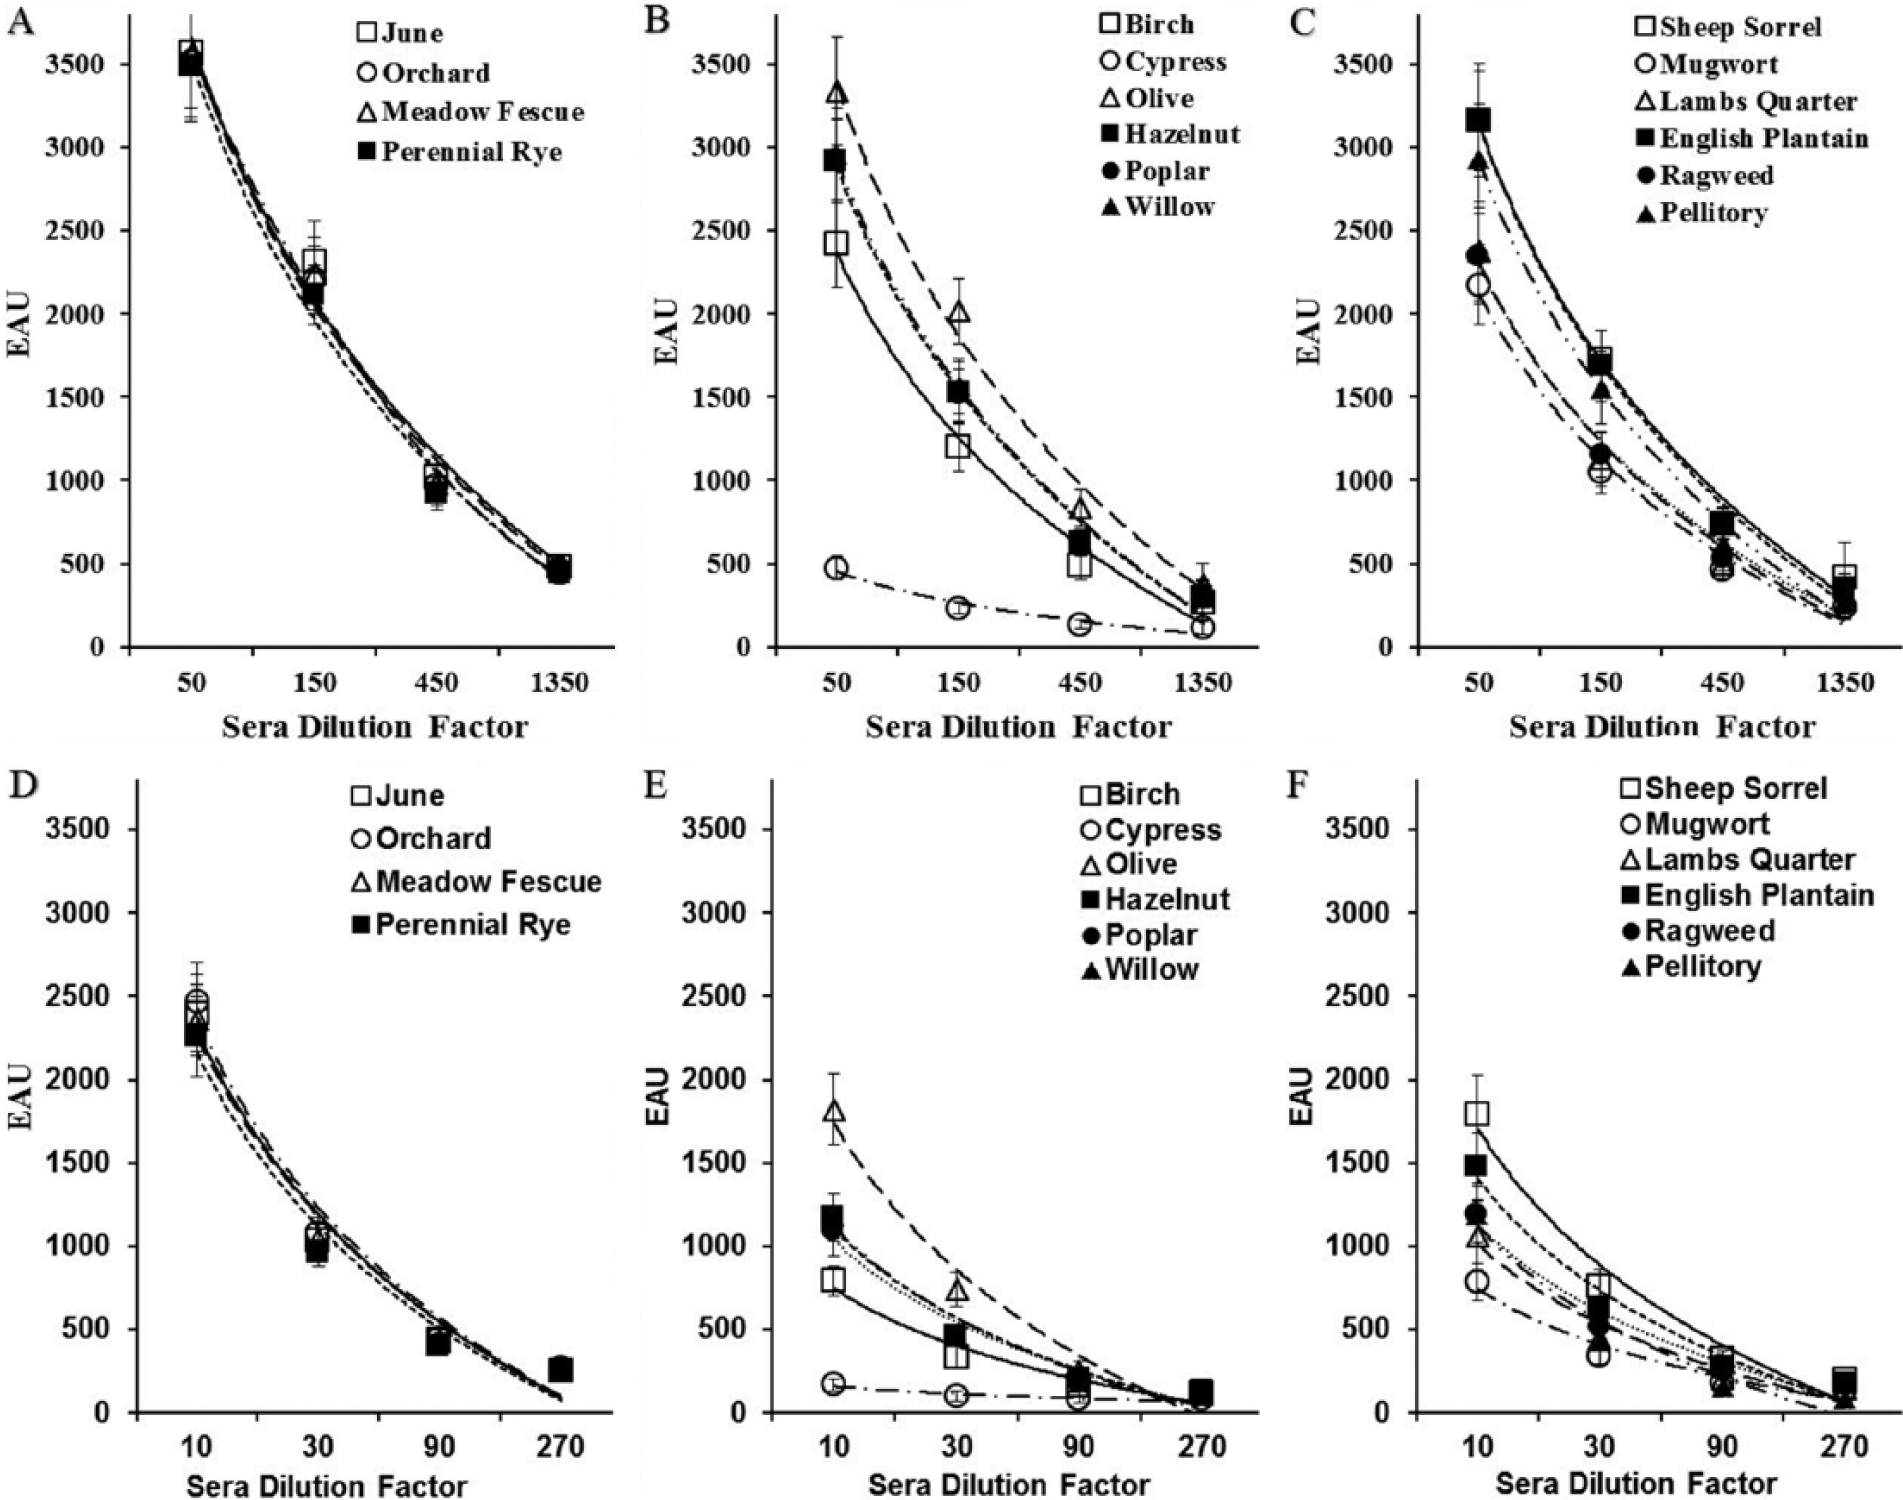
Dose response evident in macELISA (monoclonal antibody–based enzyme-linked immunosorbent assay for detection of allergen-specific immunoglobulin E) with a sera pool highly reactive (
Discussion
The results of the present study demonstrate that the variability between and among all laboratories is indistinguishable from the results evident within and between runs completed in Greer’s laboratory. The results presented herein demonstrate that all laboratories are equally proficient in providing consistent results for all allergens tested. The intra-assay variance observed with the positive calibrators evident among the various runs within each of the laboratories remains relatively low and indistinguishable among the various laboratories (Table 1). Likewise, the interassay variance within each laboratory remained relatively constant, and the results from all laboratories were demonstrably similar; the CV of the positive responses was relatively constant across the entire range of reactivity tested. Consequently, the observed interlaboratory CV was well within the acceptable variance limits (±20%) established for this assay. 11 The variability of background and negative sera responses, in contrast, was substantially greater. The increased variability with the negative responses emphasizes the need to establish an appropriate and robust cutoff for each assay. For the macELISA, a cutoff of 150 EAU establishes 99% confidence for positive responses.
Differentiating between positive and negative responses provides the basis for the inclusion of a particular allergen extract in an immunotherapeutic regimen.2,5,10 Using 150 EAU as the positive–negative determinants, the overall interlaboratory concordance of results for grasses, trees, and weeds was 94.2%, 94.5%, and 93.0%, respectively. These results are consistent within and among laboratories as well as with previously defined observations. 8 Increasing the cutoff to a greater level of certainty for detecting positive responses concomitantly increases the concordance of results observed in all laboratories. However, establishing an absolute cutoff at any level within a dynamic range of possible responses will undoubtedly lead to discrepant results, not only between, but within laboratories as well. Such will happen because of the variance that might occur at any given point in the response curve; even slight variances could result in discordant results. Thus, a better evaluation would be the correlation of results observed in and between laboratories. Using Pearson correlation statistic, we have demonstrated excellent strength of association with magnitude of responses observed in Greer’s laboratory and the responses observed in all participating laboratories (Table 3). This excellent correlation of results is also evident between and among all laboratories for all allergens except fungi (Table 4). Lack of correlation with the responses evident with the fungal allergens is likely a consequence of the vast majority of responses falling within the negative range (<150 EAU), and no response to any fungi exceeded 363 EAU. Because the variance within this range of the response curve can be exceedingly high, the results do not lend themselves well to comparative evaluations and further exemplifies the futility in evaluating the significance of differences in responses in this range of the response curve. 9
There is no compelling evidence that the level of allergen-specific IgE correlates with severity of clinical disease. 2 However, an evaluation that purports to measure allergen-specific IgE should have a reduction in signal that is directly proportional to the dilution factor of the test ligand. 15 In assessing the dose response curves evident in macELISA, it becomes apparent that a 3-fold dilution of serum results in an approximate 2-fold reduction in signals generated. Furthermore, it becomes evident that the detectability of allergen-specific IgE spans at least a 150-fold dilution range. This being the case, it seems unlikely that a highly reactive serum sample will be detected as nonreactive at a 1:6 dilution. The variance evident in the 0–300 EAU range of responses dictates that true borderline positive samples might be identified as false-negative responses and that this tendency might compound the likelihood of false-negative responses. However, a serum sample at a 1:6 dilution makes detection of false positive-results seem rather remote.
The results presented in our report document the continuing proficiency of 10 separate laboratories that use Greer’s macELISA for detection of allergen-specific IgE in dogs. The results of the present study demonstrate that the variability between and among all laboratories and technicians are indistinguishable from the results evident within and between runs completed in Greer’s laboratory. The 2014 annual proficiency evaluation encompassed 5 European and 5 North American laboratories. Importantly, 4 IDEXX Reference Laboratories participated in this intra- and interlaboratory standardization program designed to ensure the uniformity, consistency, and reproducibility of results reported among different laboratories that perform the same testing services. Because IDEXX commenced running macELISA, proficiency evaluations have been completed on a semiannual basis in each laboratory; results from all of these evaluations (data not shown) have been reproducibly consistent with the results present herein.
An industry-wide voluntary quality assurance program for serum allergen–specific IgE testing that independently monitors performance of all laboratories and assay formats is lacking. But, the various parameters evaluated herein might serve as a prototype proficiency monitoring program among all veterinary laboratories. Until such an external and independent quality assurance program for testing of serum allergen–specific IgE is undertaken, individual laboratory studies of the sort reported herein combined with independent peer-reviewed studies will be the only means of verifying and documenting the continued reliability of test results.
Footnotes
Acknowledgements
We thank Drs. Jack Kelly and Terrance Coyne for their critical review of the manuscript.
Authors’ contributions
KW Lee contributed to conception and design of the study; contributed to acquisition, analysis, and interpretation of data; and drafted the manuscript. J Buch contributed to acquisition and analysis of data. K Blankenship, B McKinney, G Kern, J Greenwood, P Brazis, L Drouet, C Tambone, R Faas, and G Weaver contributed to acquisition of data. All authors gave final approval and agree to be accountable for all aspects of the work in ensuring that questions relating to the accuracy or integrity of any part of the work are appropriately investigated and resolved.
a.
Immulon 4HBH, Thermo Electron Corp., Waltham, MA.
b.
Moss Substrates, Pasadena, MD.
c.
Excel (2007), Microsoft Corp., Redmond, WA.
Declaration of conflicting interests
The author(s) declared the following potential conflicts of interest with respect to the research, authorship, and/or publication of this article: All authors from Greer Laboratories are employees at Greer Laboratories Inc.; other authors are employees of the affiliate laboratories.
Funding
The author(s) disclosed receipt of the following financial support for the research, authorship, and/or publication of this article: Funding for this study was provided by Greer Laboratories Inc.