
Abstract
A study was performed to investigate interlaboratory test agreement between a research and a commercial veterinary diagnostic laboratory on blood and urine samples, and to investigate test agreement between blood, urine, and kidney samples (research laboratory) for leptospirosis diagnosis. Samples were sourced from 399 sheep and 146 beef cattle from a local abattoir. Interlaboratory agreement for real-time quantitative polymerase chain reaction (qPCR) results on urine samples was almost perfect (kappa = 0.90), despite the use of different amplification targets (DNA gyrase subunit B gene vs. 16s ribosomal RNA gene), chemistries (SYTO9 vs. TaqMan probe), and pre-PCR processing. Interlaboratory agreement for microscopic agglutination test (MAT) positivity was almost perfect (kappa = 0.93) for Leptospira borgpetersenii serovar Hardjo subtype Hardjobovis (Hardjobovis) but moderate (kappa = 0.53) for Leptospira interrogans serovar Pomona (Pomona). Among animals that had different titers recorded, higher Hardjobovis and lower Pomona titers were reported by the commercial laboratory than by the research laboratory (P < 0.005). These interlaboratory comparisons can assist researchers and diagnosticians in interpreting the sometimes discrepant test results. Within the research laboratory, the comparison of qPCR results on urine and kidney showed almost perfect agreement (kappa = 0.84), suggesting that the qPCR on these 2 specimens can be used interchangeably. The agreement between MAT positivity and urine and kidney qPCR results was fair (kappa = 0.32 and kappa = 0.33, respectively). However, the prevalence ratio of urine and kidney qPCR positivity in Hardjobovis-seropositive versus Hardjobovis-seronegative sheep indicated that Hardjobovis seropositivity found in sheep may be able to predict shedding or renal carriage.
Keywords
Introduction
Leptospirosis, caused by pathogenic spirochetes of the genus Leptospira, is a zoonotic disease of global distribution that has significant impacts on public health and livestock production.1,29 Infection with pathogenic leptospires causes economic losses in the cattle and sheep industries due to reproductive failure (abortions, stillbirths, and neonatal mortalities) and decreased milk production.16,28,41 In addition, infected animals can develop chronic renal infection and excrete the organisms in the urine, disseminating leptospires to other animals and constituting a potential zoonotic threat to those engaged in animal production and related industries.22,34 More than 200 serovars of pathogenic Leptospira, within 20 species of leptospires, have been isolated and described worldwide.6,10
In New Zealand, leptospirosis is the most common occupationally acquired zoonotic disease and is associated mainly with meat and agricultural workers. 50 Cattle, sheep, and farmed deer are important animal reservoirs in New Zealand.4,14,35 Surveys of farms and abattoirs have shown that up to 97% of beef cattle herds (Dreyfus A: 2013, Leptospirosis in humans and pastoral livestock in New Zealand. PhD thesis, Massey University, Palmerston North, New Zealand), 44% of sheep lines, 14 and 81% of deer herds 4 have been exposed to leptospires. Among 6 serovars within 2 species (Leptospira borgpetersenii and Leptospira interrogans) that have been isolated from animals in New Zealand, serological evidence of leptospirosis in domestic livestock is most commonly associated with L. borgpetersenii serovar Hardjo subtype Hardjobovis (Hardjobovis) and L. interrogans serovar Pomona (Pomona).3,7
Laboratory diagnosis of leptospirosis is based on direct examination of clinical specimens for organisms, isolating the organism, detecting anti-leptospiral antibodies through serological testing, or detecting the DNA of the organism through molecular methods. 6 The microscopic agglutination test (MAT) is regarded internationally as the reference test for the serological diagnosis of leptospirosis. 29 However, this test does not recognize the presence of leptospires, and therefore does not directly indicate active infection or reflect the carrier or shedding status of the host.34,49 The MAT cannot discriminate between natural infection- and vaccination-induced antibodies. 1 Also, positive results can be obtained due to cross-reactivity between closely related serovars. 29 In addition, it is well-known that different MAT results can be obtained from different laboratories, due to the source of antigen cultures, the maintenance of reference collections of Leptospira strains, and the subjective element of test interpretation.11,12,29 Culture has been well established as a definitive diagnosis through isolation of the bacteria from a variety of samples. 18 However, culture is laborious and time-consuming, the result is often influenced by the overgrowth of other bacterial and fungal contaminants, and some serovars (e.g., Hardjobovis) are inherently difficult to culture.13,19
Polymerase chain reaction (PCR) assays have been used since the 1990s as reliable and rapid molecular methods for the diagnosis of leptospirosis. There is evidence that PCRs are more sensitive than conventional tests such as culture.9,53 Polymerase chain reaction may be especially useful when the immune response of the maintenance host to the infecting serovar is poor (e.g., MAT sensitivity is suboptimal for detecting Hardjo infection in cattle). 40 The PCR assays have been used successfully to detect Leptospira spp. in clinical specimens, such as bovine urine and semen,26,51 and urine, vaginal fluids, and semen of goats and sheep.32,33 Real-time quantitative PCR (qPCR) has improved the diagnosis of leptospirosis compared with conventional PCR, as it is less prone to carry-over contamination and is time-saving due to the redundancy of gel electrophoresis.2,44 The qPCR assays targeted at different genes have been used to detect leptospires from reference strains and clinical isolates of human sources; genes include rrs (16s),37,45 secY, 2 gyrB, 44 rpoB, 27 and lipL32. 30 However, there are limited reports of studies of qPCR assays for detecting leptospires in clinical specimens from animals. A qPCR assay based on a previously described assay 44 has been developed and validated in the Hopkirk Leptospirosis Research Laboratory, Molecular Epidemiology and Veterinary Public Health Laboratory, Hopkirk Research Institute, Massey University, Palmerston North, New Zealand (HLRL), using urine and kidney samples from deer in New Zealand. 46 This assay has successfully detected serovars Hardjobovis and Pomona in deer. Gribbles Veterinary Pathology, Palmerston North, New Zealand (GV), has also developed a qPCR assay based on 2 previously described assays,43,45 which can be used as a screening test for leptospirosis in animals.
It is common for researchers to compare results between studies, with limited regard to possible interlaboratory variation that may confound those comparisons. Interlaboratory variation has been demonstrated for diagnosing different diseases. For example, an interlaboratory comparison of enzyme-linked immunosorbent assays for detecting Salmonella enterica serotype Enteritidis in chickens was conducted in 14 laboratories, with a variety of antigens being used. This comparison demonstrated good agreement on the interpretation of optical density readings of high and low titer sera, but differences in the interpretation of medium titer sera. 5 A study was performed on epithelial specimens to investigate the interlaboratory comparison of qPCR assays and cultures that were routinely performed in 5 European laboratories for foot-and-mouth disease. Comparable results for qPCR assays, but variable sensitivity for cultures across laboratories, were demonstrated in this study. 20 Knowledge of likely between-laboratory differences can contribute to more meaningful comparison of studies determining the prevalence and incidence of diseases. However, few published studies have investigated interlaboratory agreement of serological12,38 or PCR tests for leptospirosis in order to allow laboratory variation to be factored into conclusions.
The primary purpose of this study was to quantify and improve the understanding of the contribution that interlaboratory variation may have in explaining differences in results of studies when different laboratories undertake sample testing. This was done by comparing tests for leptospirosis between our research laboratory (HLRL) and a nearby commercial veterinary diagnostic laboratory (GV), using samples from sheep and beef cattle. The interlaboratory comparisons included qPCR assays on urine samples and MATs on serum samples. Additionally, this research allowed comparisons between different tests on different samples at HLRL, namely qPCR on urine and kidney, and between qPCR on both kidney and urine samples and MAT (both positivity and titers). This enhances understanding of predictive relationships between tests on different specimens for diagnostic and epidemiological purposes.
Materials and methods
Study design
The current study used urine, blood, and kidney samples from a sheep and beef cattle abattoir cross-sectional study. Samples were collected from an abattoir in the Waikato area by AgResearch Ltd. staff wearing personal protective equipment (PPE).
Coagulated blood samples were collected in 2 plain 10-ml blood tubes a from each animal at slaughter. Urine samples were collected by direct bladder puncture into two 8-ml plain blood tubes. b The entire right kidney was collected from each sheep carcass, while 1 wedge (extending from the renal cortex to the medulla) from the right kidney was collected from each beef cattle carcass. The capsule of each kidney sample was removed, and the sample was placed into a 500-ml container. c The coagulated blood samples were centrifuged shortly after collection at 1,300 × g for 10 min at the AgResearch Ltd. Laboratory, and the sera were collected. All samples were sent under refrigerated conditions to GV on the day of collection. One set of the serum and urine samples was retained by GV while the other set, plus the kidney samples, were sent to HLRL. Collection and processing of samples was undertaken in a sterile manner to avoid cross-contamination. All serum samples were MAT tested at GV and HLRL, while qPCR assays were conducted in HLRL and GV as described in Figure 1. If positive urine or kidney qPCR results were received from either HLRL or GV, culture was initiated on kidneys at HLRL primarily to provide isolates for multilocus sequence typing.
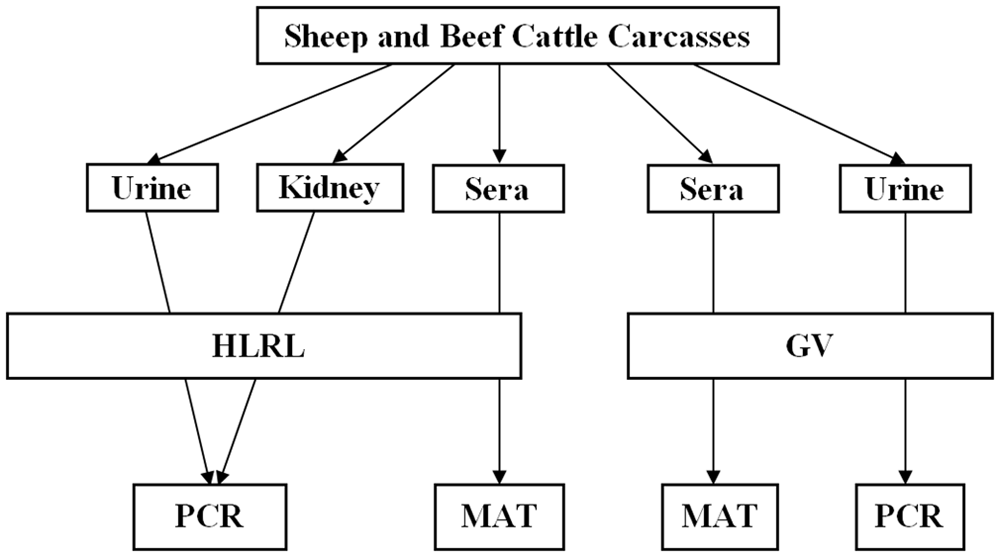
Flowchart showing sampling and testing procedure.
The sample size needed to produce robust agreement evaluation (kappa statistic inter-rater reliability) was calculated, given a relative error of 0.2 and the difference between the observed agreement and expected agreement of 0.5 (anticipating the tests will agree about 50% of the time). 24 The number of animals slaughtered at the abattoir during the 9-week sampling period was 7,065 sheep and 162 beef cattle. The minimum number of samples required for calculating test agreements was 99 for sheep and 62 for cattle.
Real-time quantitative PCR
DNA extraction
For HLRL, urine and kidney samples were processed on receipt, usually the day following collection. For GV, urine samples were stored at 4°C, and processed within a week based on laboratory capacity.
Urine samples (HLRL).—A 1.2-ml urine sample was aliquoted into a 1.5-ml Eppendorf tube, d and then centrifuged at 10,625 × g for 20 min. Supernatant was discarded, and 200 μl of phosphate buffered saline (PBS) was used to resuspend the pellet. This mixture was used to extract DNA using a commercial kit e as per manufacturer’s instructions. DNA was eluted in a final volume of 200 μl of elution buffer.
Urine samples (GV).—A 200-μl urine sample was used for DNA extraction using a commercial kit f as per manufacturer’s instructions. DNA was eluted in a final volume of 200 µl of elution buffer.
Kidney samples (HLRL).—Kidney surfaces were sterilized by swabbing with 70% ethyl alcohol. A 10-g section of kidney, extending from the renal cortex to the medulla, was removed aseptically. The removed section was washed with 70% ethyl alcohol using funnel and flask, followed by flaming with a Bunsen burner. It was then homogenized in 50 ml of PBS, using a stomacher. g A 160-μl aliquot of this suspension was used to extract DNA, using a commercial kit h as per manufacturer’s instructions. DNA was eluted in a final volume of 200 μl of elution buffer.
DNA amplification
HLRL
—The qPCR assay was based on a previously developed assay in the HLRL 46 and modified to suit a real-time genetic analyzer. i Green-fluorescent nucleic acid stain SYTO9 j was used as the intercalating dye. Primers 2For (5′-TGAGCCAAGAAGAAACAAGCTACA-3′) and 504Rev (5′-MATGGTTCCRCTTTCCGAAGA-3′) were used to amplify the gyrB gene. The 25-µl reaction mix included 2.5 μM SYTO9, j 1× PCR buffer, 1.5 mM magnesium chloride (MgCl2), 200 μM deoxyribonucleotide triphosphates, 5 pmol of 2For and 504Rev, 1 unit of Taq DNA polymerase, k 2 μl of DNA extract, and double-distilled water (ddH2O). Thermal cycling comprised initial denaturation at 95°C for 10 min, followed by 40 cycles of 95°C for 10 sec, 63°C for 20 sec, and extension at 72°C for 20 sec. Fluorescence readings were taken at the end of each extension cycle in the F1 (SYBR Green) channel. Melting curve analysis was performed by heating the PCR product from 78°C to 90°C and monitoring the fluorescence change every 0.2°C. Positive controls were serovars Hardjobovis and Pomona (HLRL laboratory strains), and ddH2O was used as the negative control. Samples were considered positive if a similar melting temperature as positive controls was recorded.
GV
—The qPCR assay was based on 2 previously prescribed assays,43,45 and modified to suit a real-time genetic analyzer. l Each 25-μl PCR reaction contained 12.5 μl of the PCR master mix, m 0.4 mM each of the forward primer (5′-CCCGCGTCCGATTAG-3′), reverse primer (5′-TCCATTTGGCCGRACAC-3′), and the 6-carboxyfluorescein–labeled (FAM) black hole quencher 1 (BHQ1) quenched TaqMan probe (5′-CTCACCAAGGCGACGATCGGTAGC-3′), n 5 μl of DNA template, and RNase/DNase-free water to 25 μl. Thermal cycling comprised initial denaturation at 95°C for 15 min, followed by 50 cycles of denaturation at 95°C for 20 sec, and annealing and extension at 60°C for 30 sec. Fluorescent data acquisition was performed at the end of each extension cycle. Positive samples were defined as having a threshold cycle (Ct) value less or equal to 36 cycles. Positive controls were serovar Tarassovi (GV laboratory strain), and ddH2O was used as the negative control. Negative samples were defined as having a Ct value >40 cycles. Samples with Ct value >36 to ≤40 were defined as being “suspect” positive.
Microscopic agglutination test
The standard storage of sera was the same for both laboratories, being at 4°C for 1 week or at −20°C for longer periods. A titer of ≥48 for MAT-HLRL and ≥50 for MAT-GV was considered positive for both serovars, based on previous studies of leptospirosis in sheep and cattle.7,47
HLRL
Thirty microliters of each serum sample was mixed with 150 μl of standard saline to make a 1:6 dilution. The MAT was performed by the same observer against serovars Hardjobovis and Pomona (HLRL laboratory strains) based on the standard procedure. 17 The antigens used for MAT were 4–14-day-old cultures of Hardjobovis and Pomona containing approximately 1–2 × 10⁸ organisms/ml (as determined by the McFarland scale). Eight, 2-fold serial dilutions of serum in standard saline covering the range from 1:24 to 1:3,072 were prepared in a 96-well plate. o A plate containing the 25 µl of standard antiserum (sera) and standard saline, respectively, with 25 µl of saline was prepared in the same manner as a positive and negative control. The plates were then placed in resealable plastic bags and incubated at 30°C for 1.5–4 hr, after which the degree of agglutination was determined by examination under a dark-field microscope. p The endpoint titer was the lowest dilution at which approximately 50% of the organisms were agglutinated.
GV
The same standard method for MAT was applied, and performed by 1 observer from GV for all of the samples. However, each serum sample was not diluted before being tested by MAT. The 2-fold serial dilutions of sera were made with Ellinghausen–McCullough–Johnson–Harris (EMJH) medium, and the serum-antigen mixtures used were from 1:50 onward. The negative control was also prepared with EMJH medium. Different sources of antigen (Hardjobovis and Pomona) and standard antiserum from HLRL were used.
Statistical analysis
Agreement between HLRL and GV urine qPCR and MAT, between HLRL urine and kidney qPCR, and between HLRL urine and kidney qPCR and MAT was evaluated using the Cohen kappa statistic 52 with Fleiss-adjusted 95% confidence intervals (95% CIs), 21 for sheep and cattle samples combined, and also independently on sheep and cattle samples. The interpretation for the kappa statistic is as follows: <0.2 slight agreement, 0.2–0.4 fair agreement, 0.4–0.6 moderate agreement, 0.6–0.8 substantial agreement, and >0.8 almost perfect agreement. 52
Logistic regression analysis was used to determine the association between the continuous variable, Ct value from GV urine qPCR, and the binary outcome (HLRL urine qPCR results). The aim of this analysis was to determine whether the agreement observed between 2 qPCR assays on urine was influenced by other factors. The Ct value was set as 50 for those samples that did not have a Ct value detected by GV urine qPCR. The confounders and interactions considered included animal species, supplier, slaughter line ID, age, and the serological result. The serological result was included in the model both as a binary outcome and as a raw titer. Variables were considered as confounding factors if the presence of variables changed the regression coefficient of the Ct value in the model by ±15%. Interactions were evaluated and considered as present if the likelihood ratio test was statistically significant (P ≤ 0.05). Variables showing a univariable association (P < 0.2) with the outcome and confounders and/or interactions were used to develop a multivariable model by a stepwise selection process retaining variables significant at the P ≤ 0.05 level. The goodness-of-fit of the model was assessed using the le Cessie–van Houwelingen normal test statistic, and the predictive ability of the model was assessed by plotting the receiver operating characteristic curve (ROC).
To investigate agreement of MAT titers between GV and HLRL, bubble plots were produced and examined. Among animals that had different titers reported from 2 laboratories (≥1 dilution difference), the null hypothesis that the probability of occurrence of higher and lower titers was equal (50%) was tested. The analysis was conducted independently on serovars (Hardjobovis and Pomona) and animal species (sheep and cattle).
To determine whether the different MAT results demonstrated from the 2 laboratories were associated with different serum sample storage times (interval between sample collection date and MAT testing date) between the 2 laboratories, linear regression models stratified by serovar were used. One model set the outcome as the difference in log MAT titers reported by 2 laboratories. A second model set the outcome as the difference in the MAT titer recorded; for example, if titer 48 was recorded from HLRL and titer 50 was recorded from GV, the titers were treated as the same, and the outcome was zero; while if titer 96 was recorded from HLRL and titer 50 from GV, there was 1 level difference, and the outcome was 1, and so on. The main-effect continuous predictor was the same in both models, as the difference in days of the serum sample storage times between 2 laboratories. Due to the non-normal distribution of intervals, the continuous variables (difference of intervals) were categorized to improve model fit. The same variable selection procedure for multivariable models and confounders and/or interactions evaluation (animal species, suppliers, slaughter line IDs) procedure as stated above in the logistic regression model were used.
Significance was declared at P ≤ 0.05. Analyses were implemented with the statistical software R 2.14.1. q
The prevalence of urine shedding and renal carriage detected by urine and kidney qPCR in seropositive and seronegative animals was calculated. The prevalence ratio was evaluated using logistic regression to determine the association between urinary shedding and carrier status of seropositive versus seronegative animals. When stratified by serovar, animals with positive titers for both Hardjobovis and Pomona (indicating dual infection) were excluded from the analysis. The 95% CI of the prevalence and prevalence ratio was adjusted for the effect of correlation between animals within slaughter line using generalized estimating equations 31 and robust standard errors. The GENMOD procedure in SAS 9.3 r was used for this purpose with data aggregated at slaughter line level and line ID being the subject effect (Smith T, Smith B: 2006, PROC GENMOD with GEE to analyze correlated outcomes data using SAS. Dept. of Defense Center for Deployment Health Research, Naval Health Research Center, San Diego, CA. Available at: http://www.lexjansen.com/wuss/2006/tutorials/TUT-Smith.pdf). The logistic model was modified to obtain the prevalence ratio with confidence intervals instead of an odds ratio, by using a Poisson distribution with a log-link. 55
Results
Samples tested were 545 kidneys (399 sheep and 146 beef cattle), 542 sera (396 sheep and 146 beef cattle), and 274 urine samples (156 sheep and 118 cattle).
Interlaboratory comparisons
Urine qPCR
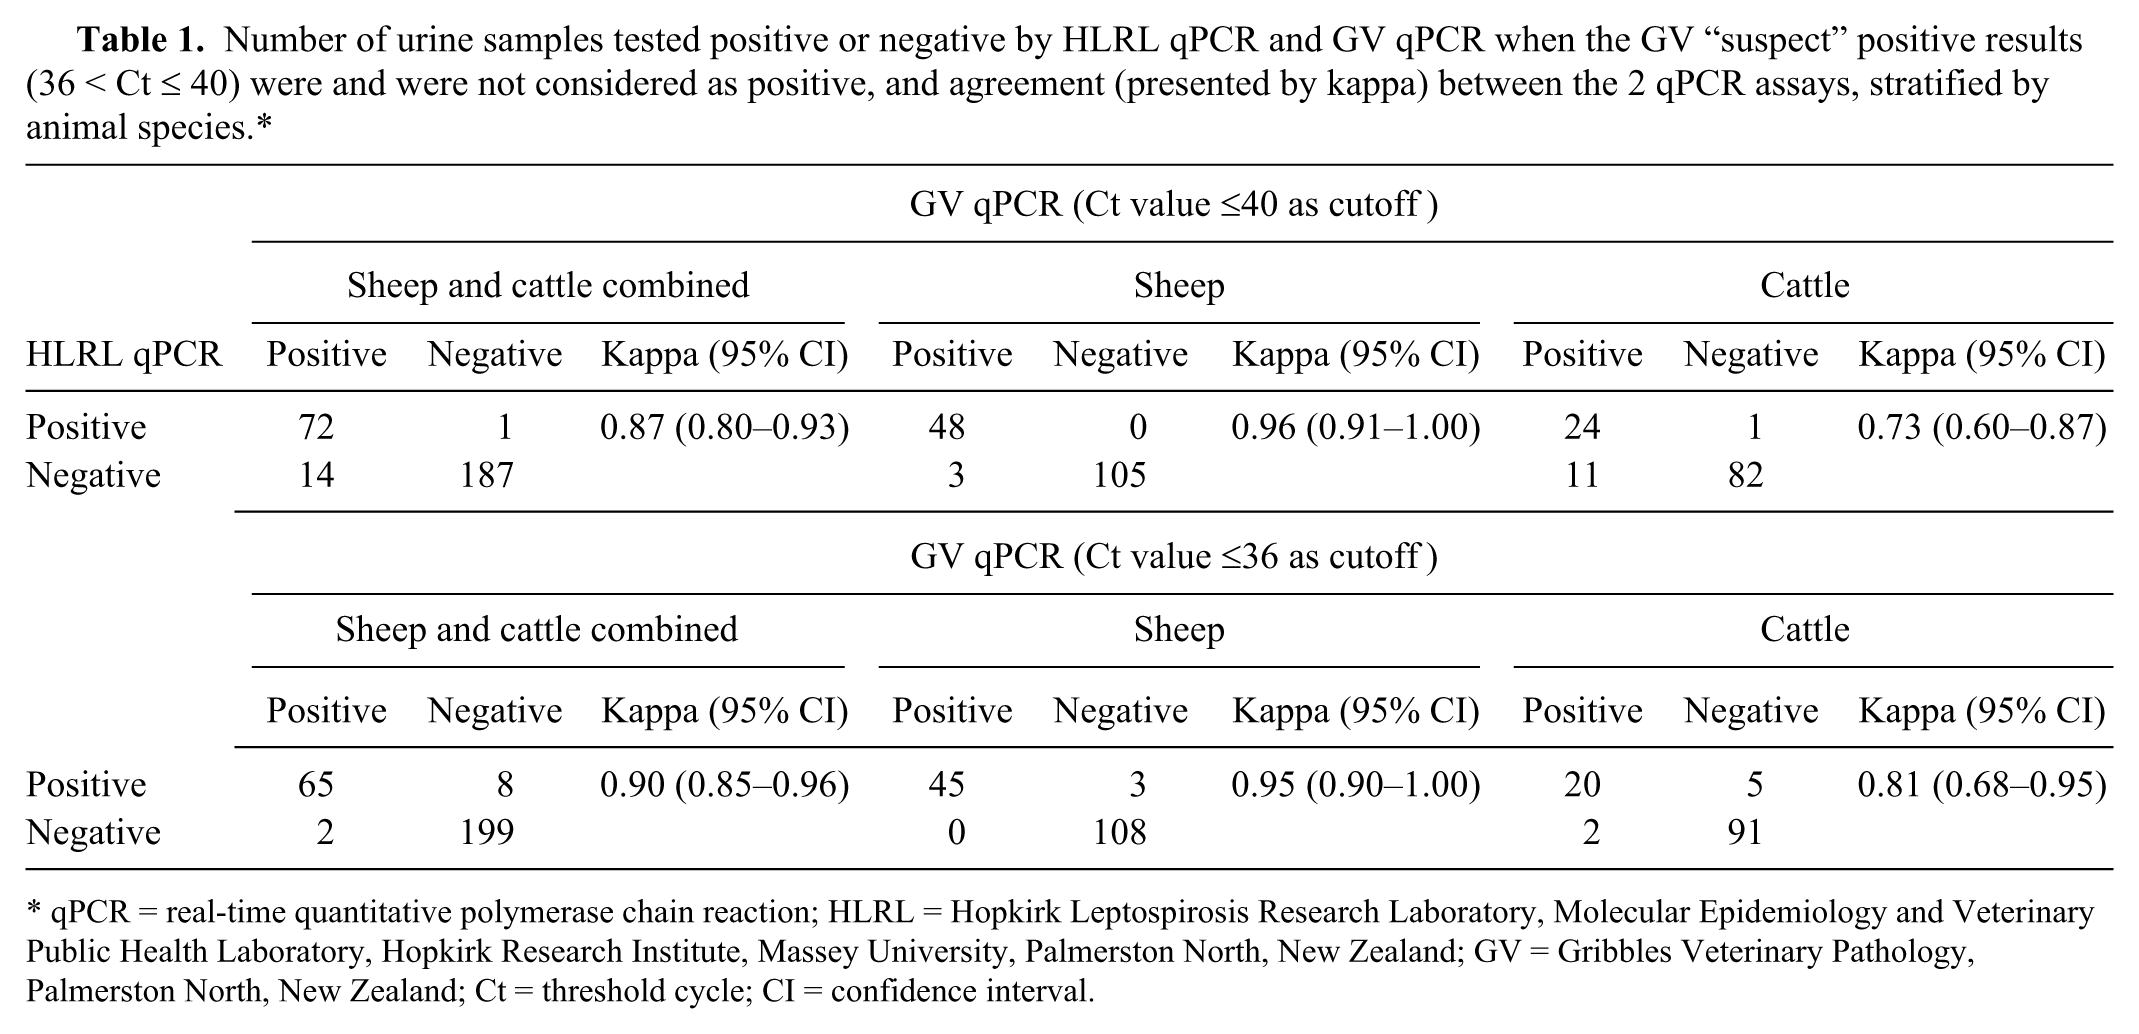
The results for qPCR are presented in Table 1, including when “suspect” positive results obtained from GV were and were not considered as positive. When “suspect” positive results obtained from GV were considered as positive, the agreement between the 2 qPCR assays was almost perfect when sheep and cattle samples were combined; the kappa value was higher for sheep than cattle samples when analyzed by species. When “suspect” positive results obtained from GV qPCR were considered as negative, the kappa value was higher for sheep and cattle samples combined and cattle samples alone, but similar for sheep samples.
Number of urine samples tested positive or negative by HLRL qPCR and GV qPCR when the GV “suspect” positive results (36 < Ct ≤ 40) were and were not considered as positive, and agreement (presented by kappa) between the 2 qPCR assays, stratified by animal species.*
qPCR = real-time quantitative polymerase chain reaction; HLRL = Hopkirk Leptospirosis Research Laboratory, Molecular Epidemiology and Veterinary Public Health Laboratory, Hopkirk Research Institute, Massey University, Palmerston North, New Zealand; GV = Gribbles Veterinary Pathology, Palmerston North, New Zealand; Ct = threshold cycle; CI = confidence interval.
A significant negative association (P < 0.001) was found between the continuous variable (Ct value from GV urine qPCR) and the binary outcome (HLRL urine qPCR results) in the logistic regression analysis. For 1 unit increase in Ct value, the odds of a sample being tested positive by HLRL urine qPCR decreased by 0.65 (95% CI: 0.45–0.84). The association was not distorted by species, supplier, or slaughter line ID as none of these variables changed the regression coefficient of the Ct value by more than 15%. None of the interactions were significant. The Ct value from GV urine qPCR was the only variable that was significant at P < 0.05 level and retained. The P value for the le Cessie–van Houwelingen normal test was 0.57 indicating a good model fit. The area under the ROC curve was 0.997, indicating that the Ct value of the GV qPCR predicted the qPCR outcome from HLRL almost perfectly.
MAT
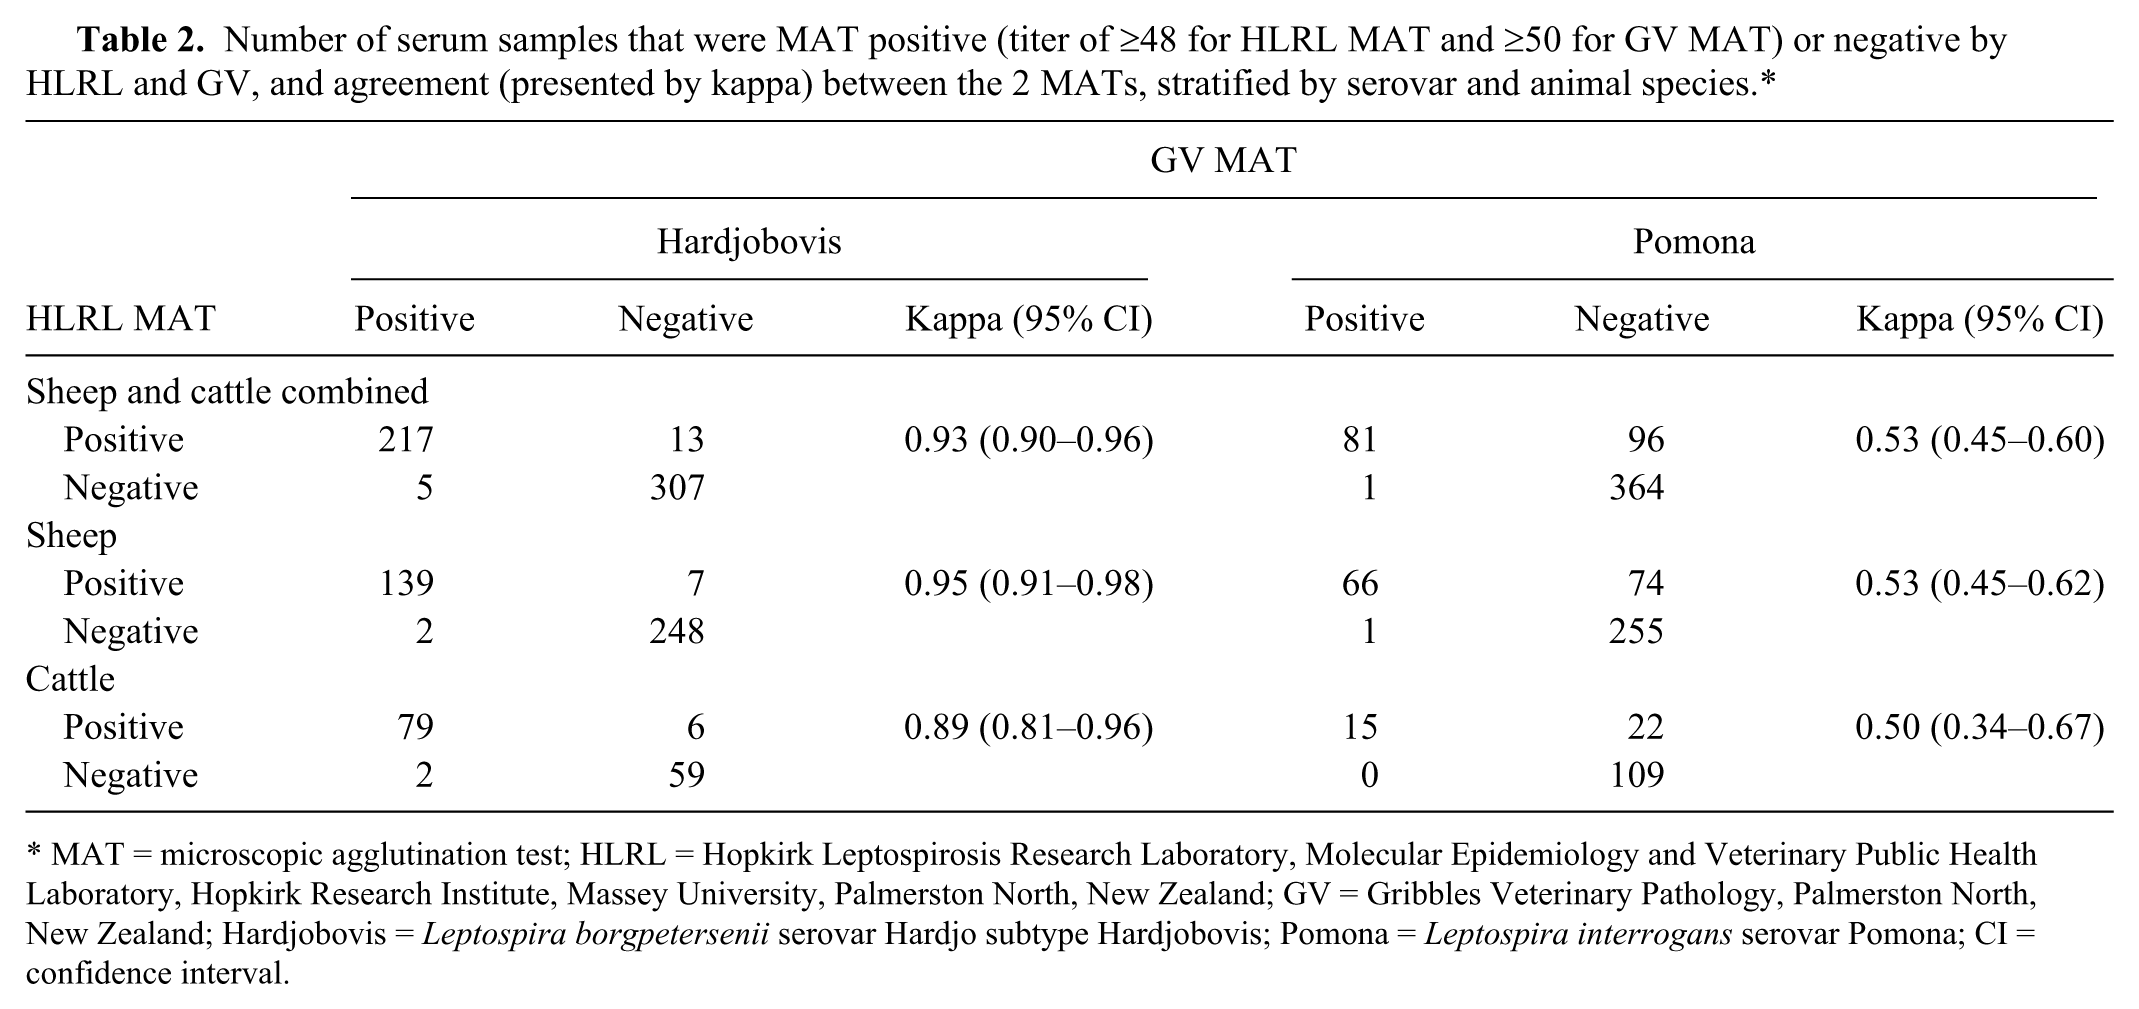
The agreements between HLRL and GV MAT results, stratified by serovar and animal species, are presented in Table 2. Agreement between 2 MATs, cattle and sheep combined, was almost perfect against serovar Hardjobovis and moderate against serovar Pomona. When stratified by animal species, the kappa value was higher for sheep than cattle samples. The comparisons of MAT titers against Hardjobovis and Pomona from HLRL and GV are presented in Figure 2.
Number of serum samples that were MAT positive (titer of ≥48 for HLRL MAT and ≥50 for GV MAT) or negative by HLRL and GV, and agreement (presented by kappa) between the 2 MATs, stratified by serovar and animal species.*
MAT = microscopic agglutination test; HLRL = Hopkirk Leptospirosis Research Laboratory, Molecular Epidemiology and Veterinary Public Health Laboratory, Hopkirk Research Institute, Massey University, Palmerston North, New Zealand; GV = Gribbles Veterinary Pathology, Palmerston North, New Zealand; Hardjobovis = Leptospira borgpetersenii serovar Hardjo subtype Hardjobovis; Pomona = Leptospira interrogans serovar Pomona; CI = confidence interval.
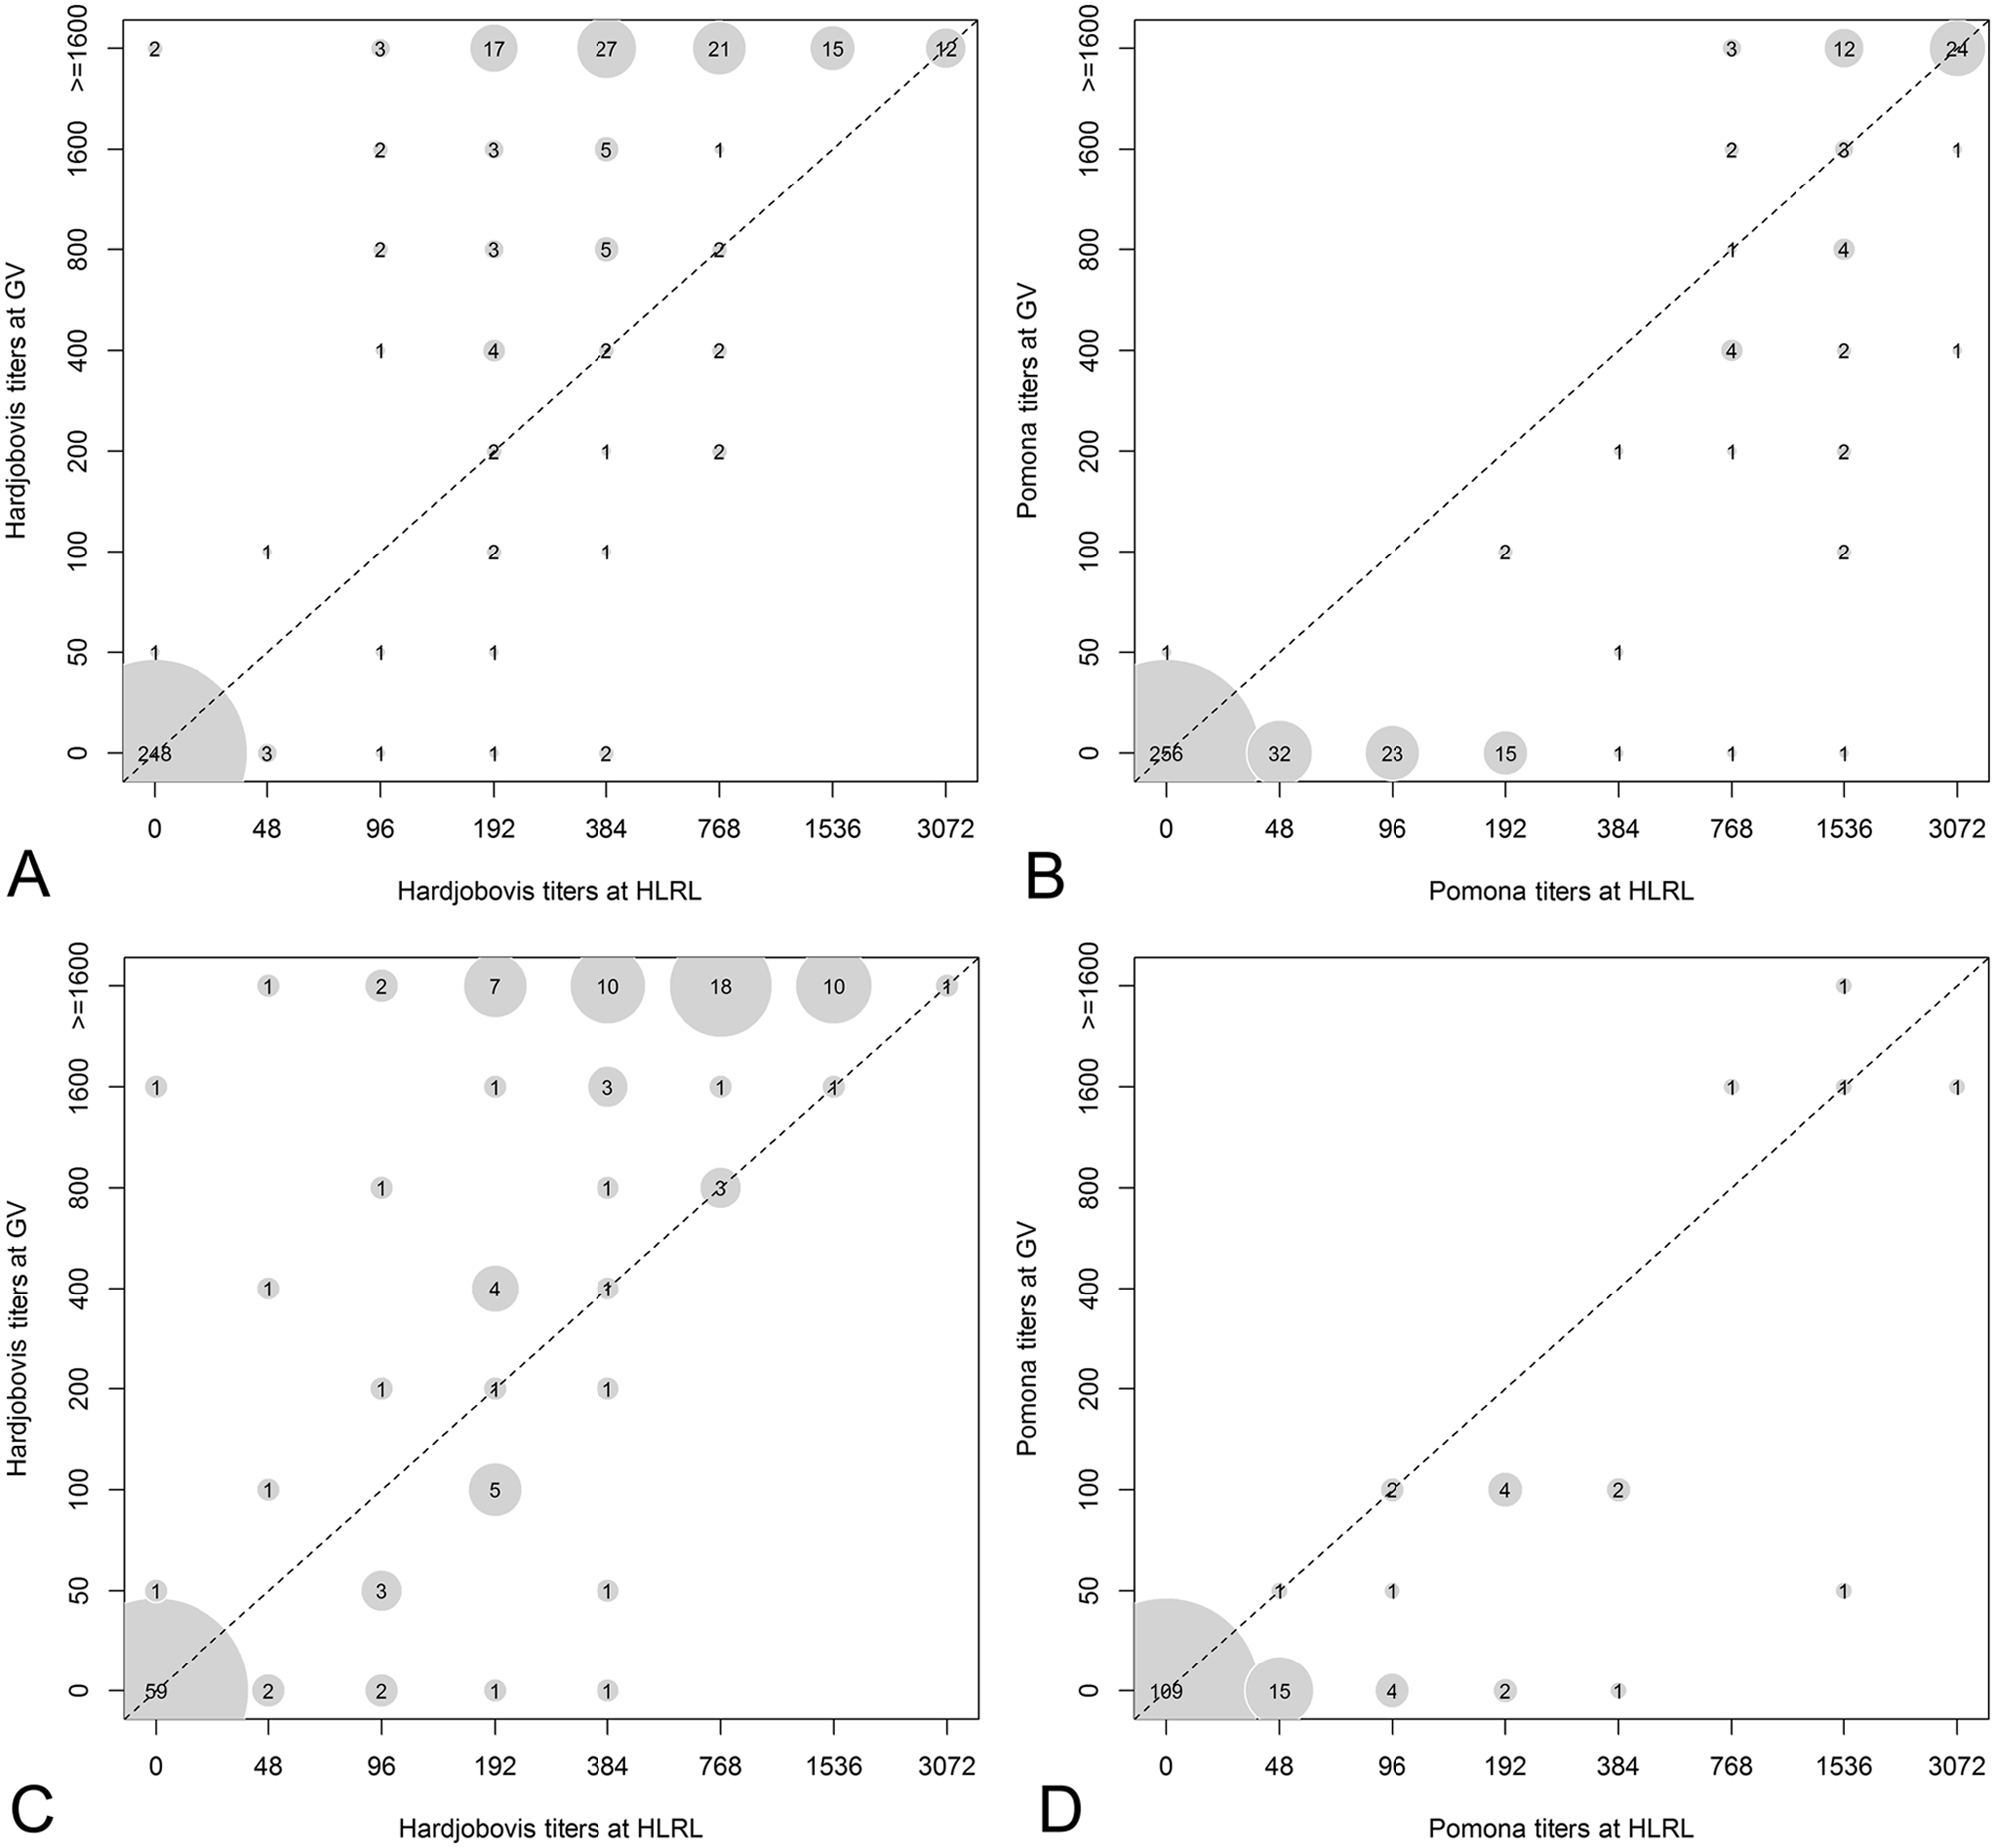
Bubble plots comparing the microscopic agglutination test (MAT) titers for serum samples between GV and HLRL stratified by animal species:
For sheep and cattle combined that had different Hardjobovis titers (39%; 210/542) reported, higher titers were reported by GV than HLRL (P < 0.005); this occurred in 87% (113/130; 95% CI: 80–92%) of sheep (P < 0.005) and 80% (64/80; 95% CI: 70–88%) of cattle (P < 0.005). However, for sheep and cattle combined that had different Pomona titers (27%; 146/542) reported, lower titers were reported by GV than HLRL (P < 0.005); this occurred in 84% (95/113; 95% CI: 76–90%) of sheep (P < 0.005) and 94% (31/33; 95% CI: 80–99%) of cattle (P < 0.005).
The differences in serum sample storage times between the 2 laboratories (the storage time at HLRL minus that at GV), stratified by serovar are presented in Figure 3. In general, serum samples were stored longer at HLRL than GV, especially prior to testing against serovar Hardjobovis. Samples were stored for a median of 108 days (interquartile range [IQR] = 10; minimum = −25; maximum = 152) longer for serovar Hardjobovis, and 88 days (IQR = 46; minimum = −25; maximum = 116) longer for serovar Pomona at HLRL than at GV. In linear regression models for either serovar, no significant association was detected between differences of MAT results (for Hardjobovis or Pomona) and differences of serum sample storage time reported from the 2 laboratories.
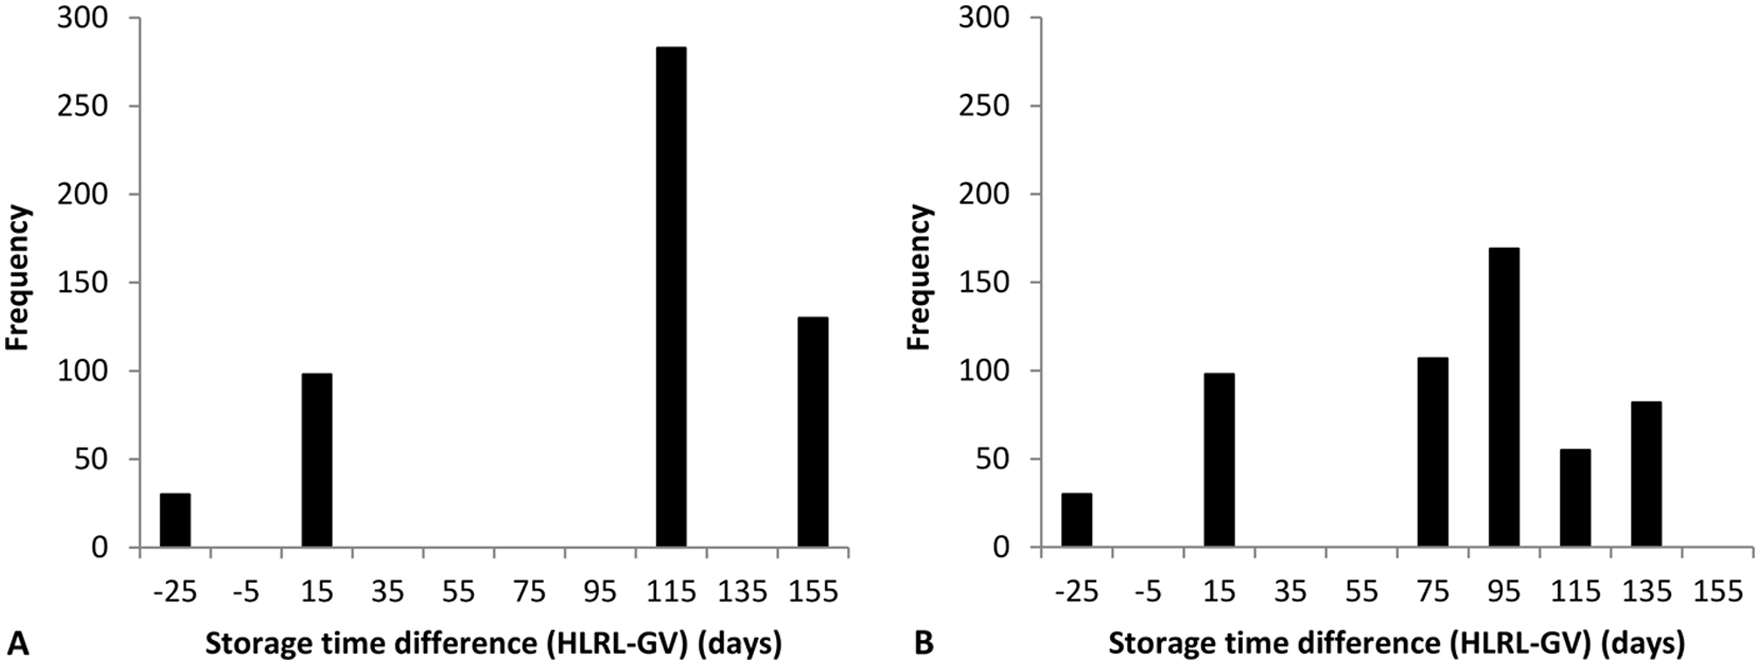
Histogram of the frequency of differences (the interval at HLRL minus the interval at GV) in serum sample storage time (between sample collection date and microscopic agglutination test [MAT] testing date) between HLRL and GV; by Leptospira borgpetersenii serovar Hardjo subtype Hardjobovis (
Intralaboratory comparisons between tests on different specimens (HLRL only)
Urine and kidney qPCR
The qPCR results of the 274 animals that had both kidney and urine samples collected are presented in Table 3. The agreement between kidney qPCR and urine qPCR results, cattle and sheep combined, was almost perfect. When stratified by animal species, the kappa value was higher for sheep than for cattle.
Number of animals that tested urine qPCR and kidney qPCR positive or negative, and agreement (presented by kappa) between urine and kidney qPCR results, stratified by animal species.*
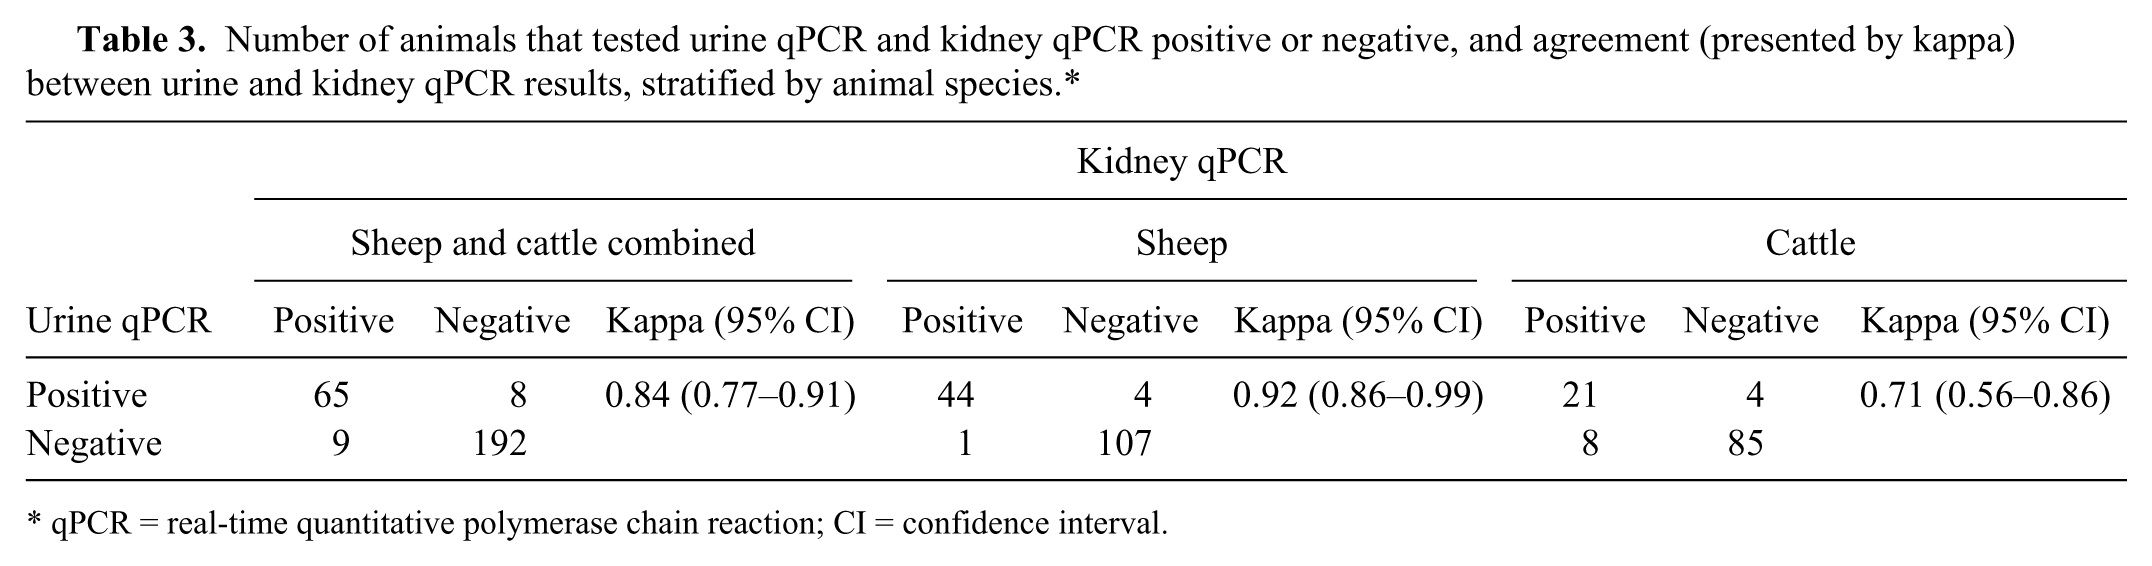
qPCR = real-time quantitative polymerase chain reaction; CI = confidence interval.
Urine and kidney qPCR and MAT
The urine and kidney qPCR and MAT results for the animals that had both urine or kidney and blood samples collected, and the agreement between urine or kidney qPCR results and MAT results, stratified by animal species are presented in Table 4. For animals (sheep and cattle combined) that had both blood and urine samples collected, and that had both blood and kidney samples collected, the agreement between MAT and qPCR results was fair. When stratified by animal species, the kappa value was higher for sheep than cattle samples.
Number of urine and kidney samples that tested qPCR positive or negative by MAT results (titer ≥48, against Hardjobovis and/or Pomona), and agreement (presented by kappa) between urine qPCR and kidney qPCR results and MAT results, stratified by animal species.*
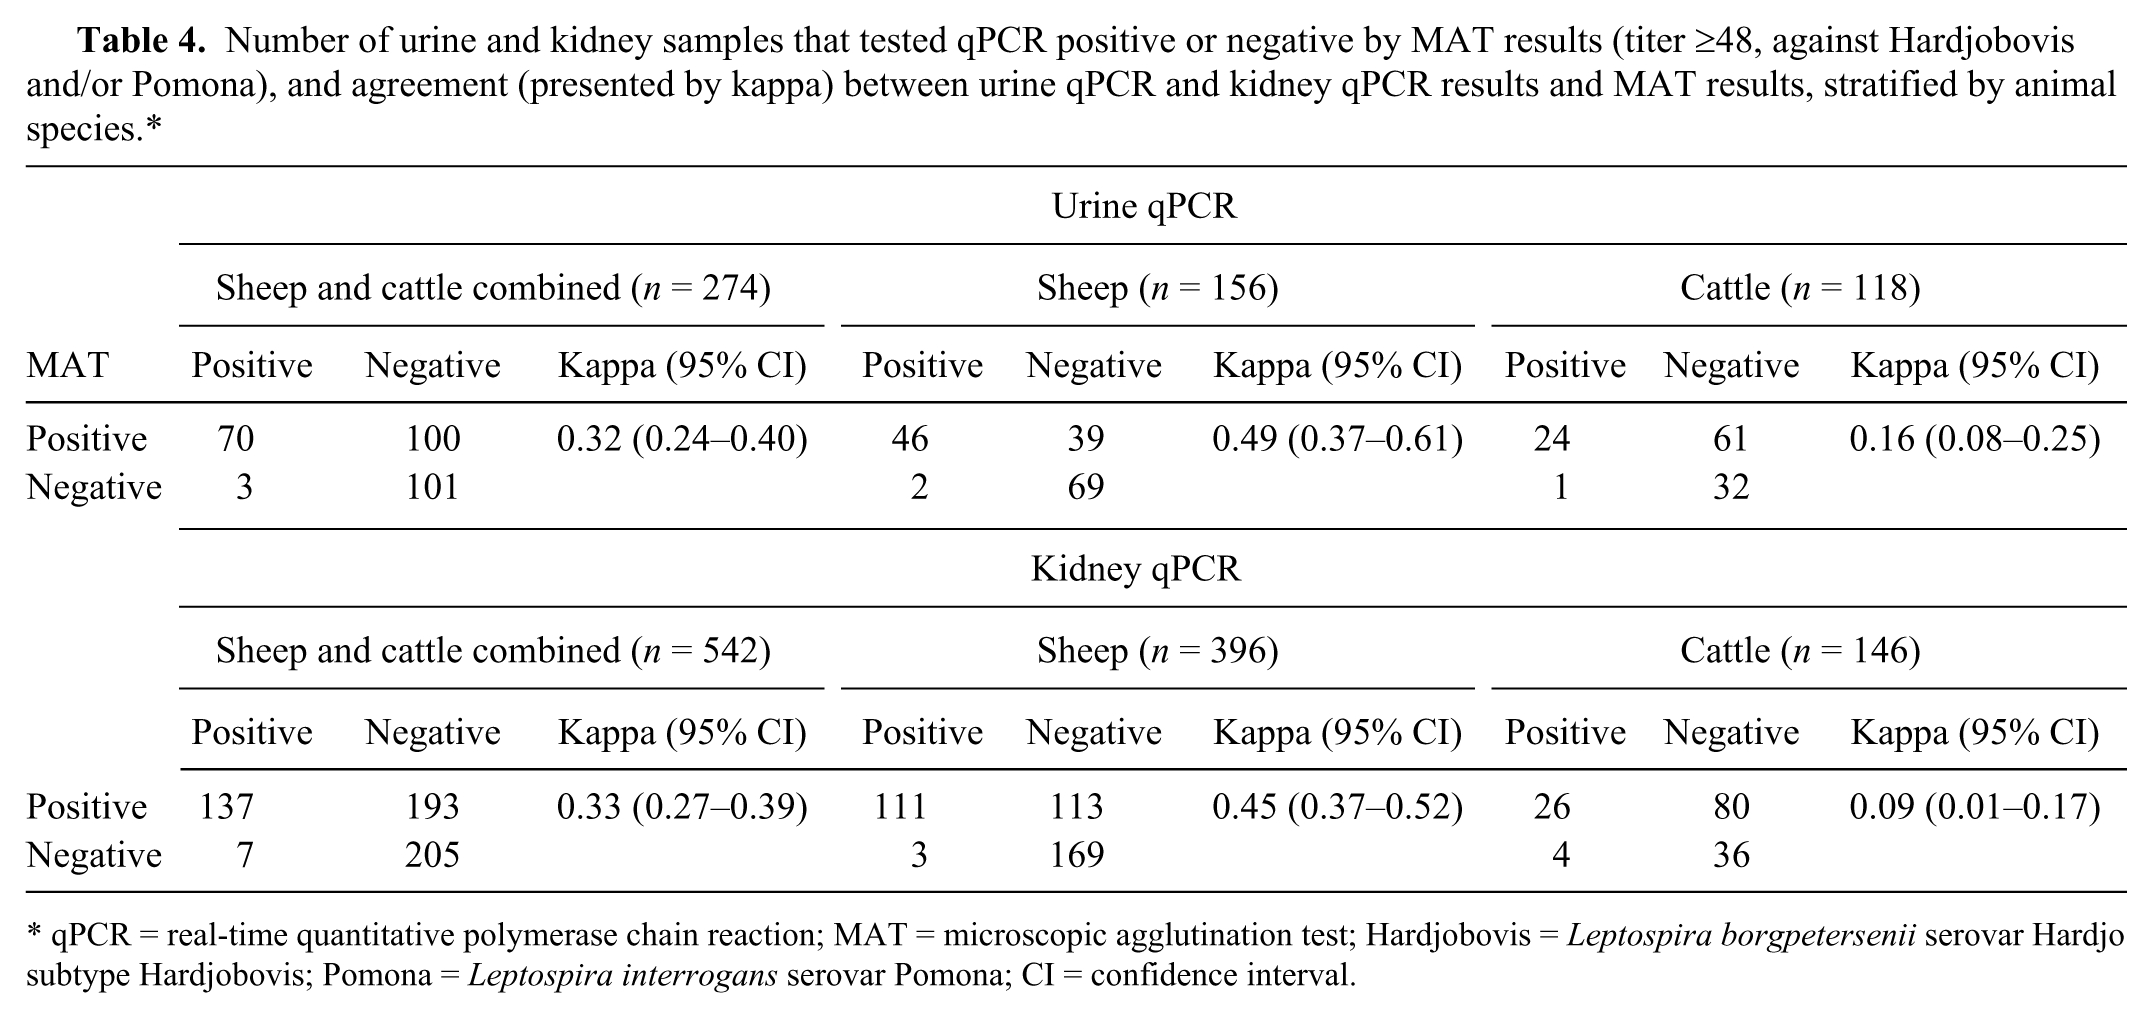
qPCR = real-time quantitative polymerase chain reaction; MAT = microscopic agglutination test; Hardjobovis = Leptospira borgpetersenii serovar Hardjo subtype Hardjobovis; Pomona = Leptospira interrogans serovar Pomona; CI = confidence interval.
The percentage of urine and kidney samples that were qPCR positive in seropositive and seronegative animals and the prevalence ratio of urine and kidney qPCR positivity in seropositive versus seronegative animals are presented in Table 5. With sheep and cattle results combined, the prevalence of urine qPCR positivity in seropositive (either Hardjobovis and/or Pomona) animals was 9.1 (95% CI: 3.7–22.9) times that in seronegative animals. The prevalence of kidney qPCR positivity in seropositive animals was 5.1 (95% CI: 3.0–8.8) times that in seronegative animals. When stratified by serovar, the prevalence of urine and kidney qPCR positivity in Hardjobovis-seropositive versus that in Hardjobovis-seronegative animals was higher than the prevalence of urine and kidney qPCR positivity in Pomona-seropositive versus that in Pomona-seronegative animals. The prevalence of urine and kidney qPCR positivity in Hardjobovis-seropositive versus that in Hardjobovis-seronegative animal was higher in sheep than in cattle.
Percentage of urine and kidney samples that were qPCR positive in seropositive (MAT titer ≥48) and seronegative animals, and the prevalence ratio of urine qPCR and kidney qPCR positivity in seropositive versus seronegative animals, with 95% CI adjusted for the effect of correlation of animals within slaughter line.*
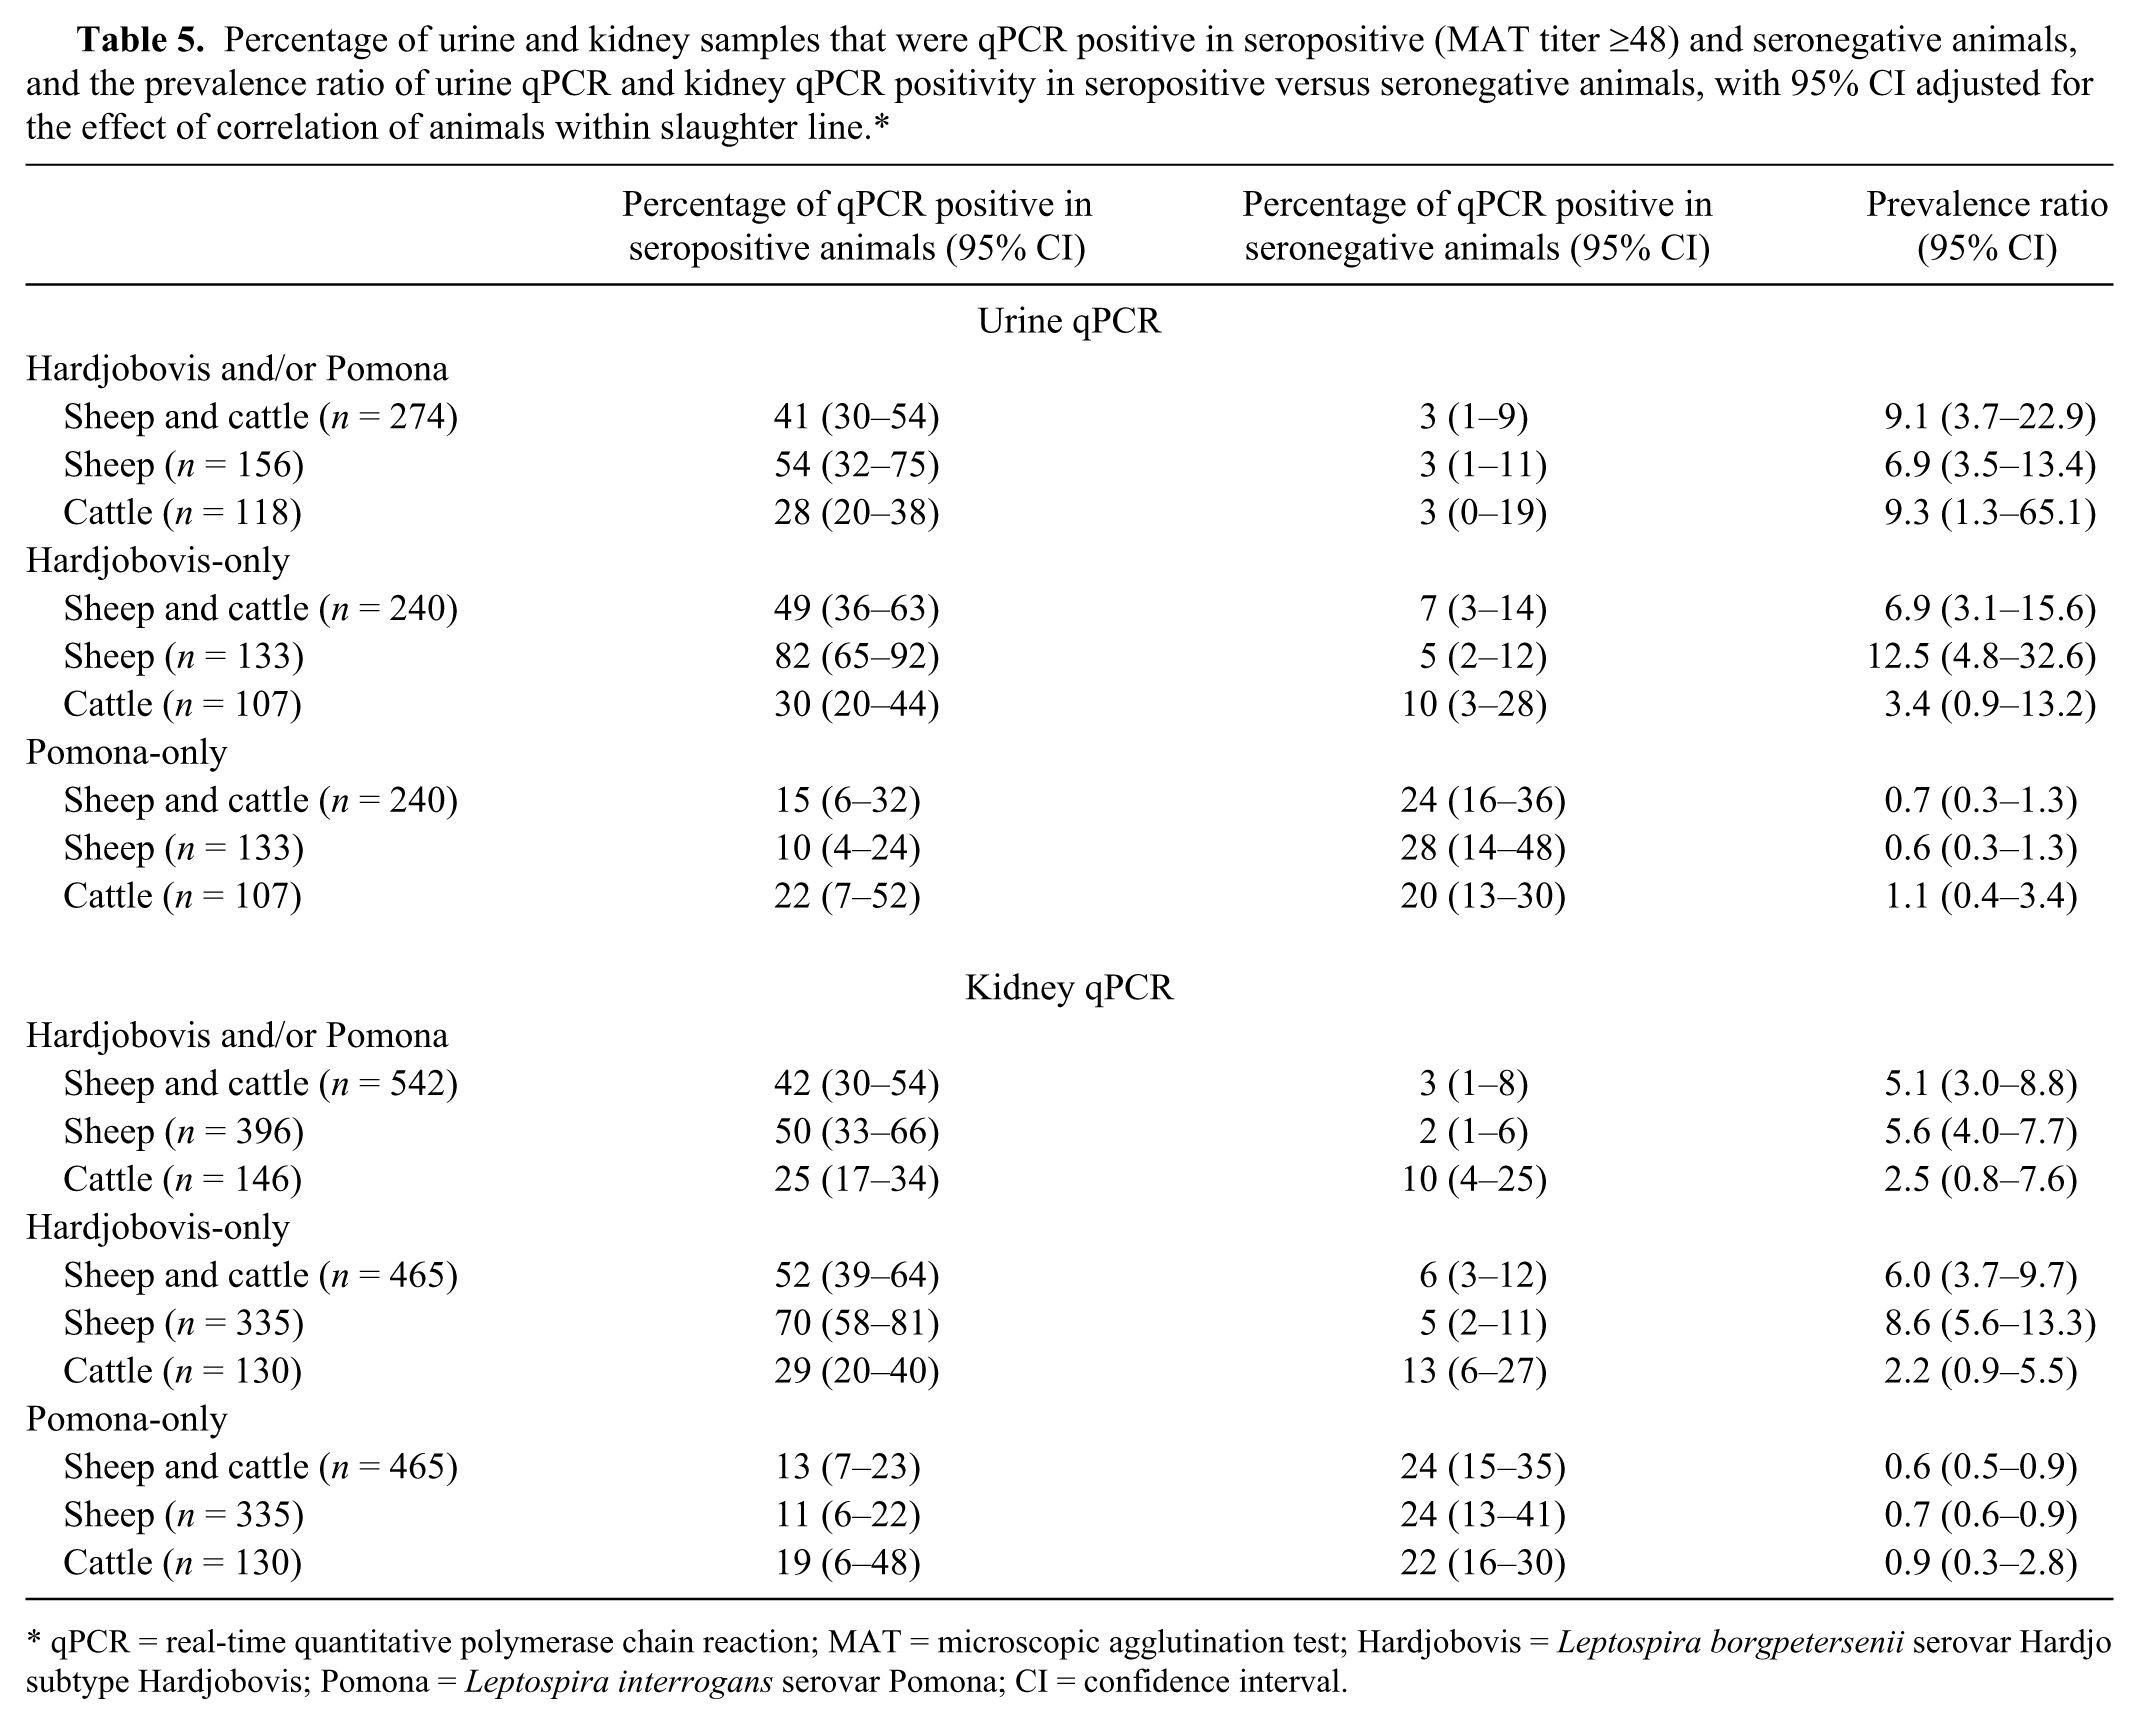
qPCR = real-time quantitative polymerase chain reaction; MAT = microscopic agglutination test; Hardjobovis = Leptospira borgpetersenii serovar Hardjo subtype Hardjobovis; Pomona = Leptospira interrogans serovar Pomona; CI = confidence interval.
The percentage of urine and kidney samples that were qPCR positive in sheep and cattle at different MAT titer values against serovar Hardjobovis or Pomona is presented in Figure 4. Dual infections were excluded. In general, Hardjobovis-seropositive sheep had a higher percentage of qPCR positivity at each MAT titer compared with Hardjobovis-seropositive cattle. In animals with Pomona titers ≥48, there were significant trends (P < 0.01) of increasing proportions of qPCR-positive kidneys (sheep, cattle) and qPCR-positive urine (cattle) as titers increased.
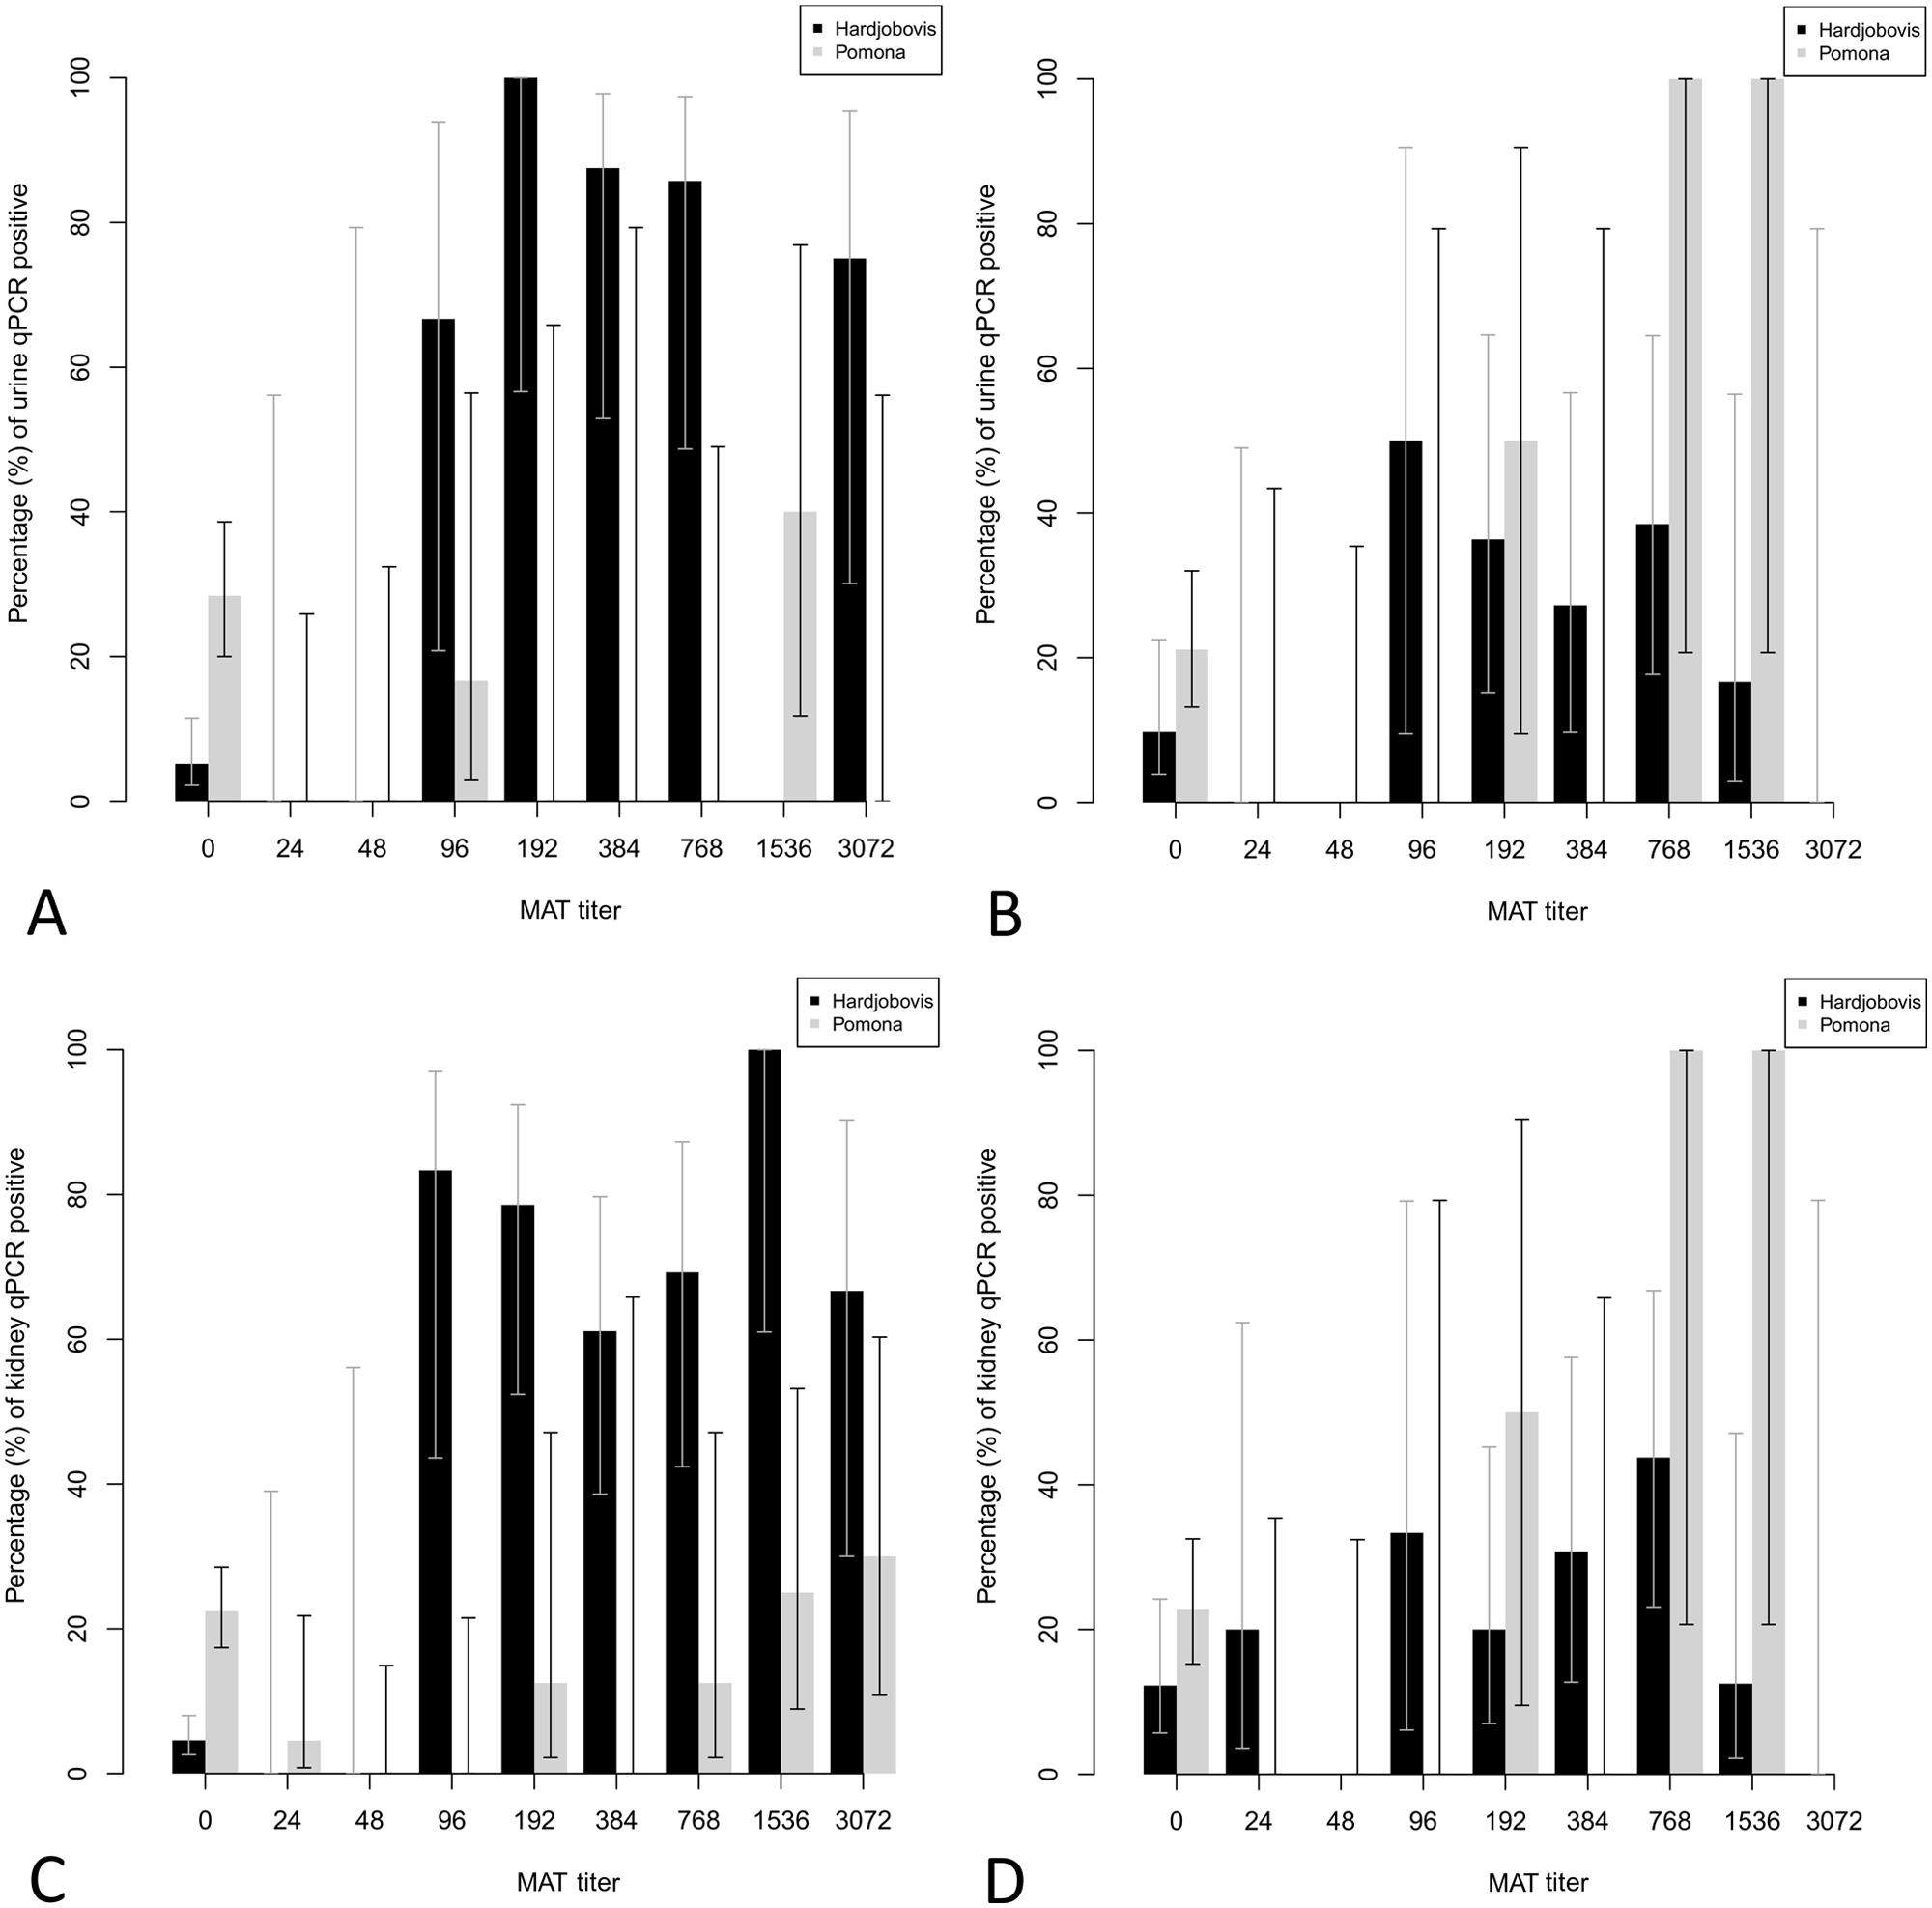
Percentage (error bars indicate 95% confidence interval [CI]) of urine and kidney samples that were real-time quantitative polymerase chain reaction (qPCR) positive at different levels of microscopic agglutination test (MAT) titers against Leptospira borgpetersenii serovar Hardjo subtype Hardjobovis (black bars) or Leptospira interrogans serovar Pomona (gray bars):
Discussion
The current study investigated agreement between qPCR assays and MATs for leptospirosis diagnosis performed in a research and a commercial veterinary diagnostic laboratory, using urine samples and serum from sheep and cattle. The results can assist researchers and diagnosticians in understanding the sometimes discrepant test results between studies. Interlaboratory agreement for results of the urine qPCR assays was almost perfect, while the agreement for positivity to MATs was serovar-dependent (almost perfect for Hardjobovis and moderate for Pomona). Additionally, qPCR performed at the research laboratory on paired urine and kidney samples was compared. The almost perfect agreement suggested the qPCR on these 2 specimens can be used interchangeably. There was fair agreement between MAT positivity for Hardjobovis and/or Pomona and qPCR on both kidney and urine in sheep and cattle. However, the prevalence ratio of urine and kidney qPCR positivity in Hardjobovis-seropositive versus Hardjobovis-seronegative sheep indicated that Hardjobovis-seropositivity found in sheep may be able to predict shedding or renal carriage at the individual animal level.
Although comparison of qPCR assays for human leptospirosis diagnosis in blood has been reported,8,48 this comparison has not been performed for animal leptospirosis diagnostics on any specimen, to the best of the authors’ knowledge. Also, no comparison of qPCR assays between laboratories has been published to evaluate the practice of generalization of qPCR results between laboratories. The current study demonstrated almost perfect agreement between the qPCR assays from a research and a veterinary diagnostic laboratory on urine samples from sheep and cattle, while a higher kappa value was obtained when “suspect” positive results recorded from GV were considered as negative. The significant negative association between Ct values from GV urine qPCR and the probability of HLRL urine qPCR results being positive, and that this was not attenuated by other confounding variables (e.g., species), strengthens the finding of almost perfect agreement between laboratories for urine qPCR. Differences in the qPCR protocols could contribute to the different results obtained from the laboratories. Protocol differences included the use of different primers targeted at different genes (gyrB gene for HLRL and 16s rRNA gene for GV), different chemistries (SYTO9 for HLRL and TaqMan probe for GV), and also the different pre-PCR processing including different DNA extraction protocols and delay times between collection and processing of samples. Urine samples were centrifuged before the DNA extraction process at HLRL with a QIAamp DNA Mini Kit, while at GV, urine samples were used directly for DNA extraction with a BioSprint 96 One-For-All vet kit. HLRL processed the samples the day following collection, while GV processed samples within a week, based on laboratory capacity. Leptospires can lyse in urine samples due to the storage and transport of samples. Also, because the urine samples were not treated with ethylenediamine tetra-acetic acid and formaldehyde or centrifuged and resuspended as suggested to prevent the DNase activity, long storage may affect the quality and quantity of the DNA extracted.23,51
Although it is well known anecdotally that different MAT results can be obtained from different laboratories, studies comparing MAT results between laboratories are limited. In the present study, the agreement for MAT results between laboratories was serovar dependent, which indicated that the differing results were more likely due to the different source of antigen (especially serovar Pomona) cultures used in the 2 laboratories than to variation in reporting cutoff titer values by the 2 laboratories. Even so, the proportion of serum samples that had variable MAT titers reported by the 2 laboratories showed that the reading of MAT titers can vary between observers from 2 laboratories. It was possible that the different serum storage times between the 2 laboratories could explain the different MAT results obtained, although the analysis demonstrated that the association between the difference of serum storage times and the different MAT titers reported by the 2 laboratories was not significant for either serovar in this study.
Although the MAT is the serological reference test for leptospirosis diagnosis, 39 the test detects antibodies in serum, rather than the presence of leptospires directly. The direct detection of leptospires or the organism’s DNA in urine and kidney is important for identifying carriers. 18 Because the MAT is still the most commonly used diagnostic test, and sampling blood from live animals is more practicable than sampling urine or kidney, it is worthwhile investigating the association between serological results and shedding and renal carriage status. It is important to note that none of the diagnostic tests is perfect for all purposes, and neither MAT nor qPCR assays should be treated as the gold standard. Also, there is a limitation when comparing MAT and qPCR conducted on different specimens (MAT on serum; qPCR on urine and kidney). As the qPCR protocols tested cannot readily identify serovars, positive qPCR results may not always indicate shedding of the same serovar identified by MAT. However, considering Hardjobovis and Pomona are the 2 most commonly found Leptospira serovars in livestock in New Zealand,3,7,36 it is reasonable to make the comparison between MAT (against Hardjobovis and/or Pomona) and qPCR results on urine and kidney.
When results from sheep and cattle were combined, the agreement between MAT and qPCR on urine and kidney was fair (kappa = 0.32 and kappa = 0.33, respectively). The seroprevalence found in urine or kidney qPCR-negative animals was 50% (100/201) and 48% (193/398), respectively. Several factors may contribute to this finding. The stage of the infection cycle within the herd or flock can be an important reason. It is possible that some of the sampled animals were recently infected (at the early stage of infection) and may not have started to shed leptospires in urine at the time of sampling. Antibodies are usually produced from around 3 to 10 days after infection, whereas the leptospires are usually shed in urine from the second week after infection. 18 It is also possible that MAT titers persisted after leptospires were cleared from kidney, and shedding had ceased. Seroprevalence found in urine qPCR-negative animals may also be due to the intermittent shedding of leptospires. 29 The findings in the current study are consistent with those that have shown that positive MAT titers provide limited prediction of shedding and renal carriage in sheep and cattle, when determined by urine PCR or kidney culture.14,25,33
In total, 4.1% of the urine qPCR–positive and 4.9% of kidney qPCR–positive animals were seronegative to both serovars. This may be attributable to antibodies decreasing to low or nondetectable after a long period past exposure. In naturally infected animals, detectable MAT titers may persist for 1–2 years, or even at low levels throughout the life of the animal.18,54 However, all sheep and cattle that were urine or kidney qPCR positive but seronegative were aged less than 12 months old and 18 months old, respectively. This suggests that the time elapsed since exposure may not be a reason for the seronegativity in these qPCR-positive animals. Another possible explanation for this can be that these animals were shedding leptospires in urine before an antibody response was detected (delays of antibodies appearance have been recorded). 18 Furthermore, infections may have been due to 1 or more serovars that was not tested by the MAT in this study (e.g., Ballum). In total, 97.1% and 96.7% of MAT-negative animals were urine and kidney qPCR negative, respectively. Therefore, negative MAT was a reasonable predictor of noncarrier and nonshedding state.
For urine and kidney samples that were qPCR positive by MAT positivity, data was provided for MAT positivity for Hardjobovis and/or Pomona, and also for MAT positivity for Hardjobovis-only and Pomona-only. Data suggested that both sheep and cattle with Hardjobovis-only positive titers were more likely to be shedding or had renal carriage than those with Pomona-only positive titers. The prevalence ratio of urine and kidney qPCR positivity in Hardjobovis-seropositive versus Hardjobovis-seronegative animals was higher in sheep than cattle. Animals infected with host-adapted strains tend to have a long kidney colonization phase and shed leptospires in the urine for a longer duration than those infected with non–host-adapted strains. 42 Study findings may be a reflection of a higher probability of detecting leptospires in animals infected with host-adapted strains as opposed to those infected with non–host-adapted strains and suggest that Hardjobovis was better adapted than Pomona to sheep and cattle, while the adaption of Hardjobovis was better in sheep than cattle.
When interpreting the level of MAT titers, data from the current study suggests that the interpretation was different for serovars Hardjobovis and Pomona. For Pomona-seropositive animals, higher MAT titers predicted higher probability of shedding. However, this association was not seen for Hardjobovis-seropositive animals. In these, regardless of the level of the MAT titer, high probability of shedding was reported. Nevertheless, the true level of shedding in a flock or herd needs to take into account the proportion of shedders that were MAT negative. The different trends between Hardjobovis and Pomona may further indicate that the 2 pathogens elicit different host immune responses and/or have different effects on sheep and cattle. Data from seroconversion (“infection”) rates among abattoir workers in New Zealand also showed differences between these 2 serovars: infection rates with Pomona were twice as high as with Hardjobovis (Dreyfus A: 2013) whereas exposure rates to Pomona were lower. 15 Furthermore, data revealed that workers with “flu-like” symptoms had significantly higher titers against Pomona than those without flu-like symptoms (P = 0.02), while Hardjobovis titers of workers with flu-like symptoms did not differ from those without flu-like symptoms (Dreyfus A: 2013). Thus it appears that the 3 hosts under study (human beings, cattle, and sheep) show a greater response when infected by Pomona than Hardjobovis.
The interlaboratory comparison of urine qPCR assays on sheep and cattle in the current study was novel and has yielded useful results for researchers and diagnosticians. Almost perfect agreement between results of the urine qPCR assays from a research and a commercial veterinary diagnostic laboratory, where different amplification genes, chemistries, and pre-PCR processing were used, was demonstrated. This confirms that studies based on these 2 tests for detecting leptospiral shedding in sheep and cattle in New Zealand are comparable. The interlaboratory comparison of MATs revealed moderate agreement for the Pomona MATs. This again emphasized the well-known challenge of interpreting MAT results obtained from different laboratories, and the importance of quality control for MAT at each individual laboratory. The comparison of HLRL qPCR on urine and kidney samples showed almost perfect agreement, indicating that the results of this qPCR on urine samples is a useful surrogate for the results of qPCR on kidneys. Such results are useful for veterinary studies where sampling of kidney from live animals is not possible. The comparison between HLRL MAT and urine and kidney qPCR results indicated that, except for Hardjobovis in sheep, MAT was not a reliable predictor of shedding and renal carriage of Pomona in sheep or Hardjobovis and Pomona in cattle at the individual animal level in New Zealand.
Footnotes
Acknowledgements
Thanks to Gemma Worth and Alison Cullum from AgResearch Limited, Ruakura Research Centre, New Zealand for the sampling and data collection at the abattoir; Bronwyn Harrop from Gribbles Veterinary Pathology, Hamilton, New Zealand for assistance with sample transport; Gail Ross and Kathryn Coolbear-Stern from Gribbles Veterinary Pathology, Palmerston North, New Zealand for MAT and qPCR testing; Neville Haack from Molecular Epidemiology and Veterinary Public Health Laboratory and Infectious Disease Research Centre, Hopkirk Research Institute, Massey University, Palmerston North, New Zealand; and Emilie Vallee and Ruth Meenks for their laboratory support.
a.
Vacutainer SST II advance tubes, BD, Franklin Lakes, NJ.
b.
Vacutainer evacuated plastic conical bottom tubes, BD, Franklin Lakes, NJ.
c.
Container 500-ml (screwed cap), Raylab, Auckland, New Zealand.
d.
Eppendorf tube, Raylab, Auckland, New Zealand.
e.
Qiagen QIAamp DNA mini kit, Bio-Strategy Ltd, Auckland, New Zealand.
f.
Qiagen BioSprint 96 One-For-All vet kit, Bio-Strategy Ltd, Auckland, New Zealand.
g.
Colworth stomacher 400, AJ Seward Ltd, London, United Kingdom.
h.
High Pure PCR template preparation kit, Roche, Mannheim, Germany.
i.
Qiagen Rotor-Gene Q machine, Bio-Strategy Ltd, Auckland, New Zealand.
j.
Invitrogen Corp., Carlsbad, CA.
k.
Taq PCR kit, New England BioLabs, Ipswich, MA.
l.
Corbett Rotor-Gene 6000, Bio-Strategy Ltd, Auckland, New Zealand.
m.
Qiagen QuantiTech probe PCR master mix, Bio-Strategy Ltd, Auckland, New Zealand.
n.
Integrated DNA Technologies (IDT), Custom Science, Auckland, New Zealand.
o.
96-well flat-bottom polystyrene plate, Greiner Bio-one, Frickenhausen, Germany.
p.
Olympus BH2 dark-field microscope, Olympus, Tokyo, Japan.
r.
SAS Institute Inc., Cary, NC.
Declaration of conflicting interests
The author(s) declared no potential conflicts of interest with respect to the research, authorship, and/or publication of this article.
Funding
The current project was funded by the local abattoir and the postgraduate research fund from Institute of Veterinary, Animal and Biomedical Sciences, Massey University, Palmerston North, New Zealand.