
Abstract
The objectives of the current study were 1) to compare sample preparation workflows and quantitative real-time polymerase chain reaction assays (qPCR) as currently used in veterinary diagnostic laboratories with a study protocol utilizing commercially available reagents for individual Tritrichomonas foetus testing, 2) to assess the accuracy of pooling cultured smegma samples followed by extraction and qPCR testing as used in the study laboratory, and 3) to assess the specificity of the currently used primers and probes by sequencing all positive and presumptive positive samples identified in the study laboratory in an attempt to capture any nucleotide variability between T. foetus isolates and to rule out false-positive results possibly due to Simplicimonas moskowitzi. Eight hundred three cultured smegma samples were collected from different regions of the United States with the collaboration of 5 veterinary testing laboratories. The samples were processed individually by the respective laboratories, and then sent to the study laboratory and retested using the study protocol. Comparison testing showed an overall agreement of 95.89% between the veterinary testing laboratories and the study laboratory. One hundred seventy-six positive or presumptive positive samples plus 625 negative qPCR samples were combined and retested using a pooling protocol. Pools consisted of 1 positive sample and 4 negative samples (1/5). These pools were processed using the same study laboratory protocols, and 96% of the positive samples were detected in these pools. Nested PCR followed by sequencing confirmed 175 of the 178 samples classified as positive or presumptive positive in the study laboratory as containing T. foetus–specific DNA.
Keywords
Introduction
Bovine trichomoniasis is a sexually transmitted infection caused by Tritrichomonas foetus resulting in significant monetary losses to the cattle industry worldwide where open range management and natural breeding are practiced.3,17,19 Bulls are the main carriers of T. foetus and remain asymptomatic for their entire life. 7 Tritrichomonas foetus is a flagellated protozoan that, in bovines, colonizes the preputial, uterine, and vaginal epithelium during coitus; colonization may result in vaginitis, cervicitis, endometritis, pyometra, early embryonic death, and abortion.2,9,16 At the time of publication, testing of resident and/or imported bulls is mandatory in Mississippi and all the states west of the Mississippi River except Iowa and Minnesota. Bulls testing positive for T. foetus must be culled and sent for slaughter to avoid further transmission of the disease. 21 In California 4 and Florida, 18 studies from 1990 and 2004, respectively, indicated a prevalence of approximately 16% and 30.4% in selected beef cattle herds where natural breeding was performed. In 2012, Texas 20 performed a large epidemiology study of T. foetus that sampled 31,202 bulls reported a prevalence of up to 5.5% during the summer (breeding) months. Given that bovine trichomoniasis has a serious economic impact on producers, and there appears to be a high incidence of T. foetus in natural breeding cattle production systems, a rapid, highly sensitive, and specific detection system for colonized bulls is crucial for trichomoniasis control programs.
The historical standard for diagnosis of T. foetus in bulls requires the collection of smegma by preputial wash or scraping of the preputial cavity and glans penis or preputial crypts with a dry insemination pipette, inoculation into specialized media capable of growing the flagellate, followed by culture for up to 7 days with daily microscopic examination. 3 Single culture microscopy has a reported sensitivity of 81–98% under suboptimal to optimal conditions.5,8,15 Specificity may also be compromised given the ability of other protozoa with morphology similar to T. foetus to be present in the bull’s prepuce.6,9 To increase the sensitivity of culture to 95% or more, it was calculated that 3 successive cultures, at least 7 days apart were necessary, 21 thus making this diagnostic process slow and expensive. Alternatively, many diagnostic laboratories and state regulatory agencies have modified and adopted a quantitative polymerase chain reaction (qPCR) 13 method that offers a rapid, quantitative, and more accurate detection system when compared to the classical microscopy method. In 2009, at the Parasitology Committee meeting of the American Association of Veterinary Laboratory Diagnosticians (AAVLD), 12 of the 14 states represented reported using cultured smegma samples collected and incubated in commercial pouches a in the performance of their T. foetus qPCR diagnostic testing (personal communication). The reported diversity in sample handling, preparation systems, and qPCR methodologies led the Parasitology Committee to suggest a study designed to address as many of these issues as possible. The assessment, standardization, and validation of a single reference method would be of benefit to cattle breeders, regulatory agencies, and diagnostic laboratories. Also, an interest in pooling of the T. foetus–cultured smegma samples had been expressed by industry, government, and diagnostic laboratories in order to save time, labor, and reagent costs in mandatory government eradication programs or when monitoring the status of bulls in clean herds (Parasitology Committee, AAVLD, personal communication).
The feasibility of pooling these samples for nucleic acid extraction and qPCR testing has not been well researched. Robust studies were needed to determine the number of individual samples and volumes of cultured smegma that could be pooled and still yield accurate positive identification of T. foetus–colonized bulls.
The specificity of the primers and probe outlined in 2006 13 and those commercially available b was brought into question with the suggestion that these primers may cross react with cultured smegma samples containing Simplicimonas moskowitzi (Schommer S, Younger S, Fales WH: 2011, Cross-reaction of Simplicimonas spp. trichomonads in Tritrichomonas foetus assays. In: Proceedings of the 54th Annual AAVLD Conference, p. 34). The Parasitology Committee suggested that smegma samples with high threshold cycle (Ct) values from different regions of the United States be evaluated for the presence of S. moskowitzi DNA. Thus, the objectives of the current study became 1) to compare the different sample preparation systems and various qPCR laboratory workflows with a study protocol utilizing a commercially available extraction and purification kit c and commercially available T. foetus real-time qPCR reagentsb,d,e; 2) to determine the effect of pooling a single positive sample, with a range of Ct values, with 4 negative samples using the same commercially available reagents; and 3) to assess the specificity of the commercially available primers and probe and those used by the various participating laboratories by developing a nested PCR (nPCR) reaction specific for T. foetus and S. moskowitzi and using it to test and sequence all positive (Ct < 38 cycles) and high Ct samples (Ct 38–40 cycles) to confirm the presence or absence of T. foetus or S. moskowitzi DNA within these samples.
Materials and methods
Sample collection and handling by participating laboratories
The Parasitology Committee of the AAVLD solicited laboratories that were offering T. foetus qPCR testing from across the United States in early 2011 as participants in this study. The following criteria for participation were required: 1) the laboratory protocol had to specify that up to 1 ml of the smegma culture media contents was utilized for the routine testing protocol, leaving at minimum 2 ml of the original test material for each sample; and 2) collected samples could either be a) incubated, within 4–5 hr postcollection, in the collecting veterinarian’s office or clinic at 37°C for a minimum of 24 hr to a maximum of 48 hr, then frozen at −20°C and shipped on ice overnight to the testing laboratory, referred to as frozen samples (FZ); or b) collected and shipped overnight at 18–37°C to the testing laboratory where the samples would then be incubated at approximately 35–37°C for 24–48 hr, referred to as not-frozen samples (NF). Five AAVLD-accredited laboratories with protocols that met the above criteria responded. Each laboratory was assigned a laboratory test code (A, B, C, D, and F). The participating laboratories, hereafter referred to as “feeder” laboratories, performed the routine extraction and qPCR testing on the submitted samples. All of the samples received in the feeder laboratories were in a commercially available collection and incubation pouch (IP). a The remaining volume in each IP was retained at refrigerator temperature. Each herd tested within a specific laboratory, as a unit on a single day, with at least 1 positive bull sample was assigned a sequential herd number (1, 2, 3, . . .). Each sample within that herd was assigned a sequence number in the order the samples were tested in the feeder laboratory. These study codes and numbers were added to the appropriate sample identifications on a copy of the test report from the laboratory. As qPCR-positive samples were detected in a feeder laboratory, the remainder of the material in each original IP for the positive sample and any herd cohorts tested on the same day (positive or negative) was remixed and aliquoted into 2 labeled screw-topped vials (approximately 1 ml per vial). The duplicate vials containing the remainder of each test sample were labeled with the assigned laboratory code, herd, and bull sequence numbers and then frozen at −20°C until shipped to the study laboratory. Feeder laboratories were requested to retain the identification of the positive samples and the cohort bulls, along with the testing protocol and the results of all testing, including controls, and Ct values for the test run that included these samples. Each laboratory was to forward the test results, codes and laboratory identification for each sample submitted, along with the testing methodology, to the study coordinator. When requested, the coded study samples were sent on dry ice to the study laboratory for testing. Figure 1 is a schematic of the above process.
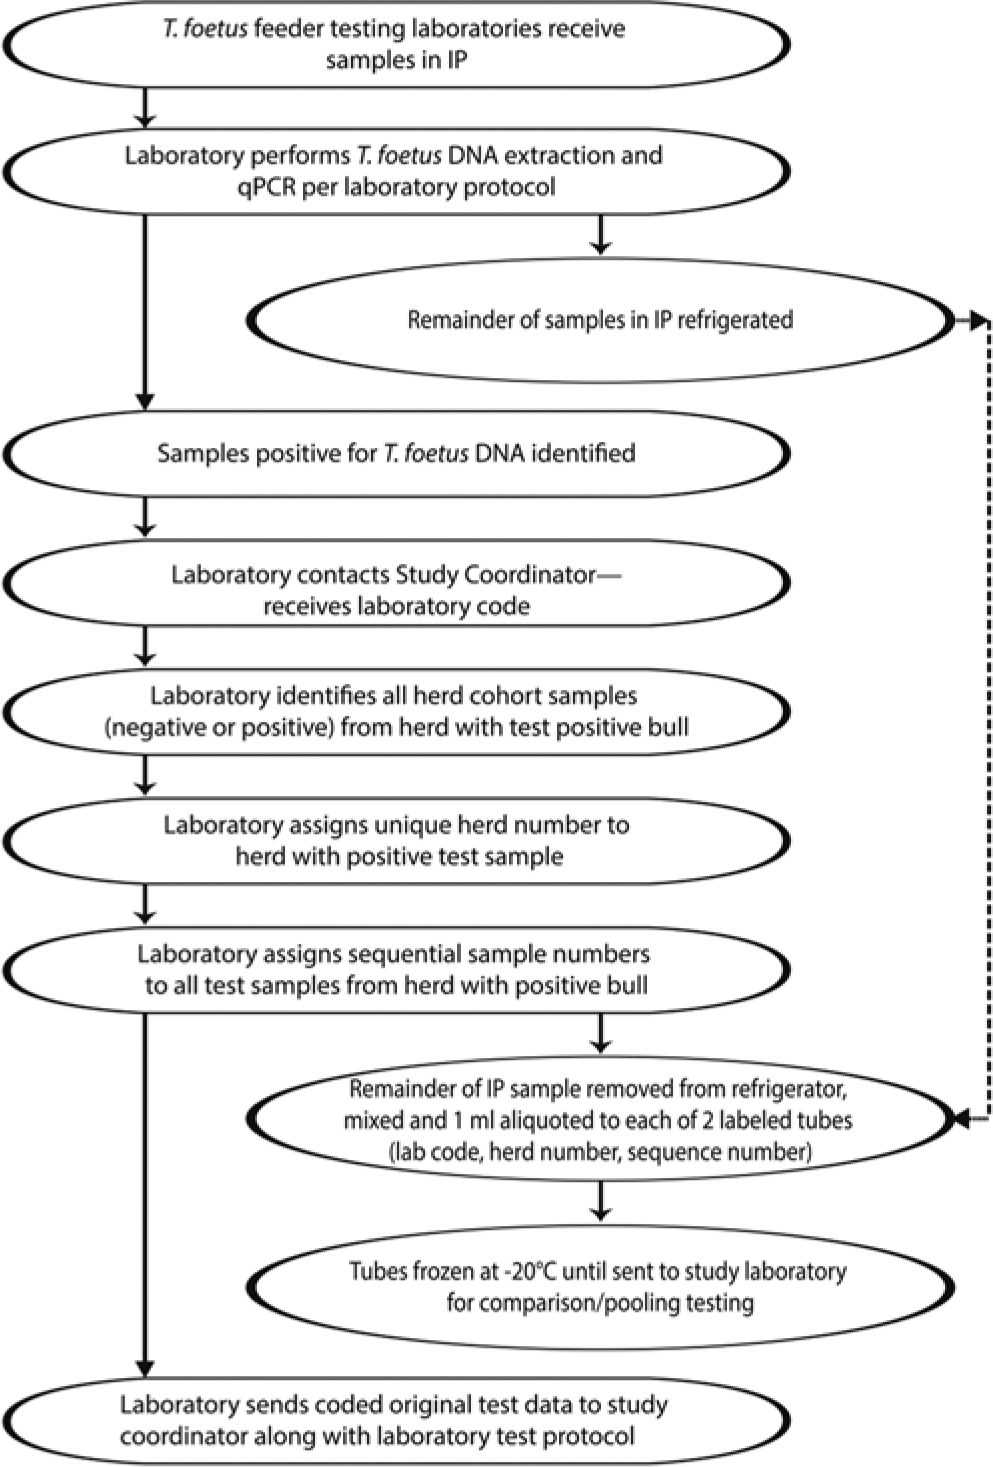
Flowchart for feeder laboratories for examination of smegma samples submitted in an incubation pouch (IP) for Tritrichomonas foetus.
Eight hundred three cultured smegma samples from multiple breeds were donated by the 5 blinded feeder laboratories from across the United States. Two of the laboratories were located in the western region, 2 from the southern section, and 1 from the midwestern section of the United States. Seven hundred forty-seven (93%) of the samples had experienced a single freeze-thaw cycle (NF) when tested in the study laboratory. The 56 FZ samples experienced 2 freeze-thaw cycles prior to testing in the study laboratory. Table 1 shows a summary of the samples received, including the qPCR testing classification, from each of the feeder laboratories.
Summary of samples submitted and Tritrichomonas foetus test results from feeder laboratories.*
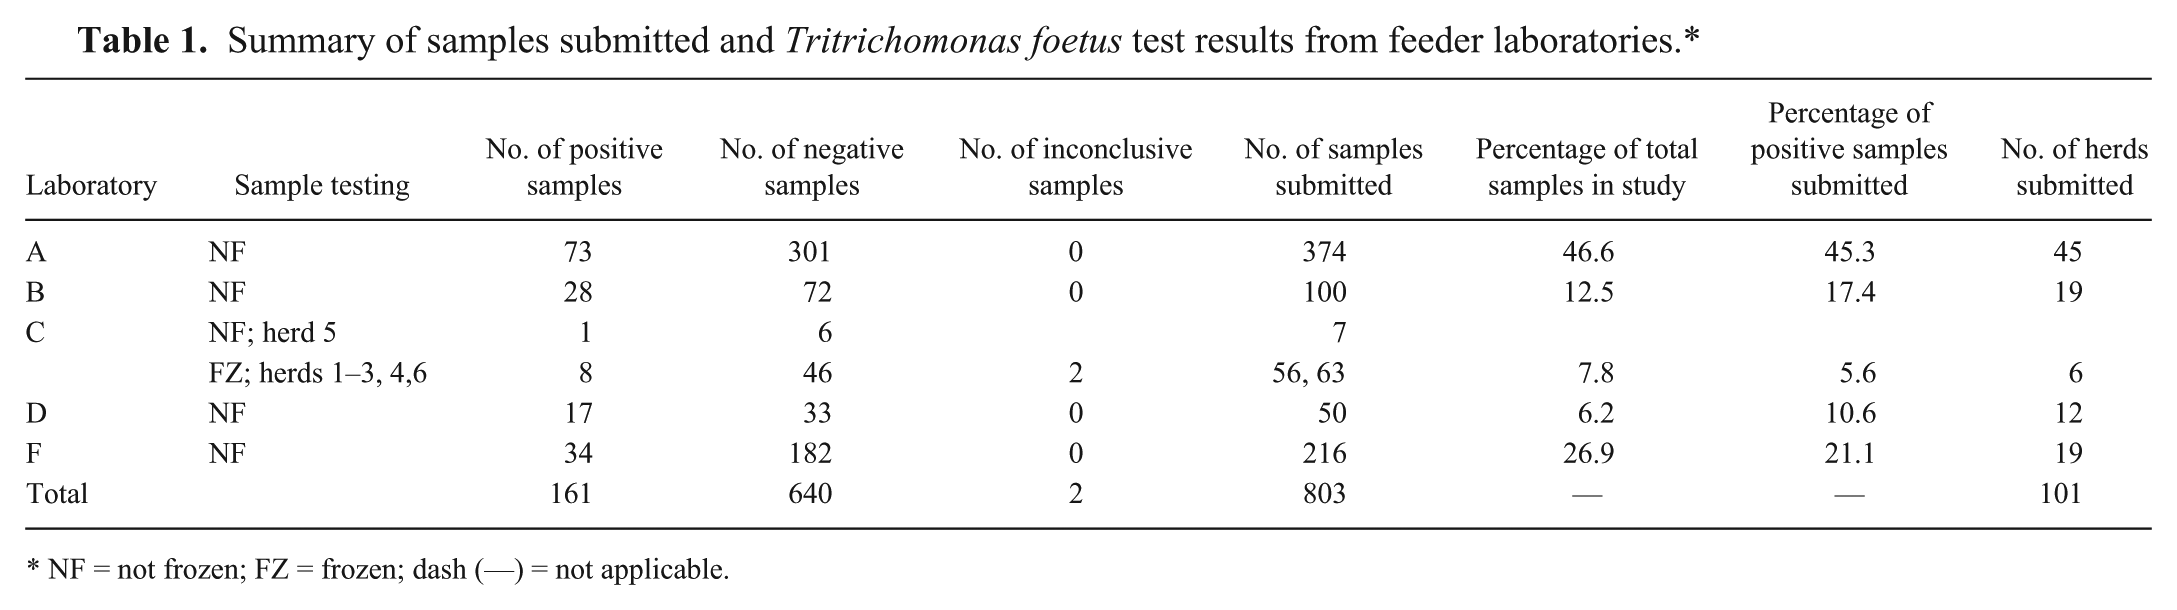
NF = not frozen; FZ = frozen; dash (—) = not applicable.
The testing protocol or outline, handling data, and diagnostic test result obtained by each feeder laboratory on each sample to be included in the study were sent to the study coordinator for this project, at the Animal Health Laboratory, Division of Animal Industries, Idaho State Department of Agriculture (Boise, Idaho). This information was kept blinded from the study laboratory until the individual sample qPCR testing had been completed in the study laboratory. The feeder laboratories shipped their frozen blinded samples on dry ice to the Kansas State Veterinary Diagnostic Laboratory (KSVDL; College of Veterinary Medicine at Kansas State University, Manhattan, Kansas), which served as the study laboratory.
Nucleic acid extraction and purification methods
Multiple workflow systems were utilized by the feeder laboratories to extract and/or purify DNA contained within the cultured smegma sample. The workflows consisted of 2 main sample preparation systems. Laboratories A, B, and D used boiling or heat-lysis methods for DNA extraction while laboratories C and F used commercial chemical extraction methods. Laboratory C used a viral RNA isolation kit, f and laboratory F used commercial columnsg,h for the extraction and purification processes.
Laboratories A and B removed 400 µl of the mixed cultured smegma from the IP a bag, spun the contents at approximately 5,000 × g for 3–5 min, decanted the supernatant, and resuspended the pellet in 800 µl of 1× phosphate buffered saline (PBS). The resuspended sample was re-spun for 3–5 min. The supernatant was again discarded and the pellet resuspended in 200 µl of nuclease-free water. Nucleic acid extraction was performed on the resultant suspension by boiling the sample in a water bath for 10 min followed by spinning the heated sample for 30 sec at approximately 1,400 × g and then cooling the extracted material on ice or in the refrigerator until used for qPCR testing. Both laboratories A and B utilized a known T. foetus–positive sample as their positive extraction control and nuclease-free water as their negative extraction control.
Laboratory C received its samples either as previously incubated and then frozen or as freshly collected smegma in IP a bags. The freshly collected samples were incubated in the testing laboratory for 48 hr at 37°C. After thawing, the frozen samples were processed in the same manner as those incubated in the laboratory. One ml of the mixed smegma sample was removed from the IP bag, centrifuged at approximately 3,500 × g for 3 min, and decanted; the pellet was then resuspended in 300 µl of PBS. An aliquot (100 µl) of the resuspended preparation was used as input for the extraction and purification f process as outlined by the manufacturer. An internal amplification control consisting of xeno DNA, supplied by the reagent manufacturer in the master mix reagents, d was incorporated into the lysis-binding reagent used in the extraction procedure. Laboratory C used an aliquot of a T. foetus organism that had been grown in IP media, standardized, aliquoted, and frozen as their positive extraction control. A frozen aliquot of uninoculated IP media was used as their negative extraction control.
The protocol of laboratory D required removal of 250 µl of the cultured smegma from the IP a bag into a predetermined well of a 96-well round bottom plate. The plate was then centrifuged at approximately 2,100 × g for 12 min, the supernatant aspirated and discarded, then 40 µl of PBS was added to the pellet. The pellet was resuspended in the PBS, and 40 µl was transferred to a V-bottom 96-well microtiter plate. The plate was capped and heated on a dry bath at 95°C for 10 min. After heating, the plate was centrifuged at approximately 2,100 × g for 20 min. The resultant supernatant was aspirated for passage through a 0.22-µm membrane filter plate. i The filtered aspirate was then centrifuged for 10 min at approximately 2,100 × g. If needed, the spun aspirate was stored at −20°C until used. Laboratory D used the ATCC (American Type Culture Collection) 30003 T. foetus strain as their positive extraction control and Trichomonas vaginalis ATCC 30001D as their negative extraction control on each extraction run.
Laboratory F used 200 µl of the cultured IP a material as the input for nucleic acid extraction. The initial sample preparation steps consisted of pipetting 20 µl of proteinase K (provided in the extraction kitg,h) into the bottom of a 1.5-ml microcentrifuge tube, adding 200 µl of the sample, and then adding 200 µl of buffer AL (provided in the kit) to the microcentrifuge tube. The tube was mixed by pulse-vortexing for 15 sec and then incubated at 56°C for 10 min. Following these original steps, the procedure outlined by the manufacturer for use of the columnsg,h was utilized for the remainder of the sample purification process. Laboratory F used a pure culture of T. foetus as their positive extraction control and nuclease-free water as their negative control.
The study laboratory received the 803 duplicate frozen aliquots of the cultured smegma samples from the 5 feeder laboratories. All of the samples were received and processed by the study laboratory utilizing the MagMAX pathogen RNA/DNA purification system c and qPCR testing run with VetMAX T. foetus qPCR reagentsb,d,e according to the manufacturer’s instructions included with the products (4462359 in search field, manuals, “Protocol: MagMAX pathogen RNA/DNA kit” and “Quick Reference Card: MagMAX Pathogen RNA/DNA kit for InPouch TF Culture” at http://www.invitrogen.com/site/us/en/home.html) and utilizing a magnetic particle processor j to automate this process. The funding and reagents for the study laboratory’s qPCR testing, including the pooling component, and for the nPCR and sequencing components of this study conducted at the Life Technologies Laboratory in Austin, Texas were provided by the manufacturer of the T. foetus products. The MagMAX pathogen RNA/DNA purification system and the VetMAX T. foetus qPCR reagents are intended to be packaged together by the manufacturer to be marketed as a test kit. For clarity throughout the remainder of this article, the reagents used by the study laboratory will be referred to as TF DNA kit reagents. The sample volume used in each extraction was 300 µl. The positive extraction control consisted of 20,000 copies per extraction of xeno DNA, d which was incorporated into the lysis-binding solution used with each sample. Two wells on each extraction plate, which contained the spiked lysis-binding solution, were loaded with 300 µl of PBS. The products of these wells served as positive extraction controls and also as the uninhibited amplification control wells for the xeno DNA.
Quantitative PCR methods
The feeder laboratories in the current study used various reagents and parameters for T. foetus qPCR testing. The sample, test, and reaction parameters of each laboratory are detailed in Table 2. All of the laboratories carried out the qPCR in a final reaction volume of 25 µl, all utilized Taq mixes, which contained 5-carboxy-X-rhodamine (ROX) as the passive reference dye used for normalization of the fluorescent reporter signal, and all used the same thermocycler k for performing the qPCR testing, with the exception of the first 2 herds, consisting of 25 samples, from laboratory C, which were run on a different machine. l
Testing parameters of participating laboratories.*
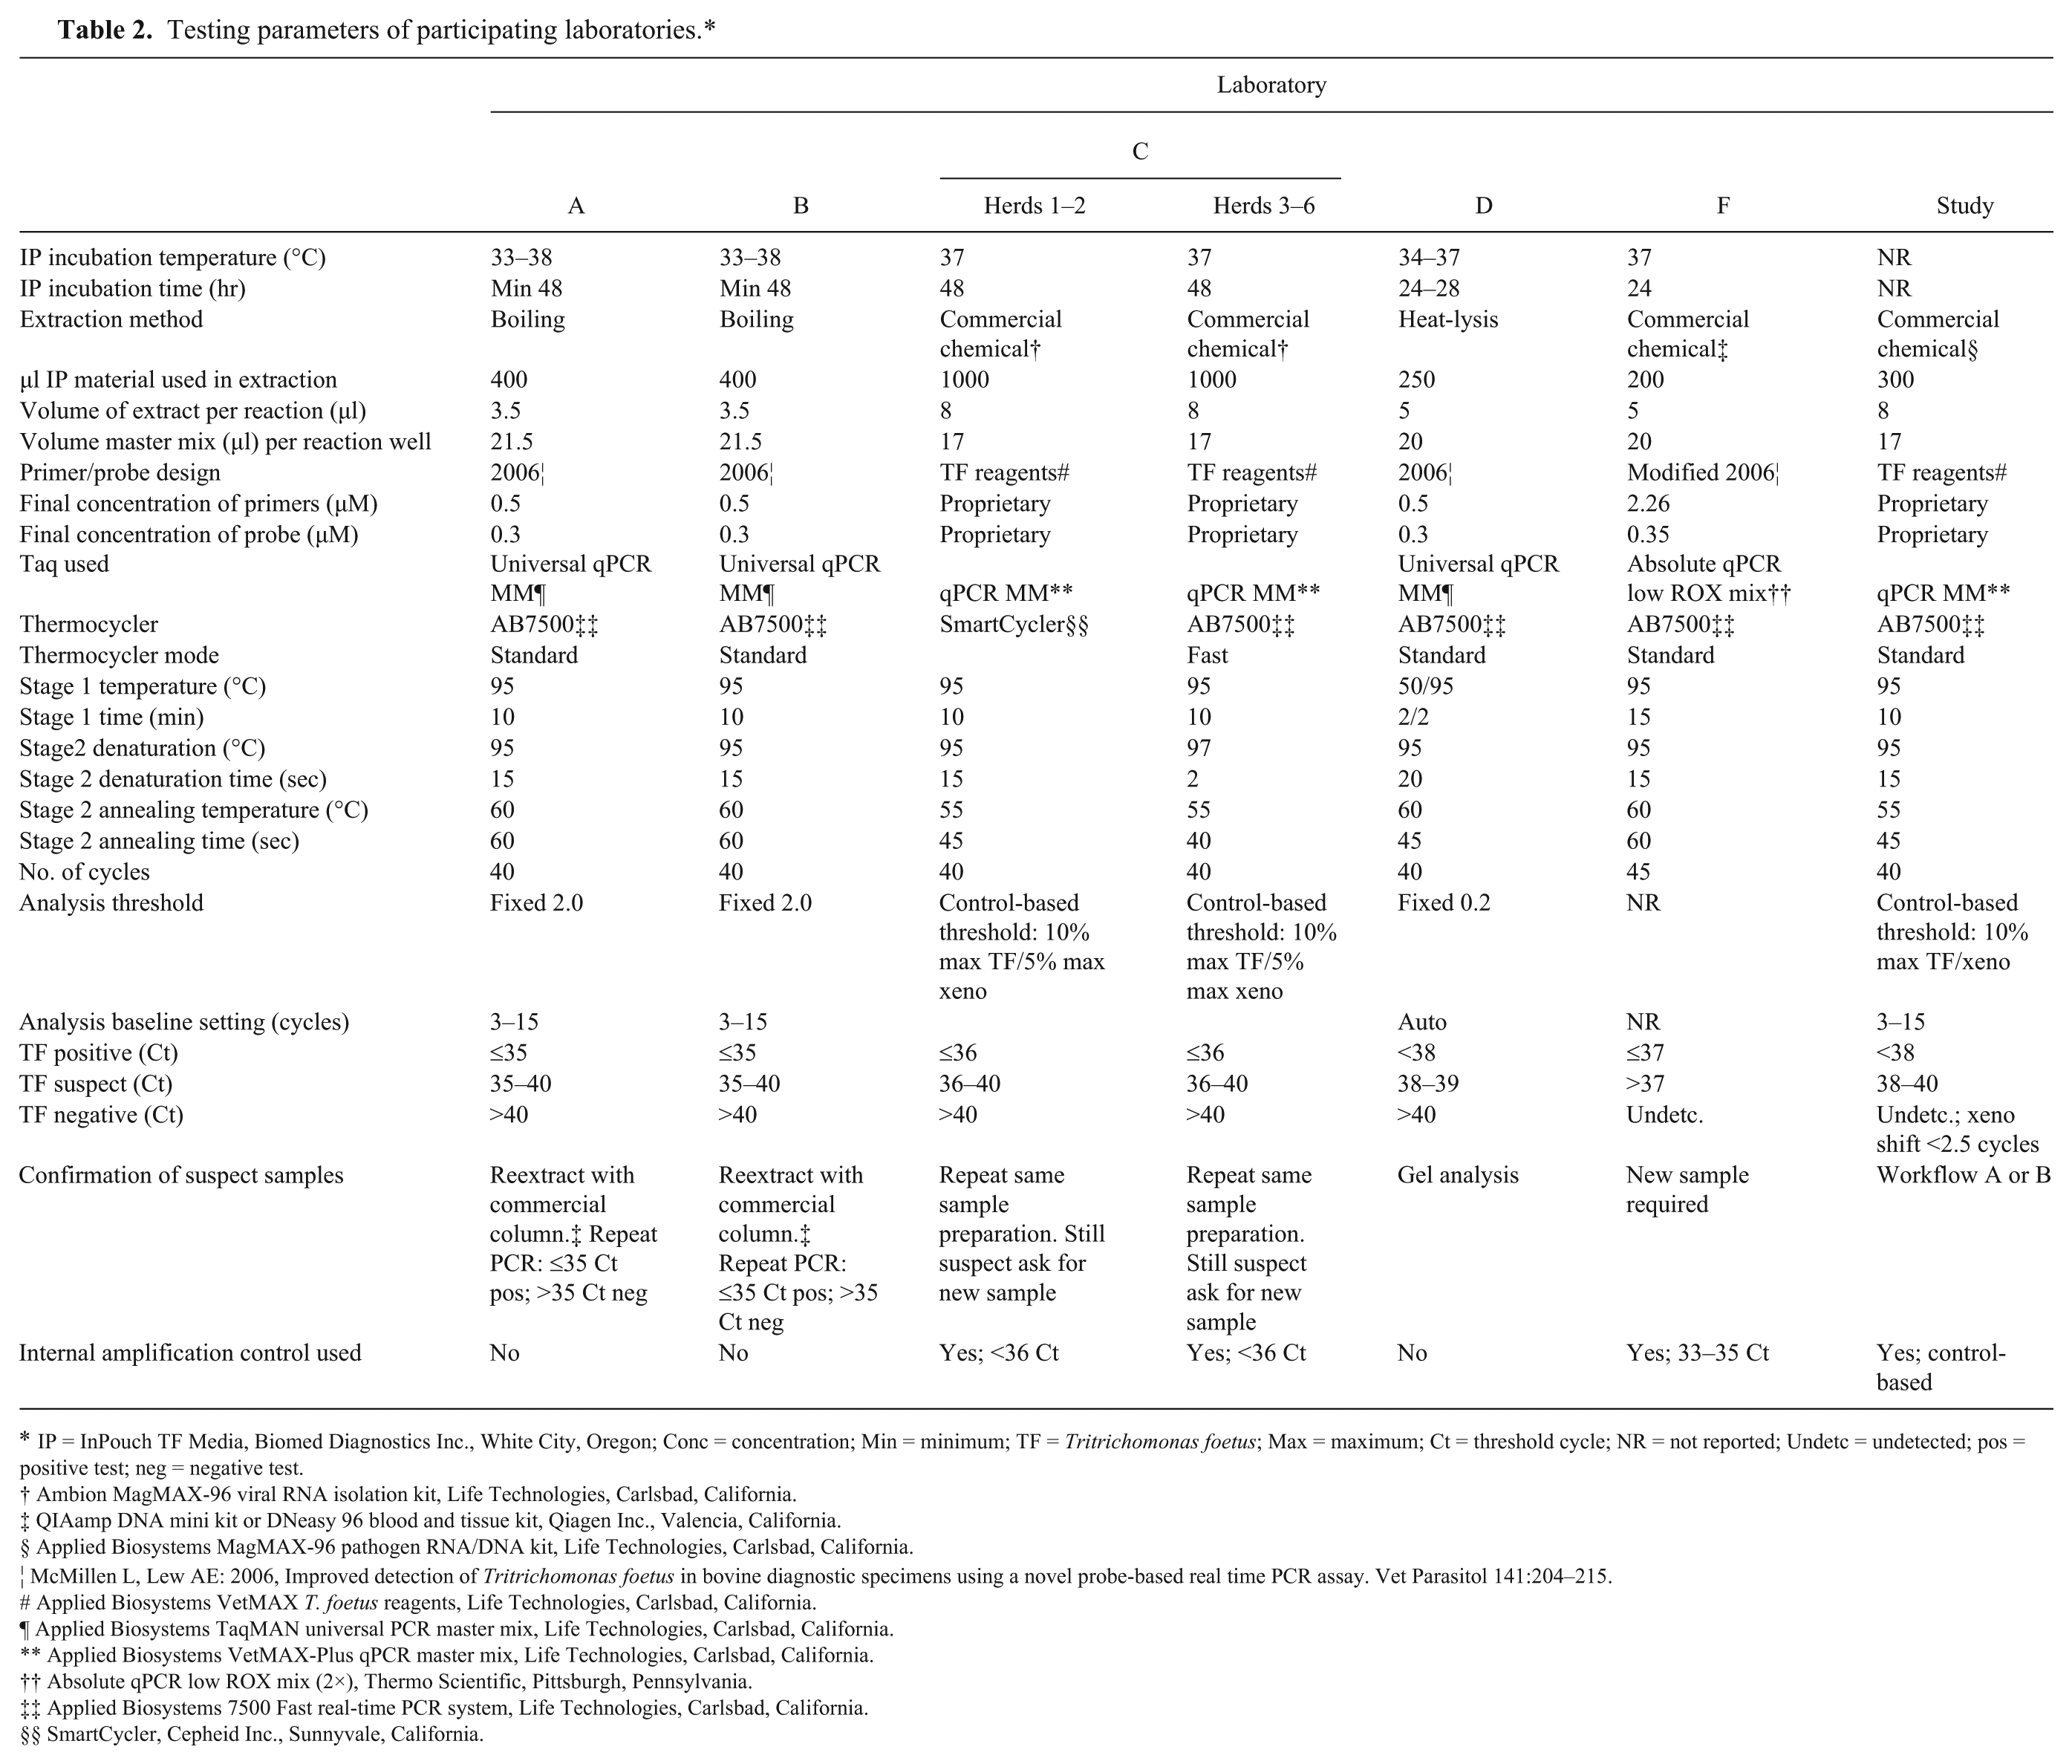
IP = InPouch TF Media, Biomed Diagnostics Inc., White City, Oregon; Conc = concentration; Min = minimum; TF = Tritrichomonas foetus; Max = maximum; Ct = threshold cycle; NR = not reported; Undetc = undetected; pos = positive test; neg = negative test.
Ambion MagMAX-96 viral RNA isolation kit, Life Technologies, Carlsbad, California.
QIAamp DNA mini kit or DNeasy 96 blood and tissue kit, Qiagen Inc., Valencia, California.
Applied Biosystems MagMAX-96 pathogen RNA/DNA kit, Life Technologies, Carlsbad, California.
McMillen L, Lew AE: 2006, Improved detection of Tritrichomonas foetus in bovine diagnostic specimens using a novel probe-based real time PCR assay. Vet Parasitol 141:204–215.
Applied Biosystems VetMAX T. foetus reagents, Life Technologies, Carlsbad, California.
Applied Biosystems TaqMAN universal PCR master mix, Life Technologies, Carlsbad, California.
Applied Biosystems VetMAX-Plus qPCR master mix, Life Technologies, Carlsbad, California.
Absolute qPCR low ROX mix (2×), Thermo Scientific, Pittsburgh, Pennsylvania.
Applied Biosystems 7500 Fast real-time PCR system, Life Technologies, Carlsbad, California.
SmartCycler, Cepheid Inc., Sunnyvale, California.
Laboratories A and B used an extract from a known positive culture of T. foetus as the positive amplification control and nuclease-free water as the negative template control on each thermocycler run. Laboratory C utilized the T. foetus controls e provided by the manufacturer in their qPCR methodology, to serve as the positive amplification controls for both T. foetus and xeno DNA, and nuclease-free water as the negative template control. Diagnostic test results were obtained by utilizing a control-based threshold calculation. Laboratory C used 10% of the average maximum fluorescence obtained from the in-house prepared positive extraction control to determine the cycle threshold at which the fluorescent signal in each test well for that run would exceed the baseline fluorescence setting for the T. foetus reporter dye. The laboratory used 5% of the maximum fluorescence obtained for the xeno reporter dye in the negative extraction control well as the baseline threshold for the internal positive control (xeno) in each test well. The xeno Ct value in each sample test well had to be less than 36 cycles for a valid test.
The positive extraction control for Laboratory D also served as the positive amplification control. The negative template control was Tris–ethylenediamine tetra-acetic acid buffer. m The positive extraction-amplification control needed a value of less than 38 cycles and the negative extraction-template control had to be negative for T. foetus DNA for a valid test run.
Laboratory F used a self-prepared primers and probe set that contained, within its base sequences, the same primers and probe outlined in 2006. 13 The laboratory included exogenous internal positive control reagents and DNA n in the qPCR reaction mixture. Laboratory F did not report on the baseline or analysis settings. The laboratory ran qPCR reactions for 45 cycles versus 40 cycles for the other laboratories. The qPCR controls used consisted of the purified genomic DNA from the control T. foetus organism (positive amplification control) and nuclease-free water (negative template control). This laboratory did not utilize a suspect or inconclusive range for their test samples. If a test sample generated a Ct of greater than 37 cycles but less than 45 cycles it was declared equivocal and a new sample was requested for extraction and testing. The internal positive control result had to be between 33 and 35 cycles for a test to be considered valid.
The study laboratory utilized the TF DNA kit qPCR reagentsb,d,e to perform qPCR testing. The TF DNA kit uses the previously reported 13 design with further optimization of primer and probe concentrations and the addition of an internal positive control. The final reaction volume was 25 µl, and the reaction mix contained 1 µl of the supplied 25× T. foetus primers and probe, b 12.5 µl of the 2× qPCR master mix, d and 3.5 µl of nuclease-free water per reaction well. Eight microliters of the purified sample extract was added to each reaction well. Six wells on each reaction plate were used for control samples: 2 wells were loaded with 8,000 copies of the T. foetus and xeno DNA positive control, e which served as the positive amplification controls; 2 wells were loaded with 8 µl of nuclease-free water, which served as the negative template control; and 2 wells were loaded with the 2 negative extraction control well products, described in the previous section. The study laboratory also used a control-based threshold method for setting their analysis threshold. This was calculated by determining 10% of the average maximum fluorescent value at cycle 40 for the positive amplification control wells, containing the fixed number of copies of both the T. foetus and xeno DNA. Additionally, the average xeno Ct value obtained from the 2 extraction control wells on each plate was calculated. The difference in the xeno Ct value between each test sample well and the average value of the extraction control wells was calculated, and this difference was referred to as the xeno shift value for each test sample. The xeno shift value could be either positive or negative.
Study laboratory workflows for samples with T. foetus high Ct values or samples demonstrating inhibition of DNA amplification
The study outline required that samples with qPCR test results for T. foetus DNA having Ct values between 38 and 40 cycles in the study laboratory be further tested to determine if additional qPCR testing might reliably and economically determine if such samples truly contained T. foetus DNA. Samples meeting this criteria and which did not exhibit inhibition of the DNA amplification process, as determined by the internal amplification control value within the well (xeno shift value <2.5 cycles), were subject to further testing as outlined in workflow A of Figure 2. Samples tested in this workflow had a total of 1,200 µl of the original cultured smegma sample tested in an attempt to detect low numbers of target DNA in the sample.
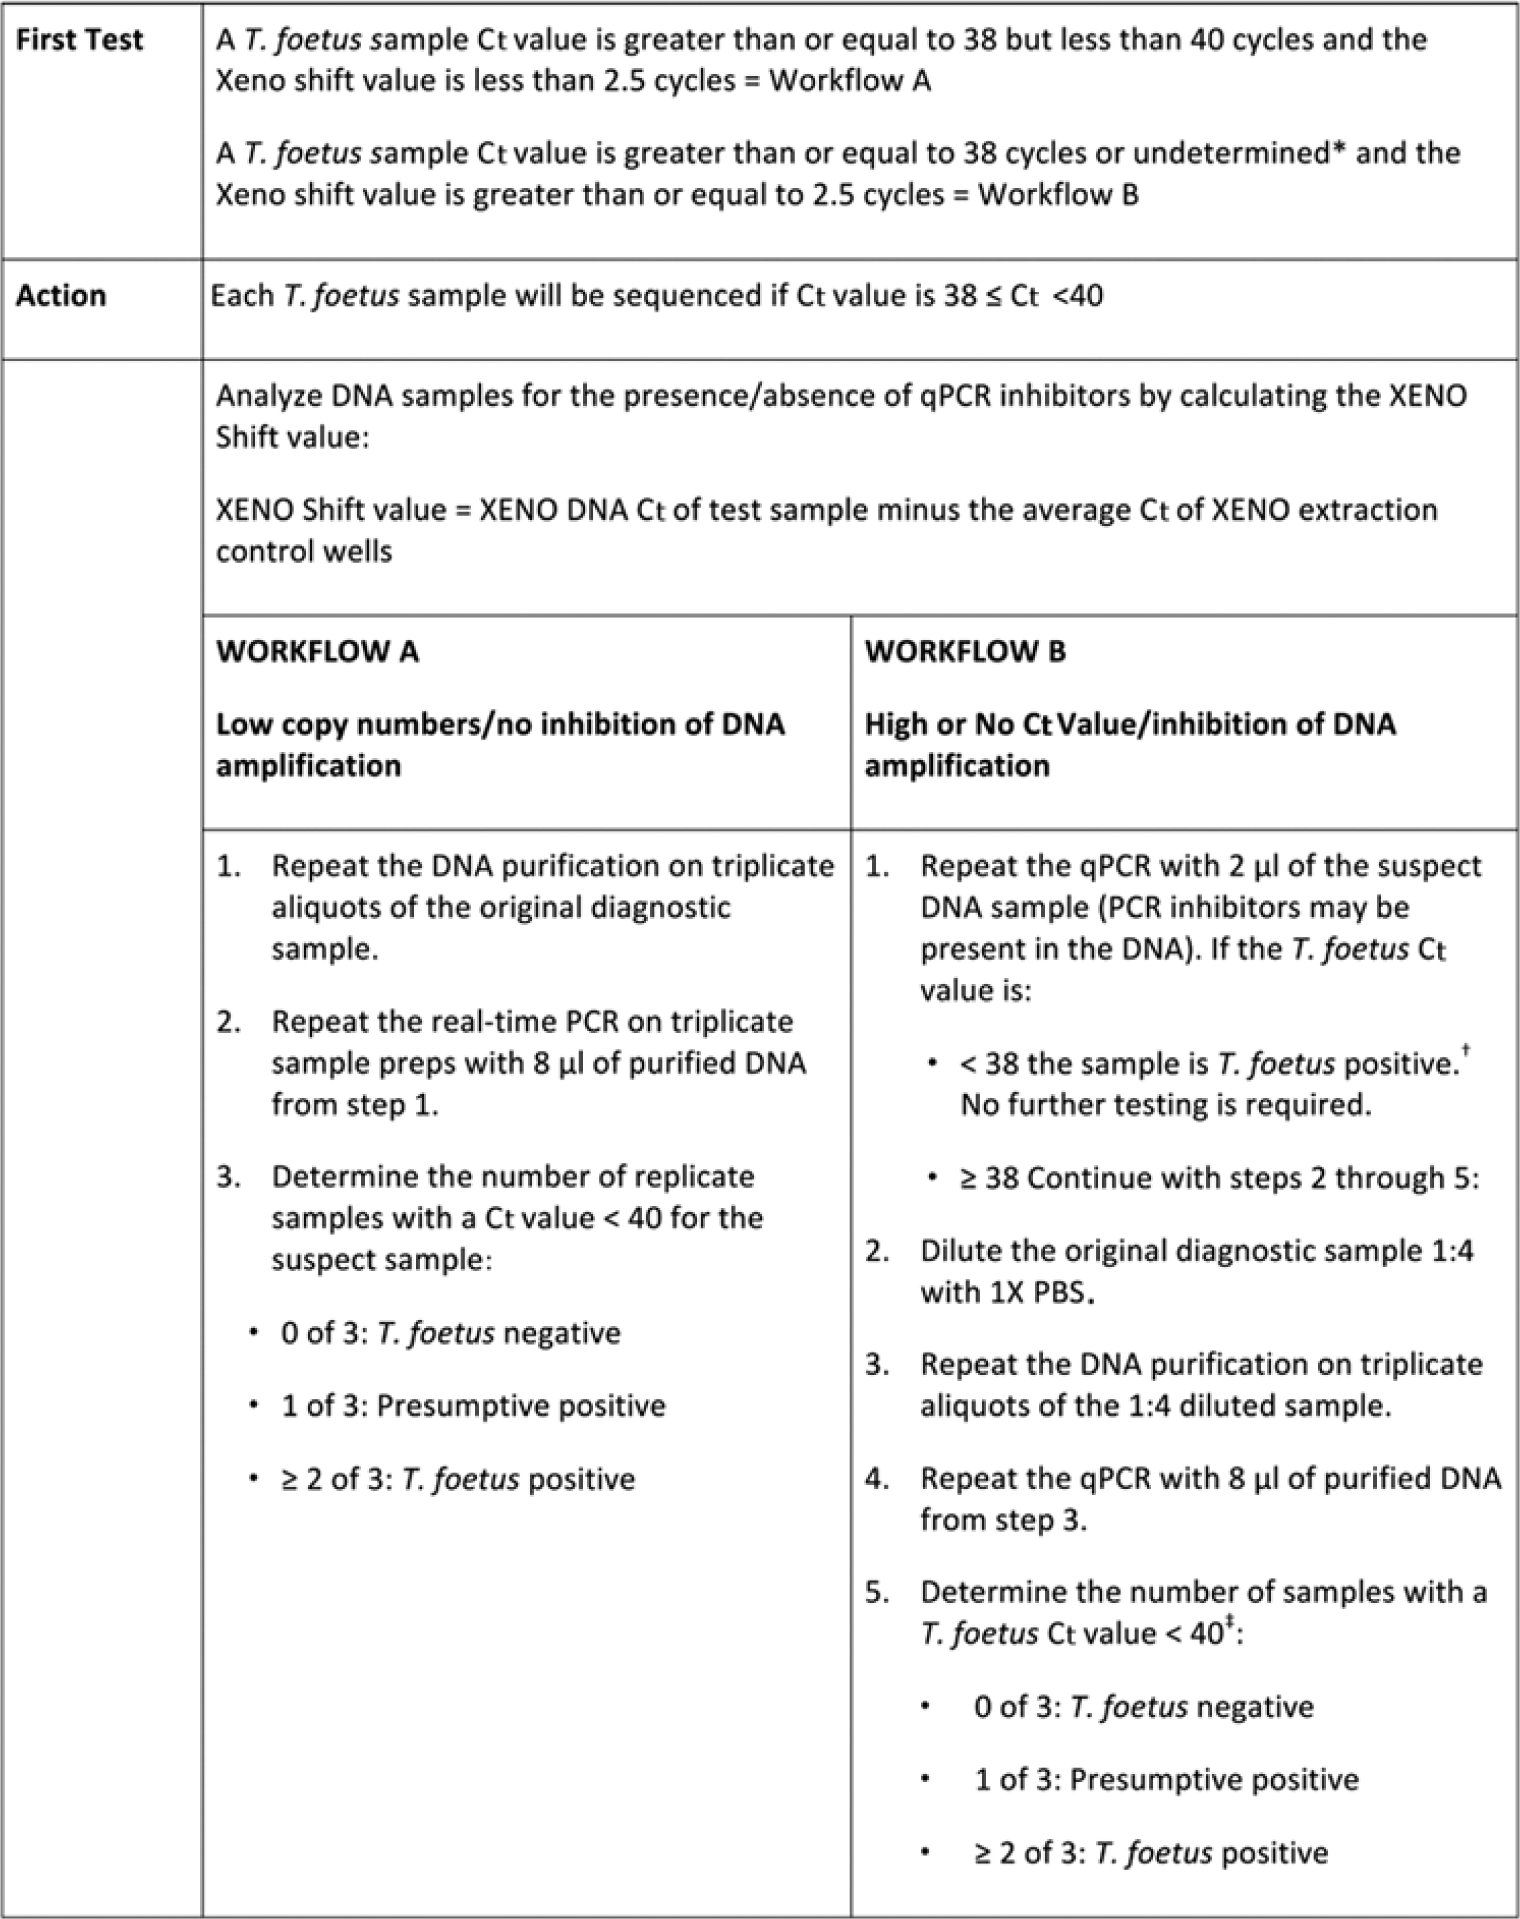
Study laboratory workflows used on samples that showed DNA inhibition or which showed a high threshold cycle (Ct) value in tests for Tritrichomonas foetus. *Ct values equal to 40 will have the result indicated as “undetermined” on the AB7500 instrument.k †The xeno Ct value on diluted samples is not considered utilizing this workflow. ‡The Ct for a positive or presumptive positive test was moved to anything less than 40 cycles due to the sample dilution.
As part of the study design, any sample with a T. foetus DNA Ct value greater than or equal to 38 cycles or any sample with no T. foetus DNA detected by qPCR, which demonstrated a decreased ability to amplify DNA in the qPCR reaction, as demonstrated by no amplification of the internal control DNA, would be diluted and retested by qPCR to determine if this approach would decrease or eliminate the inhibitory factors within the sample preparation. All such samples were retested according to the protocol in workflow B of Figure 2.
The TF DNA kit manufacturer supplies, as an addition in their master mix, d a xeno DNA control, which contains 10,000 copies per µl of xeno, a synthetic DNA transcript with a unique sequence that lacks homology to currently annotated biological sequences. The manufacturer recommends the xeno control DNA be added to the TF DNA kit extraction c lysis-binding solution to serve as a positive control for the recovery of DNA in the extraction process. In the current study, 20,000 copies of the xeno control DNA were incorporated into each sample’s extraction solution. The product of the 2 extraction control wells, described above, when used as template in the qPCR reaction, served to verify that DNA had not been degraded in the extraction process and also served as the basis for determining the expected xeno Ct value of a noninhibited (no template) sample preparation. The xeno Ct values obtained from the 2 extraction control wells were averaged, and this average Ct value was then used as the set point from which the test sample wells would be evaluated for inhibition of DNA amplification. It was arbitrarily decided to set the maximum variation from the set point at 2.5 cycles. Samples with xeno Ct values that deviated 2.5 cycles or more from the mean xeno Ct of the extraction control wells value would then be further evaluated using workflow B. The value obtained by subtracting the sample xeno Ct from the mean set point xeno Ct value was referred to as the xeno shift value. In an attempt to dilute out any inhibitors contained in samples with xeno shift values of 2.5 or more, the original sample extract would be retested using only 2 µl of the extract in an additional qPCR reaction. Six microliters of nuclease-free water was added to this reaction well to keep the final reaction volume at 25 µl. If this dilution test did not produce a T. foetus DNA Ct value of less than 38 cycles, the original sample material was retested after diluting it 1:4 with PBS. A total of 225 µl of the cultured smegma sample was added to 675 µl of PBS to make the dilution. Triplicate aliquots of this diluted sample were then extracted using the procedure outlined above, and 8 µl of each of these DNA preparations was then used as input into separate qPCR reaction wells. Any sample having a T. foetus DNA Ct of less than 40 cycles on any of these triplicate dilution tests was classified as either a positive or presumptive positive in this workflow, depending on the number of triplicate tests having T. foetus DNA detected. A total of 525 µl of each original cultured smegma sample was utilized in completion of workflow B. The study design required any sample having aT. foetus DNA Ct value of less than or equal to 40 cycles in the study laboratory, regardless of whether it was detected and classified as positive in the first test or was identified after the repeat testing in the above workflows, to be tested with the nPCR primers specific for T. foetus and S. moskowitzi and have the product of the nPCR sequenced in an attempt to identify the sequences responsible for producing the high Ct values.
Pooling methodology
In the pooling component, both T. foetus qPCR–positive and –negative cultured smegma samples were combined in a final volume of 300 µl. Pools of 1 positive with 4 negative samples (1/5) and 1 positive with 2 negative (1/3) were created from T. foetus–positive and presumptive positive samples, identified in the study laboratory, all of which were confirmed as containing T. foetus DNA by sequencing, with the exception of a single sample that tested positive by qPCR in both the feeder and study laboratories but did not react with the nPCR primer sets used in sequencing. The DNA extraction and purification was carried out with the TF DNA extraction kitc in a 96-well magnetic particle processor. j Individual cultured smegma samples (60 µl/sample) were added to a single well of a deep well extraction plate thus creating a pool of 5 test samples consisting of 1 test positive and 4 test negative samples. The negative samples (n = 625) were used to construct the positive (n = 176) and negative (n = 50) pools. Two samples that were PCR presumptive positive in the study laboratory by workflow B, but were negative for T. foetus DNA when sequenced, were not included in the pooling component of the study. The total number of positive pools created from samples obtained from each testing laboratory was as follows: laboratory A, 77; laboratory B, 31; laboratory C, 13; laboratory D, 21; and laboratory F, 34. The pools were constructed using only positive and negative samples obtained from the same laboratory. In constructing the pools, laboratory F was the only submitting laboratory with enough negative samples to complete all 34 positive pools without reusing any negative samples. For the other laboratories, some of the negative samples were used multiple times to complete the construction of the positive pools for those laboratories. The negative pools (n = 50) were constructed using samples from laboratories A and F, where the greatest number of negative samples was found. Thirty-four pools consisting of 1 positive and 2 negative test samples were also created and tested using individual cultured smegma samples with T. foetus Ct values greater than or equal to 33 cycles. In this pooling strategy, 100 µl of each of the individual smegma samples was added to a single well of a deep well extraction plate, thus creating a pool consisting of 1 positive and 2 negative samples in a total volume of 300 µl. Lastly, 1/3 negative pools were also constructed (n = 34) where 100 µl of 3 negative test samples were pooled. Real-time PCR was carried out in the study laboratory with the same conditions and reagents previously described for that laboratory.
Nested PCR and DNA sequencing methodology
DNA sequencing involved the development of nPCR primers with the ability to amplify both T. foetus and S. moskowitzi, if present, in positive or high Ct value samples. Nested PCR was carried out in the Life Technologies Laboratory in Austin, Texas. Primer design for PCR and sequencing was performed using T. foetus and S. moskowitzi sequences found in GenBank with accession numbers AY349189.1 (T. foetus strain KV1 internal transcribed spacer 1, partial sequence) and GQ254636.1 (S. moskowitzi 16S-like ribosomal RNA gene, partial sequence; transcribed spacer 1, 5.8S-like ribosomal RNA gene), respectively. The primers sequences were as follows: forward outer primer (O-F-TFSM-primer): CCTTAGGCAATGGATGTCTTGGC; reverse outer primer (R-TFSM-primer): GCGCAATGTGCATTCAAAG; M13 forward inner primer (M13-I-F-TFSM-primer): TGTAAAACGACGGCCAGTCTTACACGATGAAGAACGTTGC; and M13 reverse inner primer (M13-R-TFSM-primer): CAGGAAACAGCTATGACCGCGCAATGTGCATTCAAAG.
The first PCR amplification of 113 base pairs (bp) was generated with the forward primer (O-F-TFSM-primer) and reverse primer (R-TFSM-primer) containing 100% sequence homology for T. foetus and S. moskowitzi. The second PCR amplicon of 88 bp was obtained with a forward inner primer (M13-I-F-TFSM-primer) and reverse primer (M13-R-TFSM-primer) with M13 primer extensions. First and second PCR reactions were carried out in a final volume of 50 µl with a high fidelity PCR system o containing 2 µl of each primer at 0.9 µM final concentration, 4 µl of a 10 mM solution of deoxyribonucleotide triphosphate mix, 5 µl of 10× buffer, 0.5 µl of enzyme mix, o and 28.5 µl of nuclease-free water. The template (8 µl of purified DNA) was added to the reaction mixture. Thermocycling conditions for all PCR reactions were as follows: 94ºC for 2 min, followed by 35 cycles of denaturation at 94°C for 15 sec, annealing at 55ºC for 30 sec, and extension at 72ºC for 45 sec. A final extension was performed at 72ºC for 7 min. Cleanup of the first PCR product was carried out with a PCR product cleanup system p in a final volume of 2.2 µl, containing 1.2 µl of the cleanup reagent and 1 µl of the first PCR product. Incubation was carried out at 37ºC for 15 min to degrade the remaining primers and nucleotides and 80ºC for 15 min to inactivate the cleanup reagent. The second PCR was carried out with the same PCR reagents but used 1 µl of the cleaned product and sequencing M13 primers, mixed with 7 µl of nuclease-free water; this 8 µl was used to load the second PCR reaction mixture. The PCR and incubation conditions were carried out in a PCR system machine. q Forward and reverse M13 primers were used for sequencing reactions on a genetic analyzer r by a commercial sequencing service. s
Statistical analysis
Statistical analysis for the current study consisted of measuring the agreement between the results of the feeder and study laboratories. The data for this analysis was categorical (positive and negative results), and Cohen kappa coefficient was calculated across various laboratory techniques to determine whether any agreement was significant or purely due to chance. The kappa coefficient is standardized to lie on a scale between −1 and 1. All calculations were run in R, an open source computing language providing a wide range of statistical and graphical techniques (http://www.r-project.org/).
Results
Tritrichomonas foetus testing of individual samples at feeder laboratories
Eight hundred three samples that met the criteria for inclusion into the study were received from the feeder laboratories. The first qPCR test on these samples, performed in the feeder laboratories using their test protocols and reagents, generated 161 positive, 640 negative, and 2 inconclusive samples. Inconclusive test results were designated as positive tests when comparing the qPCR tests between laboratories.
Tritrichomonas foetus testing of individual samples at the study laboratory
The study laboratory, utilizing the study protocol and workflow designs outlined above, identified 175 positive test samples, 625 negative test samples, and 3 samples that were classified as presumptive positives. The study laboratory identified 21 samples as positive that the feeder laboratories had classified as negative for T. foetus DNA, 2 samples as positive that the feeder laboratory had determined were inconclusive test results, 3 samples as presumptive positives that had been classified as negative by the feeder laboratories, and was unable to detect T. foetus DNA in 9 samples that the feeder laboratories had classified as positive. There were 35 samples (4.4%) of the 803 samples tested with discrepant test classifications between the feeder laboratories and the study laboratory. The study laboratory and the feeder laboratories agreed on the classification of 152 positive samples and 616 negative samples.
Workflow A results
Nine samples, which were classified as negative in the feeder laboratories, had T. foetus DNA detected in the study laboratory above the cutoff value for a positive test, with Ct values between 38 and 40 cycles. These samples met the criteria for retesting in workflow A. These samples did not demonstrate inhibition of DNA amplification (xeno shift value <2.5). On completion of the additional testing in workflow A, 1 sample had all 3 of the triplicate retests positive, with Ct values of 38.6, 38.6, and 39.1, respectively, and had a final classification in the study laboratory as a positive test. One sample had 2 of the 3 retests positive with Ct values of 38.0 and 39.4, respectively, and was also classified as a T. foetus-positive test. The third sample had only 1 of the 3 retests positive with a Ct value of 38.9 and was classified as a presumptive positive by the study laboratory. The remaining samples (n = 6) tested with workflow A were qPCR test negative in the triplicate re-extractions and repeat qPCR testing used in workflow A, and were classified as negative test samples for the study laboratory. Each sample requiring workflow A had a total of 4 extractions and 4 qPCR tests run in the study laboratory.
Workflow B results
In the study laboratory, workflow B was utilized for 50 samples that had demonstrated high levels of inhibition of DNA amplification (xeno shift values ≥ 2.5). No T. foetus DNA was detected in these 50 samples by initial qPCR testing in either the feeder or study laboratories. Of the 50 samples, 32 (64%) originated from laboratory A, 4 (11%) were from laboratory B, 3 samples (6%) were from laboratory D, and 11 (22%) came from laboratory F. The xeno DNA Ct for these 50 samples ranged from 32.6 to 38.4 cycles, and the xeno shift ranged from +2.52 to +6.32. When retested by qPCR using only 2 µl of the original sample extract, according to the workflow outline, none of these 50 samples had T. foetus DNA detected in this test. The original cultured smegma samples were then diluted 1:4 with PBS. Three hundred microliters of the diluted sample was used in 3 separate extractions. These reextracted, diluted sample preparations were then retested by qPCR. Forty-eight of the 50 samples had no T. foetus DNA detected on the diluted triplicate qPCR tests and were considered negative for T. foetus DNA in the study laboratory. Two samples, each with one of the triplicate diluted tests positive for T. foetus DNA, with Ct values of 39.6 and 39.8 cycles, respectively, were classified as presumptive positive tests in the study laboratory. These 2 presumptive positive samples were designated, in the present study, as positive test calls for the study laboratory’s qPCR testing.
Statistical comparison of feeder laboratory and study laboratory qPCR test results
The overall observed agreement in qPCR test classifications between the feeder laboratories and the study laboratory was 95.89%. The corresponding kappa coefficient, which measures the discrepancies of the observed agreement and the expected agreement due to pure chance, was 0.88. Table 3 summarizes the statistical results obtained at the various feeder laboratories compared to the qPCR results obtained at the study laboratory. The P values reported in Table 3 are based on the null hypothesis that the agreement between feeder and study laboratories in the population is purely due to chance (H0: kappa = 0). The test statistic under the null hypothesis is assumed to follow a standard normal distribution. The P values from Table 3 are all <0.0001 and indicate that the null hypothesis can be rejected in favor of the alternative hypothesis that the estimated kappa coefficient is not due purely to chance (i.e., there is strong statistical evidence that the agreement between the feeder and study laboratories was not due to chance but to other factors). Laboratories using boiling or heat-lysis for their sample preparation and extraction had an overall agreement of 94.27% (kappa = 0.84) with the study laboratory results, and those using a commercial chemical extraction had a combined 98.92% agreement (kappa = 0.96) with the study laboratory results.
Results of real-time polymerase chain reaction testing and percentage agreement between the feeder and study laboratories.*
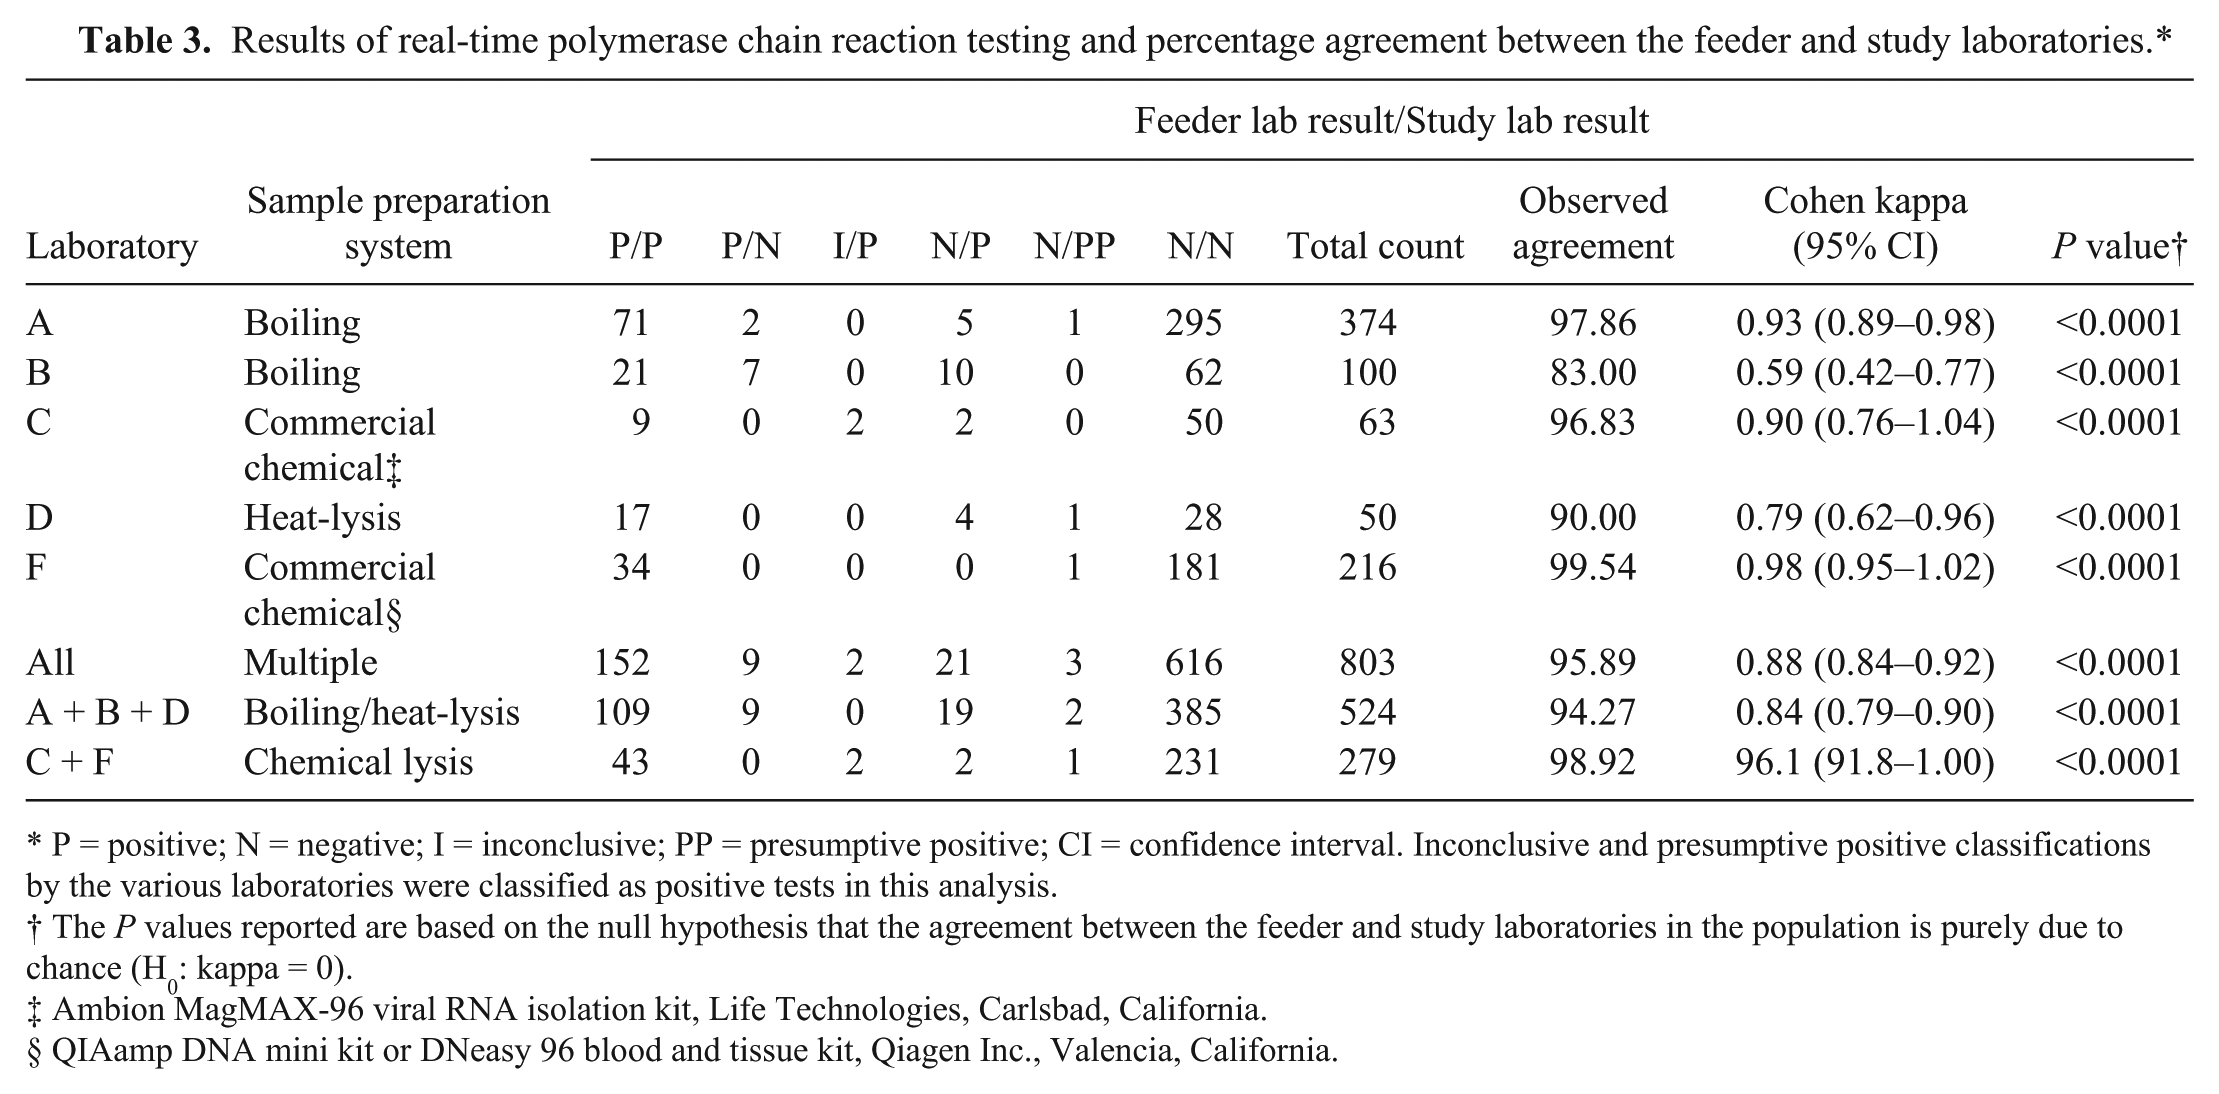
P = positive; N = negative; I = inconclusive; PP = presumptive positive; CI = confidence interval. Inconclusive and presumptive positive classifications by the various laboratories were classified as positive tests in this analysis.
The P values reported are based on the null hypothesis that the agreement between the feeder and study laboratories in the population is purely due to chance (H0: kappa = 0).
Ambion MagMAX-96 viral RNA isolation kit, Life Technologies, Carlsbad, California.
QIAamp DNA mini kit or DNeasy 96 blood and tissue kit, Qiagen Inc., Valencia, California.
Pooling results
One hundred seventy-six positive pools consisting of 1 test positive sample and 4 test negative samples were constructed utilizing the samples that tested positive for T. foetus by qPCR in the study laboratory. One hundred sixty-two of these pools (92%) were constructed containing individual samples having Ct values of less than 35 cycles. All of these sample pools were qPCR test positive. Eleven pools were created using individual positive samples having Ct values between 35 and 38 cycles. Seven (63.6%) of these 11 samples were detected in the 1/5 pools. Three additional pools were created using individual samples with T. foetus DNA Ct values above 38 cycles. None of these 3 sample pools were detected by qPCR. All 50 of the pools constructed using negative qPCR samples were negative by qPCR testing. Of the 176 positive pools tested in a 1/5 dilution, qPCR detected 169 (96.02%).
The 34 pools created by combining a single positive sample with 2 negative samples in a 1/3 dilution pool produced the following results: the 20 pools created with individual samples having T. foetus DNA Ct values of 33–35 cycles were all positive by qPCR testing, 8 (72.7%) of the 11 pools created using individual samples with T. foetus Ct values of 35–38 cycles were detected, and none of the 3 pools created utilizing the individual cultured smegma samples with Ct values above 38 cycles were detected by qPCR testing. All 34 pools constructed using 3 negative samples were all qPCR negative. Only 1 additional pool was detected when the same samples were tested in a 1/3 as compared to a 1/5 pool. This increased the sensitivity of the 1/3 pools to 96.4% versus 96% for the 1/5 pools.
Nested PCR and sequencing results
One hundred seventy-three samples with T. foetus DNA Ct values of less than 38 cycles were detected on the first qPCR test run in the study laboratory, and an additional 2 positive samples were detected after testing in workflow A. Three samples were classified as presumptive positive tests by qPCR. One was detected by use of workflow A and 2 by workflow B. One hundred seventy-two of the 173 positive samples with qPCR Ct values less than 38 cycles were confirmed positive by nPCR and sequencing for T. foetus DNA. One positive sample, with a T. foetus Ct of 33.95 cycles and no signs of inhibition (xeno shift value of 0.95), which was also classified as positive by the feeder laboratory, did not produce results when amplified, on repeated attempts, with the T. foetus and S. moskowitzi sequences in the nPCR reaction and was classified as a negative sample in the sequencing component of this study. The 2 additional samples identified in workflow A as positive by qPCR were also positive for T. foetus DNA by nPCR and sequencing. Only 1 of the presumptive positive tests, the one identified in workflow A, was positive by sequencing; the remaining 2 presumptive positive tests identified by workflow B were negative for both T. foetus and S. moskowitzi DNA by nPCR followed by sequencing. The 6 additional samples tested in workflow A, with T. foetus DNA Ct values of 38–40 cycles and showing no DNA amplification inhibition, which were classified as negative tests by qPCR in the study laboratory, were all negative for T. foetus and S. moskowitzi DNA when nPCR and sequencing was attempted.
Of the 35 samples having discrepant test results between the feeder laboratories and the study laboratory, 5 were identified using either workflow A or B and are reported above. Included in the remaining 30 samples were 9 that were classified as positive by the feeder laboratories but were test negative in the study laboratory. These 9 samples were included in an additional 50 study laboratory qPCR test negative but were chosen to be tested by nPCR and then sequenced to verify the specificity of the nPCR primers. None of the 9 discrepant samples, or the remaining 41 negative qPCR samples, had detectable T. foetus or S. moskowitzi DNA with the nPCR primers. The remaining 21 discrepant samples that were called negative by the feeder laboratories but positive by the study laboratory were all confirmed positive for T. foetus DNA by nPCR and DNA sequencing.
In total, 234 samples were tested by nPCR and sequenced. Tritrichomonas foetus DNA was confirmed in 174 of the 175 samples classified in the study laboratory as qPCR positive for T. foetus. One of the 3 qPCR presumptive positive test samples was confirmed as containing T. foetus DNA by sequencing. None of the 6 high Ct samples retested in workflow A and found qPCR negative in the study laboratory contained T. foetus or S. moskowitzi DNA when sequenced. The 9 samples classified as positive by qPCR in the feeder laboratories that tested negative in the study laboratory were negative by nPCR for T. foetus and S. moskowitzi. The additional 41 randomly chosen negative qPCR samples were also negative by nPCR for both T. foetus and S. moskowitzi DNA.
Statistical analysis of qPCR test results compared to T. foetus nPCR and DNA sequencing
The results of DNA sequencing on the nPCR amplicon obtained from the cultured smegma samples, carried out after completion of the original qPCR testing in the study laboratory, were used as the reference method to confirm the true test status of the qPCR test positive samples. Two hundred thirty-four samples (178 positive or presumptive positive by qPCR and 56 classified as test negative by qPCR in the study laboratory) were tested by nPCR and sequenced. The remaining 569 samples were qPCR test negative in both the feeder and study laboratories, and nPCR and sequencing was not attempted on these samples. The comparison testing between the various laboratories and the 1/5 pooling test results is based on the results of the 234 samples that were sequenced, but included the additional 569 negative test samples to allow for statistical calculation. The statistical comparison of the results obtained by the study laboratory and those obtained in each of the feeder laboratories and the 1/5 pooled testing results were recalculated using nPCR and sequencing as the new reference. The results are listed in Table 4. The 3 laboratories employing boiling or heat-lysis for their extraction method had an overall agreement of 94.2% (kappa = 0.84) compared to 99.2% (kappa = 0.97) for the 2 laboratories utilizing a chemical extraction procedure. The combined sensitivity for the laboratories utilizing boiling or heat-lysis methods for extraction was 84.4% compared to 95.7% for those utilizing chemical extraction methods. The specificity for the laboratories employing heat-lysis extraction was 97.5% versus 100% for the laboratories using chemical lysis methods.
Comparison of quantitative polymerase chain reaction (qPCR) test results of cultured smegma samples from feeder and study laboratories and pooled sample testing (1 positive plus 4 negatives) with Tritrichomonas foetus DNA nested PCR and sequencing results.*
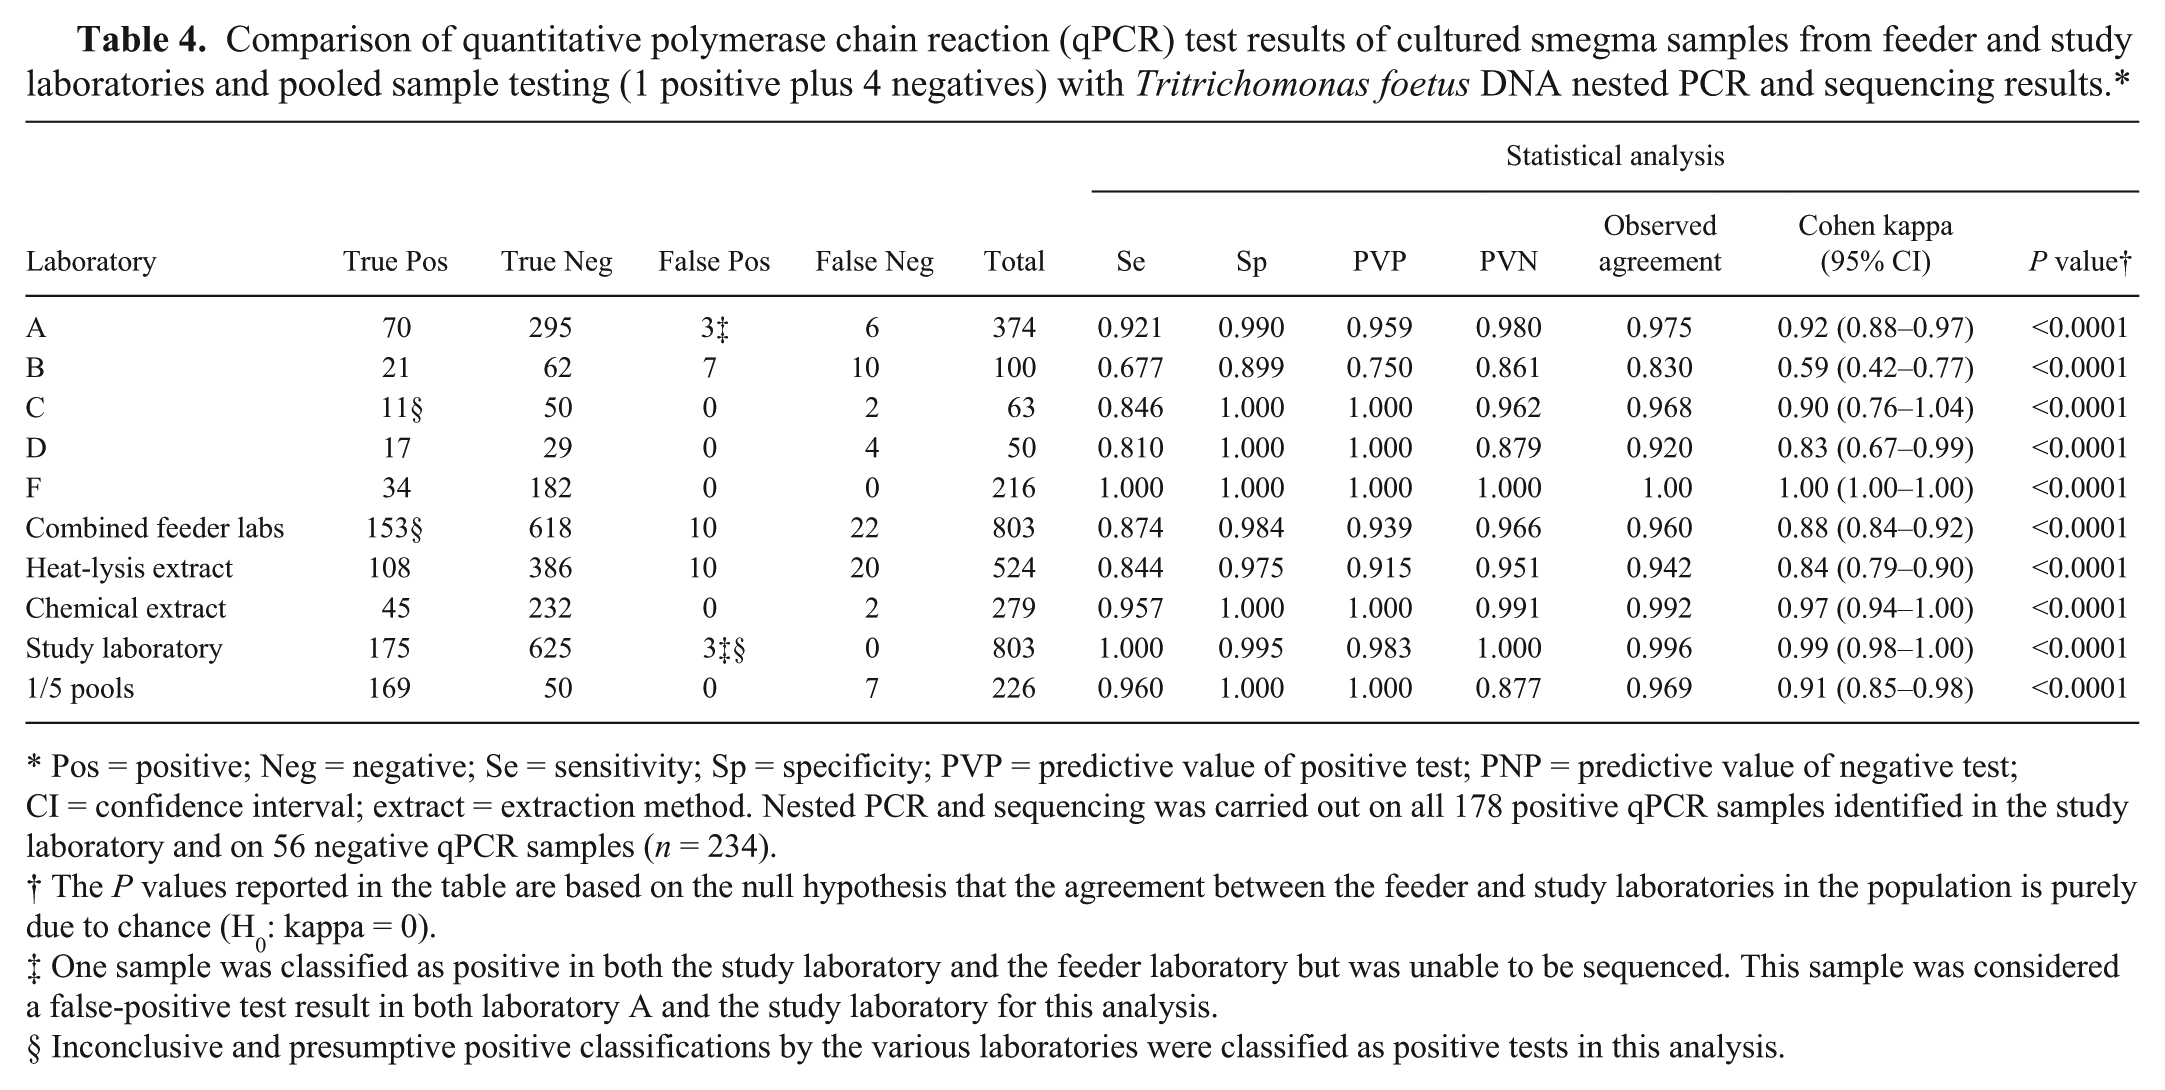
Pos = positive; Neg = negative; Se = sensitivity; Sp = specificity; PVP = predictive value of positive test; PNP = predictive value of negative test; CI = confidence interval; extract = extraction method. Nested PCR and sequencing was carried out on all 178 positive qPCR samples identified in the study laboratory and on 56 negative qPCR samples (n = 234).
The P values reported in the table are based on the null hypothesis that the agreement between the feeder and study laboratories in the population is purely due to chance (H0: kappa = 0).
One sample was classified as positive in both the study laboratory and the feeder laboratory but was unable to be sequenced. This sample was considered a false-positive test result in both laboratory A and the study laboratory for this analysis.
Inconclusive and presumptive positive classifications by the various laboratories were classified as positive tests in this analysis.
Laboratory F was the only laboratory that had perfect agreement (kappa = 1.0) with the nPCR and subsequent sequencing results. The study laboratory had a 99.6% agreement (kappa = 0.99) with the nPCR and sequencing results.
In the current study, the overall agreement between the pooling result when using a dilution of 1 positive sample combined with 4 negative samples and the nPCR and sequencing result on the positive samples and the study laboratory qPCR result on the negative samples used to create the pools was 96.9% (kappa = 0.91). The sensitivity of these same pools was 96.0%, the specificity was 100%, the predictive value of a positive test was 100%, and the predictive value of a negative test was 87.7%. Pooling samples in a 1/5 fashion had a higher percentage agreement and kappa value than 3 of the 5 individual test laboratories. The 1/5 pooled sample testing had a lower probability than all, but one, of the laboratories of predicting that a negative test result did not contain a sample from a bull colonized with T. foetus. Attempts to pool a single positive sample with 2 negative samples in a 1/3 pool on the 14 samples with Ct values higher than 35 cycles detected only 1 additional pool, increasing the sensitivity of the 1/3 pools to 96.4%. Of the 175 individual samples that were qPCR test positive in the study laboratory, 14 (8%) had Ct values of 35 cycles or higher. Only 50% of these samples were able to be detected when tested in a 1/5 dilution pool.
Discrepant sample retesting
The design of the present study allowed the participating laboratories the opportunity to evaluate their testing methods compared to a commercially prepared and standardized extraction and qPCR testing system. After completion of all the testing in the study laboratory, the samples that had different results in the feeder laboratories than those obtained in the study laboratory (discrepant samples), were offered back to the appropriate feeder laboratories for re-extraction and retesting using the same methodologies as used in their original testing. Only laboratory A was able to retest their discrepant samples. Laboratory A utilized the same testing methodology as laboratory B and it was agreed among the 2 laboratories and the authors to allow retesting of both laboratory A and laboratory B samples in laboratory A. The other participating laboratories were unable to retest their samples either due to laboratory constraints or they were no longer able to utilize the same testing methodology as in the original test. Laboratory A (8 samples) and laboratory B (17 samples) accounted for 25 (71.4%) of the 35 discrepant samples. Nine of the 25 discrepant samples, originally found to be positive in these feeder laboratories (Ct values <35 cycles), were negative in the study laboratory. When retested in laboratory A, all 9 of these samples were qPCR test negative (undetected) for T. foetus DNA. The remaining 16 discrepant samples had originally tested negative in the 2 feeder laboratories but were test positive in the study laboratory and were confirmed by nPCR and sequencing as containing T. foetus DNA. On repeat testing in laboratory A, 10 of these original 16 negative samples (62.5%) were reclassified as positive. The remaining 6 discrepant samples remained negative on the retest. Overall, of the 25 samples from laboratories A and B that had discrepant test results from those obtained in the study laboratory, 76% had the original test result reversed on repeat testing.
Discussion
Results of the current study indicate that the variability in testing methodologies used within the 5 feeder laboratories does impact the sensitivity, specificity, and predictive value of the qPCR tests used to detect bulls colonized with T. foetus. The agreement quotient (kappa), which measures the level of agreement beyond that of chance, between the results obtained in the feeder laboratories and the study laboratory ranged from 59% to 98% for the 5 feeder laboratory qPCR results compared to the study laboratory test result. The 2 laboratories with the lowest kappa values (59–79%) used a heat-lysis method for extraction and did not utilize an internal amplification control in their testing program. The remaining laboratory using heat-lysis for extraction did not use an internal amplification control, yet their kappa statistic indicated a level of agreement beyond chance of 93% with the results from the study laboratory. When taken as a whole, the laboratories that used heat-lysis and no internal amplification control had a kappa value of 84%, while those using commercial chemical extraction methods and an internal amplification control in their testing had a kappa value of 96% compared to the study laboratory results.
When compared to nPCR and sequencing, the laboratories utilizing heat-lysis for extraction had an overall kappa value of 84% while the chemical extraction method feeder laboratories kappa value was 97%. The results of laboratory A would indicate that other factors may also be involved in how accurately test results from a laboratory correlate with the new standard proposed herein. Briefly, those factors will be discussed and comment made on their effect on this study, when applicable.
Little variability was reported between laboratories in the incubation temperature (33–38ºC) used to enrich the samples. Previous literature reports do not indicate that this difference in temperature would adversely affect the ability of T. foetus to replicate.1,10,11
The duration of sample incubation prior to DNA extraction ranged from 24 to 48 hr between the laboratories. One report 14 has noted that T. foetus has been shown to secrete a range of hydrolytic enzymes that cause rapid DNA breakdown following cell lysis, if incubated for more than 48 hr, which may lead to a decreased sensitivity in the ability of molecular methods (e.g., PCR) to detect T. foetus DNA over longer incubation times. None of the participating laboratories exceeded 48 hr of incubation. The percent agreement with the study laboratory of the 2 laboratories (D and F) incubating for 24 hr prior to extraction was 94.8%, while the 3 laboratories (A–C) that incubated for 48 hr agreed on 92.6% of the samples tested.
All of the laboratories, except laboratory F, ran their qPCR reactions for 40 cycles. Laboratory F ran their reactions for 45 cycles. The advantage of running the qPCR reaction for T. foetus for an additional 5 cycles has not, as yet, been reported on in the literature. Laboratory F had perfect agreement with the results of nPCR and sequencing and was the only laboratory that required a new sample collection without the need for additional testing for samples having Ct values above their cutoff for a positive test (Ct ≤ 37).
As noted above, only feeder laboratories C and F and the study laboratory used an internal amplification control in their testing. Without an internal control, samples inhibited from amplifying the DNA within their matrix could be classified as negative, thus producing a possible false-negative test result. In the current study, the total number of false-negative tests in the feeder laboratories when the qPCR test result was compared to nPCR and sequencing, was 22. Twenty (91%) of these samples were from the laboratories that did not employ an internal amplification control in their testing, but these were also the same laboratories utilizing heat extraction for the sample preparation. The study laboratory identified 50 (6.2%) of the total 803 samples tested as having a level of inhibition that required additional testing to verify that the negative result was not due to the inability of the DNA to be amplified within the test sample. Thirty-nine of these 50 samples (78%) were from laboratories using boiling or heat-lysis for sample extraction and which did not employ an internal amplification control. The 11 remaining samples were from laboratory F, which used a commercial extraction methodg,h and an internal amplification control. n The different methodologies used for incorporating and interpreting the internal amplification control data may account for some of the variation in the interpretation of the degree of inhibition present within these 11 samples. The study laboratory incorporated their internal amplification control DNA into the lysis-binding solution used for each extraction and this DNA was subject to the extraction process, which may have resulted in some loss in the number of copies of the internal amplification DNA in the sample. The amount of loss should be uniform across the extraction plate. This possibility was accounted for in the study laboratory by using extraction control wells containing PBS in each extraction run as the basis for determining if a sample’s internal control DNA had been inhibited from amplifying. Laboratory F added their internal control DNA and its primers and probe sequences into their qPCR master mix and used a set cycle range of 33–35 for their internal control value to validate that amplification had occurred. If even a small amount of the internal amplification control were lost in the extraction process, the resultant Ct value for that sample would be expected to be higher than one in which the internal control DNA was incorporated into the qPCR reaction mixture. Also, the actual copy numbers of target in the amplification control DNA used by laboratory F was not available, and this would influence comparison of the 2 test methods.
Workflows A and B, as outlined in the present study, would significantly increase the cost of qPCR testing for T. foetus. Workflow A would require an additional 3 sample extractions and 3 qPCR tests on any sample that did not inhibit DNA amplification but had a T. foetus Ct value above the positive cutoff value but less than or equal to 40 cycles. In the current study, there were 9 such samples or 1.1% of the total number tested. The 1 presumptive positive sample identified after additional testing in workflow A would still have required additional testing by a different method to verify its true test status. Nested PCR and sequencing as used in this study classified this presumptive positive sample as truly containing T. foetus DNA. The 6 samples with Ct values of 38–40 cycles that were unable to be confirmed as positive, either by additional qPCR testing in workflow A or by nPCR, could possibly be due to the difficulty of detecting DNA from samples with very low copy numbers of the target within the sample. The detection of low copy number samples is impacted by stochastic effects, making it difficult to repeatedly detect the target of interest. For this study population, the confirmation process outlined in workflow A required an additional 27 extractions and 27 qPCR tests to be able to definitively identify the 2 additional positive bulls.
Utilizing the criteria for workflow B in the present study, 50 (6.2%) of the test samples submitted, required this workflow. Two presumptive positive samples were identified by this additional testing, and neither of these were confirmed as containing T. foetus DNA when tested by nPCR and sequencing. An alternate to retesting samples identified by the criteria outlined for workflow A or B might be to consider such samples non-testable and request a repeat sample collection, as done in laboratory F. Each laboratory would need to define their retesting criteria, with the knowledge that such problematic samples cannot be ignored nor considered true negative tests without some additional testing. The decision on how to proceed with these types of samples would ultimately be made by the testing laboratory, regulatory agencies, veterinarians, and herd owners. Harmonization between testing laboratories and state regulators on how such samples should be handled would greatly benefit all stakeholders.
Of the 35 samples with test results in the feeder laboratories different than those obtained in the study laboratory, 30 (86%) were from laboratories utilizing heat-lysis as their extraction method and which did not use an internal amplification control in their testing methodology. This study suggests that both of these factors, heat-lysis and lack of an internal amplification control, may be the most critical factors affecting the reliability of a testing laboratory to correctly classify samples in qPCR testing.
Nested PCR and sequencing used in the present study confirmed all but 1 of the samples considered positive by qPCR in the study laboratory (Ct < 38 cycles). A point mutation, if present, in this sample in the forward outer primer for nPCR could account for no or weak amplification in the first product. This in turn would result in a weak or absent amplification of the second PCR reaction, which contained the qPCR forward and reverse primers, the same as found in the qPCR reaction, resulting in no product available to sequence. This could account for the positive qPCR test in both the feeder and study laboratory but a failed nPCR. The nPCR and sequencing outlined in the current study provides for an alternative method of confirming test samples as T. foetus positive. For qPCR products with a low enough Ct, direct sequencing of the normal qPCR product can also be used to confirm identity or false-positive results.
There was little information about the feasibility of pooling precultured or cultured smegma samples for the diagnosis of T. foetus with qPCR. However, a protocol using pooled cultured smegma samples utilizing endpoint PCR has been previously reported. 12 Using the pooling methodology outlined in the present study, a slight difference in sensitivity was observed between the 1/5 and 1/3 sample pools when compared to testing the samples individually. Utilizing the study laboratory’s protocol, pooling at a 1/5 dilution produced better sensitivity than the average reported sensitivity (approximately 90%) for a single cultured smegma sample tested by microscopy5,8,15 and was equivalent to the stated sensitivity of 95% or higher, 21 obtained by collecting and culturing 3 separate smegma samples with 7 days of sexual rest between collections. Compared to nPCR and sequencing results, 1/5 pools had a kappa value of 91% that was equivalent to individual sample testing in 3 of the 5 feeder laboratories. Pooling in a 1/5 dilution resulted in an inability to detect samples with little T. foetus DNA present. The higher the Ct value for an individual sample, the less likely T. foetus DNA was to be detected when tested within a pool. As stated above, the high Ct value test samples have and will continue to be a problem in qPCR testing whether testing individual or pooled samples. In problematic herds or when greater accuracy is demanded, a second or even third sample collection, individually tested, may be warranted.
Sequencing of every positive and late riser sample in the current study allowed for corroboration of the exclusive presence of T. foetus in the study population. None of the samples tested by nPCR and sequenced were found to contain S. moskowitzi DNA. Until replaced with an even better tool, it is recommended that the commercially available qPCR testing system be adopted as a new reference method for the detection of T. foetus DNA, replacing the historically official, currently underused, culture and microscopy method. It is noted that the nPCR and sequencing method may be less sensitive than qPCR but is more specific, thus providing confirmation of the presence of T. foetus DNA in samples with very low copy numbers.
The repeat testing results obtained on the discrepant samples returned to the feeder laboratory for retesting after the conclusion of testing in the study laboratory also raises concerns. Discussion at the Parasitology Committee meetings of the AAVLD (2009) regarding the effect of freezing and thawing cultured smegma samples may provide some insight. One presentation reported a significant reduction in sensitivity of refrigerated IP a compared to frozen IP when tested with qPCR (Trujillo J, Guy T, Rood K, King B: 2009, Field validation of a real-time PCR detection assay for Tritrichomonas foetus and evaluation of sample transport and in-pouch pooling on assay sensitivity. In: Proceedings of the 52nd Annual AAVLD Conference, p. 35). Additionally, information presented at the same meeting (personal communication) indicated that freezing IP samples prior to DNA extraction appeared to decrease the amount of inhibition within the test sample. Such results were reported in other laboratories but none in a controlled setting and none have been reported on in the literature. Since neither of the laboratories that had their discrepant samples retested had used an internal amplification control, it is not possible to determine if inhibition of amplification, which may have existed on their first sample test, was eliminated or ameliorated when the sample was frozen and thawed. This may possibly have been a factor in the 10 samples that were originally classified as negative, when tested on freshly incubated smegma in the IP, but on retest were classified as positive when the same sample material had been frozen and thawed. Laboratory C was the only feeder laboratory in the current study that tested frozen samples routinely in their laboratory. The 4 discrepant samples from laboratory C had all been frozen prior to the first test in that laboratory. Two of these 4 samples had no T. foetus DNA detected in the feeder laboratory, and the remaining 2 were the samples classified as inconclusive in that laboratory with Ct values of 39.32 and 39.89 cycles, respectively. Additional controlled studies are needed to determine the effect of freezing and thawing of cultured smegma on the qPCR test result.
Of further interest in the retesting results was the variation in the T. foetus Ct values obtained in the feeder laboratory depending on which extraction method was used. Seven of the 10 samples retested had no T. foetus DNA detected in the feeder laboratories’ original testing. On retest, these 7 samples produced Ct values above the positive cutoff value for that laboratory (35 cycles) and were therefore reextracted using commercially available columns g as outlined in the laboratory protocol. The Ct value on the same sample when extracted with the commercial kit was on average 3.47 cycles lower than that obtained when the same sample was extracted by boiling. The average difference between the Ct values on these same 7 samples when boiled for extraction versus the Ct value obtained in the study laboratory was +5.94 cycles. The 3 remaining samples in this group, on retest, using boiling as the extraction method, produced Ct values of less than 35 cycles, but the Ct obtained by the feeder laboratory was on average 4.72 cycles above that of the study laboratory. This retesting data adds more weight to the suggestion that heat-lysis does impact the ability to correctly identify and classify cultured smegma samples for T. foetus DNA by qPCR testing.
In summary, a total of 803 smegma samples collected by 5 veterinary diagnostic laboratories testing for T. foetus by qPCR were used in the current study. Agreement was reached between the 5 diagnostic laboratories and the commercially available products used in the study laboratory for 770 (95.89%) of the 803 samples. The study laboratory was able to detect 21 samples that the feeder diagnostic laboratories had identified as negative. These samples were confirmed positive for T. foetus DNA by nPCR and sequencing. The study laboratory was unable to detect T. foetus DNA in 9 samples reported as positive by the feeder laboratories. These 9 samples were all negative on sequencing for T. foetus DNA and, when retested in the feeder laboratory using the same qPCR methodology as the original test, all retested negative.
Standardization of all the various parameters in the collection, transport, incubation, sample preparation, DNA extraction, and testing protocols would be of significant value in assuring producers and regulatory officials of the validity of the test result obtained across laboratories. This is probably an insurmountable task, but an alternative would be for the various laboratories to use a standardized method, such as the commercially available test outlined herein, either as their test method or as the basis for evaluating and modifying their protocols to obtain the same end results as obtained by this method. The current study defines some of the diversity and problems inherent in the current testing paradigms and offers a standardized approach to T. foetus testing.
Footnotes
Acknowledgements
The authors acknowledge and thank the 5 diagnostic testing laboratories that were willing to participate in this study. Without their contribution and willingness to work cooperatively in advancing the understanding of the testing systems used to detect T. foetus–colonized bulls, comparative studies such as this would not be possible. Also, the authors would also like to acknowledge John Bucci from the Bioinformatics group at Life Technologies, Carlsbad, California, for the critical review of the statistical analysis.
a.
InPouch TF media, Biomed Diagnostics Inc., White City, OR.
b.
Applied Biosystems VetMAX T. foetus reagents, Life Technologies, Carlsbad, CA.
c.
Applied Biosystems MagMAX-96 pathogen RNA/DNA kit, Life Technologies, Carlsbad, CA.
d.
Applied Biosystems VetMAX-Plus qPCR master mix, Life Technologies, Carlsbad, CA.
e.
Applied Biosystems VetMAX T. foetus controls, Life Technologies, Carlsbad, CA.
f.
Ambion MagMAX-96 viral RNA isolation kit, Life Technologies, Carlsbad, CA.
g.
QIAamp DNA mini kit, Qiagen Inc., Valencia, CA.
h.
DNeasy 96 blood and tissue kit, Qiagen Inc., Valencia, CA.
i.
Durapore membrane filters, EMD Millipore, Billerica, MA.
j.
Applied Biosystems MagMAX Express-96 magnetic particle processor, Life Technologies, Carlsbad, CA.
k.
Applied Biosystems 7500 Fast real-time PCR system, Life Technologies, Carlsbad, CA.
l.
SmartCycler, Cepheid Inc., Sunnyvale, CA.
m.
IDTE (1× TE Solution), IDT Integrated DNA Technologies, Coralville, IA.
n.
Applied Biosystems TaqMAN exogenous internal positive control reagents, Life Technologies, Carlsbad, CA.
o.
Applied Biosystems GeneAmp High Fidelity PCR system, Life Technologies, Carlsbad, CA.
p.
ExoSAP-IT PCR clean-up system, USB Corp., Cleveland, OH.
q.
Applied Biosystems GeneAmp 9700, Life Technologies, Carlsbad, CA.
r.
ABI 3500xl genetic analyzer, Life Technologies, Carlsbad, CA.
s.
Seq Wright DNA Technical Services, Houston, TX.
Declaration of conflicting interests
The raw data and a report summarizing this study will be filed with United States Department of Agriculture–Center for Veterinary Biologics in support of a Veterinary Biological Product License application. The data supports further validation activities for the Tritrichomonas foetus DNA test kit. Two authors (Ivan Leyva-Baca and Catherine O’Connell) were employed by Life Technologies who produce the MagMAX sample preparation system and the VetMAX quantitative polymerase chain reaction reagents used in this study.
Funding
The author(s) disclosed receipt of the following financial and reagent support for the research, authorship, and/or publication of this article: This research was supported by contract research funds of the Animal Health and Food Safety Group at Life Technologies, 2130 Woodward Street, Austin, TX 78744.