
Abstract
Classical postweaning multisystemic wasting syndrome (PMWS) diagnosis is based on postmortem findings (histopathology plus viral detection in lymphoid tissues). Because one of the major differences between PMWS-affected and nonaffected pigs is Porcine circovirus-2 (PCV-2) load in serum and tissues, real-time quantitative polymerase chain reaction (qPCR) has been suggested as a potential diagnostic technique for the disease. The objective of the present study was to assess the applicability of qPCR to quantify PCV-2 loads in pooled serum samples as an easy-to-use PMWS diagnostic tool at the herd level. The experimental design included two simulation studies with several serum pool sizes from pigs already screened for PMWS (by histopathology and detection of PCV-2 by qPCR). Several qPCR thresholds were defined and validated with experimental pools created in the laboratory. Quantitative PCR on pooled serum samples did not result in a sufficiently reliable alternate method to the classical PMWS diagnosis method based on individual clinical, histopathological, and PCV-2 detection criteria. However, serum pools seemed to be an alternative at a low economic cost for the quantification of PCV-2 loads in suspicious herds. A targeted (including only clinically diseased animals) sampling approach did not give better estimates compared with a random sampling approach.
Keywords
Introduction
Postweaning multisystemic wasting syndrome (PMWS, also known as porcine circovirus associated disease) is clinically suspected in pigs suffering from respiratory signs and wasting. This condition is pathologically characterized by lymphocyte depletion and granulomatous inflammation of lymphoid tissues. 27 Also, Porcine circovirus-2 (PCV-2) has been described as the necessary infectious factor to develop PMWS, 1,16 which is considered a multifactorial disease. 32 PMWS diagnosis is established when pigs fulfill three major criteria: 1) compatible clinical signs, 2) presence of characteristic microscopic lymphoid lesions; and 3) presence of PCV-2 within these lesions. 32,35 Consequently, PMWS diagnosis requires the necropsy of suspicious animals and access to histopathological expertise, which is not available in all diagnostic laboratories worldwide. 15 Therefore, there is a need for alternate diagnostic procedures that are applicable on live animals.
The detection of PCV-2 antibodies in serum samples is nondiagnostic of PMWS, indicating only infection, passive transfer of antibodies or antibodies elicited by vaccination; presence of PCV-2 DNA is considered an evidence of infection. 6,10,24,26 Real-time quantitative polymerase chain reaction (qPCR) is an attractive methodology for laboratory diagnosis of infectious diseases, because, like other PCR-based technologies, it can be carried out on easily accessible material of live animals such as serum and fecal and rectal swabs and can provide rapid results and precise quantification. 5 Recently published results indicate that qPCR might be a potential reliable technique to diagnose PMWS on a population, although not on an individual basis. 11,12 Several studies have shown that PCV-2 loads in serum are significantly higher in PMWS-affected pigs than in healthy pigs. 4,11,12,19,21,25,28 Accordingly, several studies proposed theoretical qPCR thresholds in serum as indicative of PMWS diagnosis: 104.7 PCV-2 copies/ml, 12 106.21 PCV-2 copies/ml, 11 106.91 PCV-2 copies/ml, 9 107 PCV-2 copies/ml, 4,25,33 and 107.43 PCV-2 copies/ml. 11 Also, considerable variation in qPCR detection limits has been shown among laboratories. 13,15 Therefore, the potential diagnostic PCV-2 load threshold may be strongly dependent on the laboratory and on the particular technique used. Moreover, in the single study in which sensitivity and specificity of 2 different PCV-2 qPCR methods were explored to diagnose PMWS, 11 combinations of these two parameters gave poor results (high sensitivity with low specificity or vice versa).
Quantitative polymerase chain reaction (qPCR) results in postweaning multisystemic wasting syndrome (PMWS)-affected and healthy farms for healthy, wasted non-PMWS, and PMWS individuals.
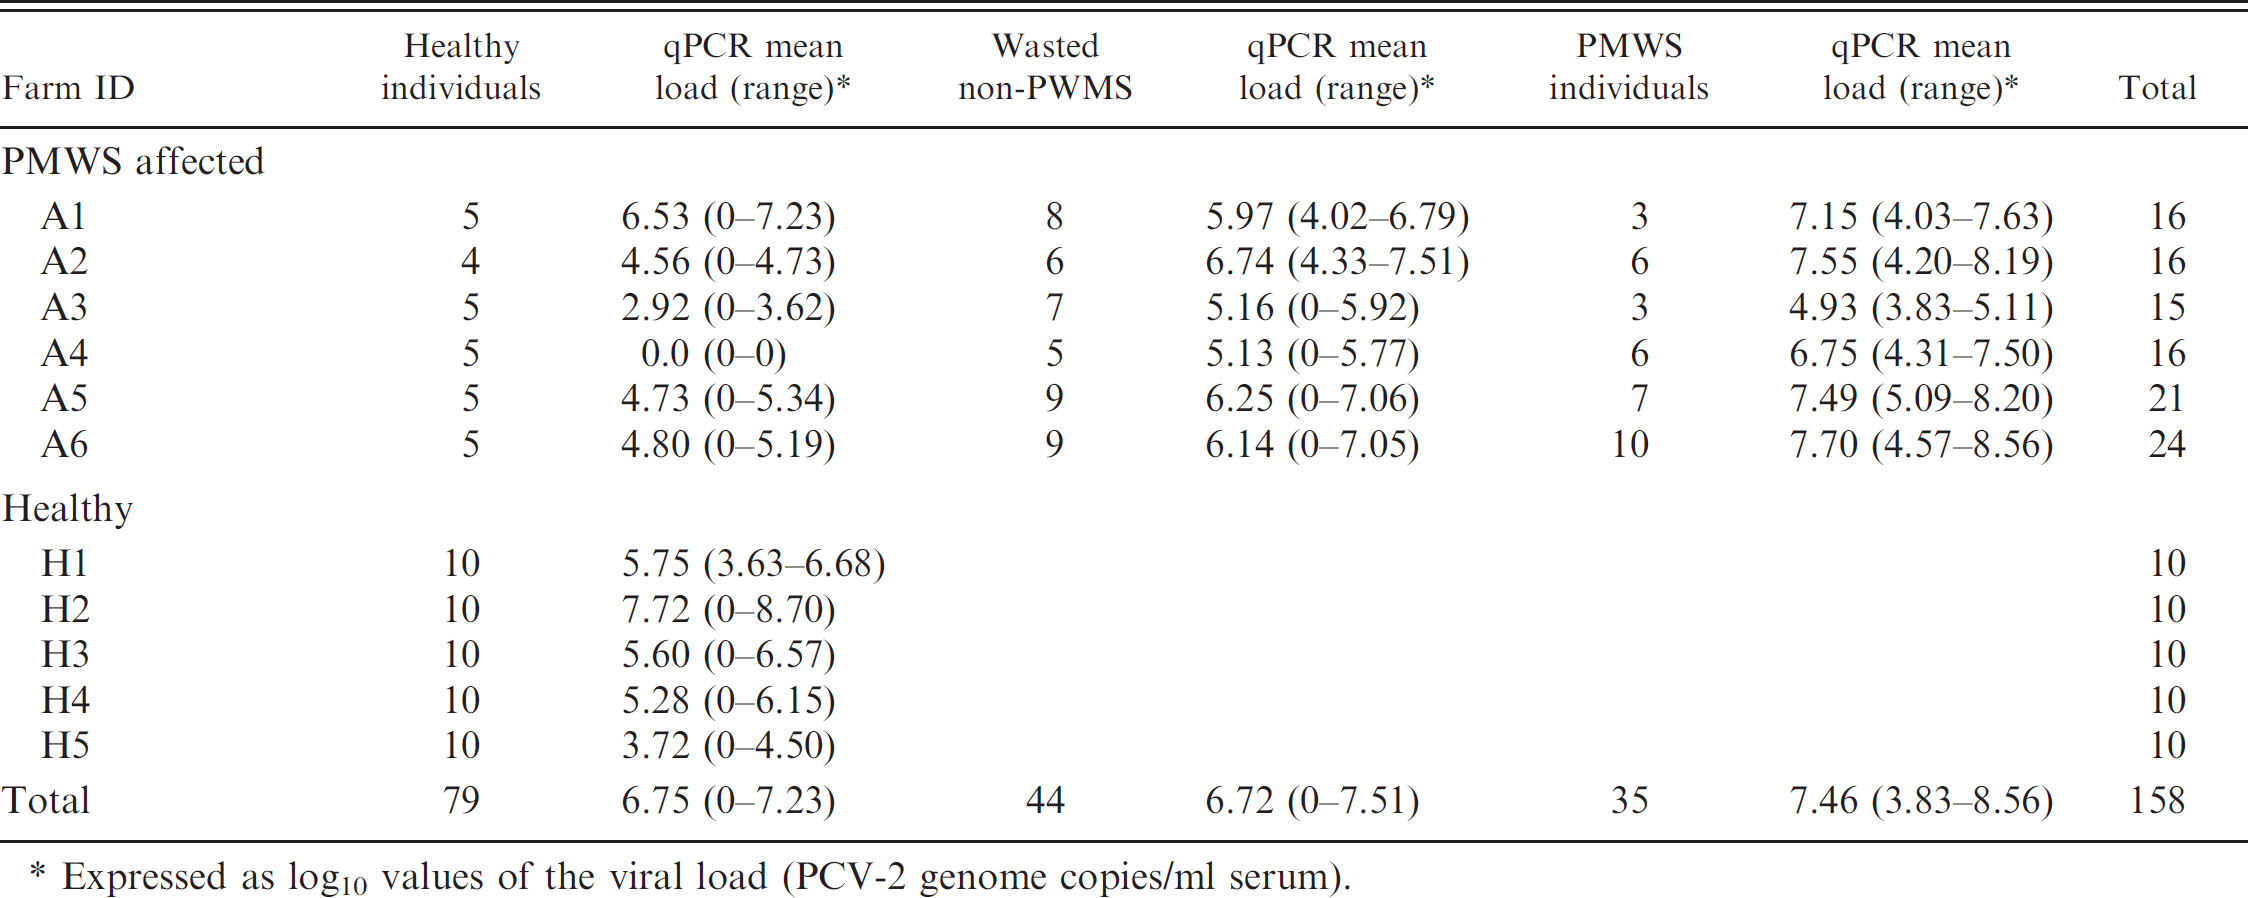
Expressed as log10 values of the viral load (PCV-2 genome copies/ml serum).
Sample pooling is used as a common strategy for cost savings in veterinary and human diagnosis. 37,38 The primary advantage of a pooled sample over an individual sample is that more individuals can be represented for the same fixed laboratory costs. Sample pooling has been shown to be an effective cost-saving and sensitivity-increasing technique in the detection of several infections, including Porcine reproductive and respiratory syndrome virus (PRRSV), 29,30 Bovine viral diarrhea virus, 23 caprine Johne's disease, 8 Classical swine fever virus, 20 bovine and swine Salmonella, 3,34,36 and avian pneumovirus infection in turkeys. 22 However, sample pooling has not represented a successful strategy for Bluetongue virus detection 38 or in hepatitis C seroprevalence assessment in human beings. 37 In most, if not all, of these diseases, the positivity of a sample was based on the presence or absence of the infectious agent's nucleic acid. However, differences in viral load among PMWS and PCV-2 subclinically infected pigs 33 imply that the diagnosis of PMWS from a pooled sample cannot be based on the simple presence or absence of PCV-2 DNA.
The objective of the present study was to analyze the applicability of qPCR to quantify PCV-2 loads in pooled serum samples, with a view to improve the diagnostic capacity of the qPCR technique. The main purpose was to develop an easy-to-use PMWS diagnosis tool at the herd level, without the need to perform postmortem examinations.
Materials and methods
Field data
Diagnostic data from 158 animals originating from 11 farms (Table 1) were used in the present study. Most of the analyzed animals (n = 108), aged 11–21 weeks, were included in a previous study 11 and comprised the following categories of animals: PMWS pigs, wasted non-PMWS pigs, and healthy pigs. All these pigs came from 6 farms diagnosed with PMWS, and clinical signs, histopathology, PCV-2 in situ hybridization, and PCV-2 qPCR results were already available from them. In addition, 50 healthy nonpathologically characterized pigs of 15 weeks of age were included (Table 1); these pigs came from 5 different farms that had never experienced PMWS-like clinical signs and had good production and mortality records. According to these data, animals were classified as follows: 1) PMWS (n = 35), 2) wasted non-PMWS (n = 44), and 3) healthy (n = 79). Wasted non-PMWS pigs were defined as animals showing clinical wasting but without fulfilling the individual diagnosis case definition of PMWS. 11 None of the pigs included in the present study were vaccinated against PCV-2.
Quantitative PCR
The PCV-2 viral load was quantified using a previously published qPCR protocol. 25 The presence of high PCV-2 loads (>10 7 PCV-2 copies/ml serum) was suggested as indicating the presence of PMWS lesions. Moreover, a recent study using the same technique proposed a cut-off value to differentiate PMWS affected from non-affected pigs of 106.21 PCV-2 copies/ml serum. 11 The qPCR used in the present study had a detection limit of 10 4 PCV-2 DNA copies/ml serum. 25
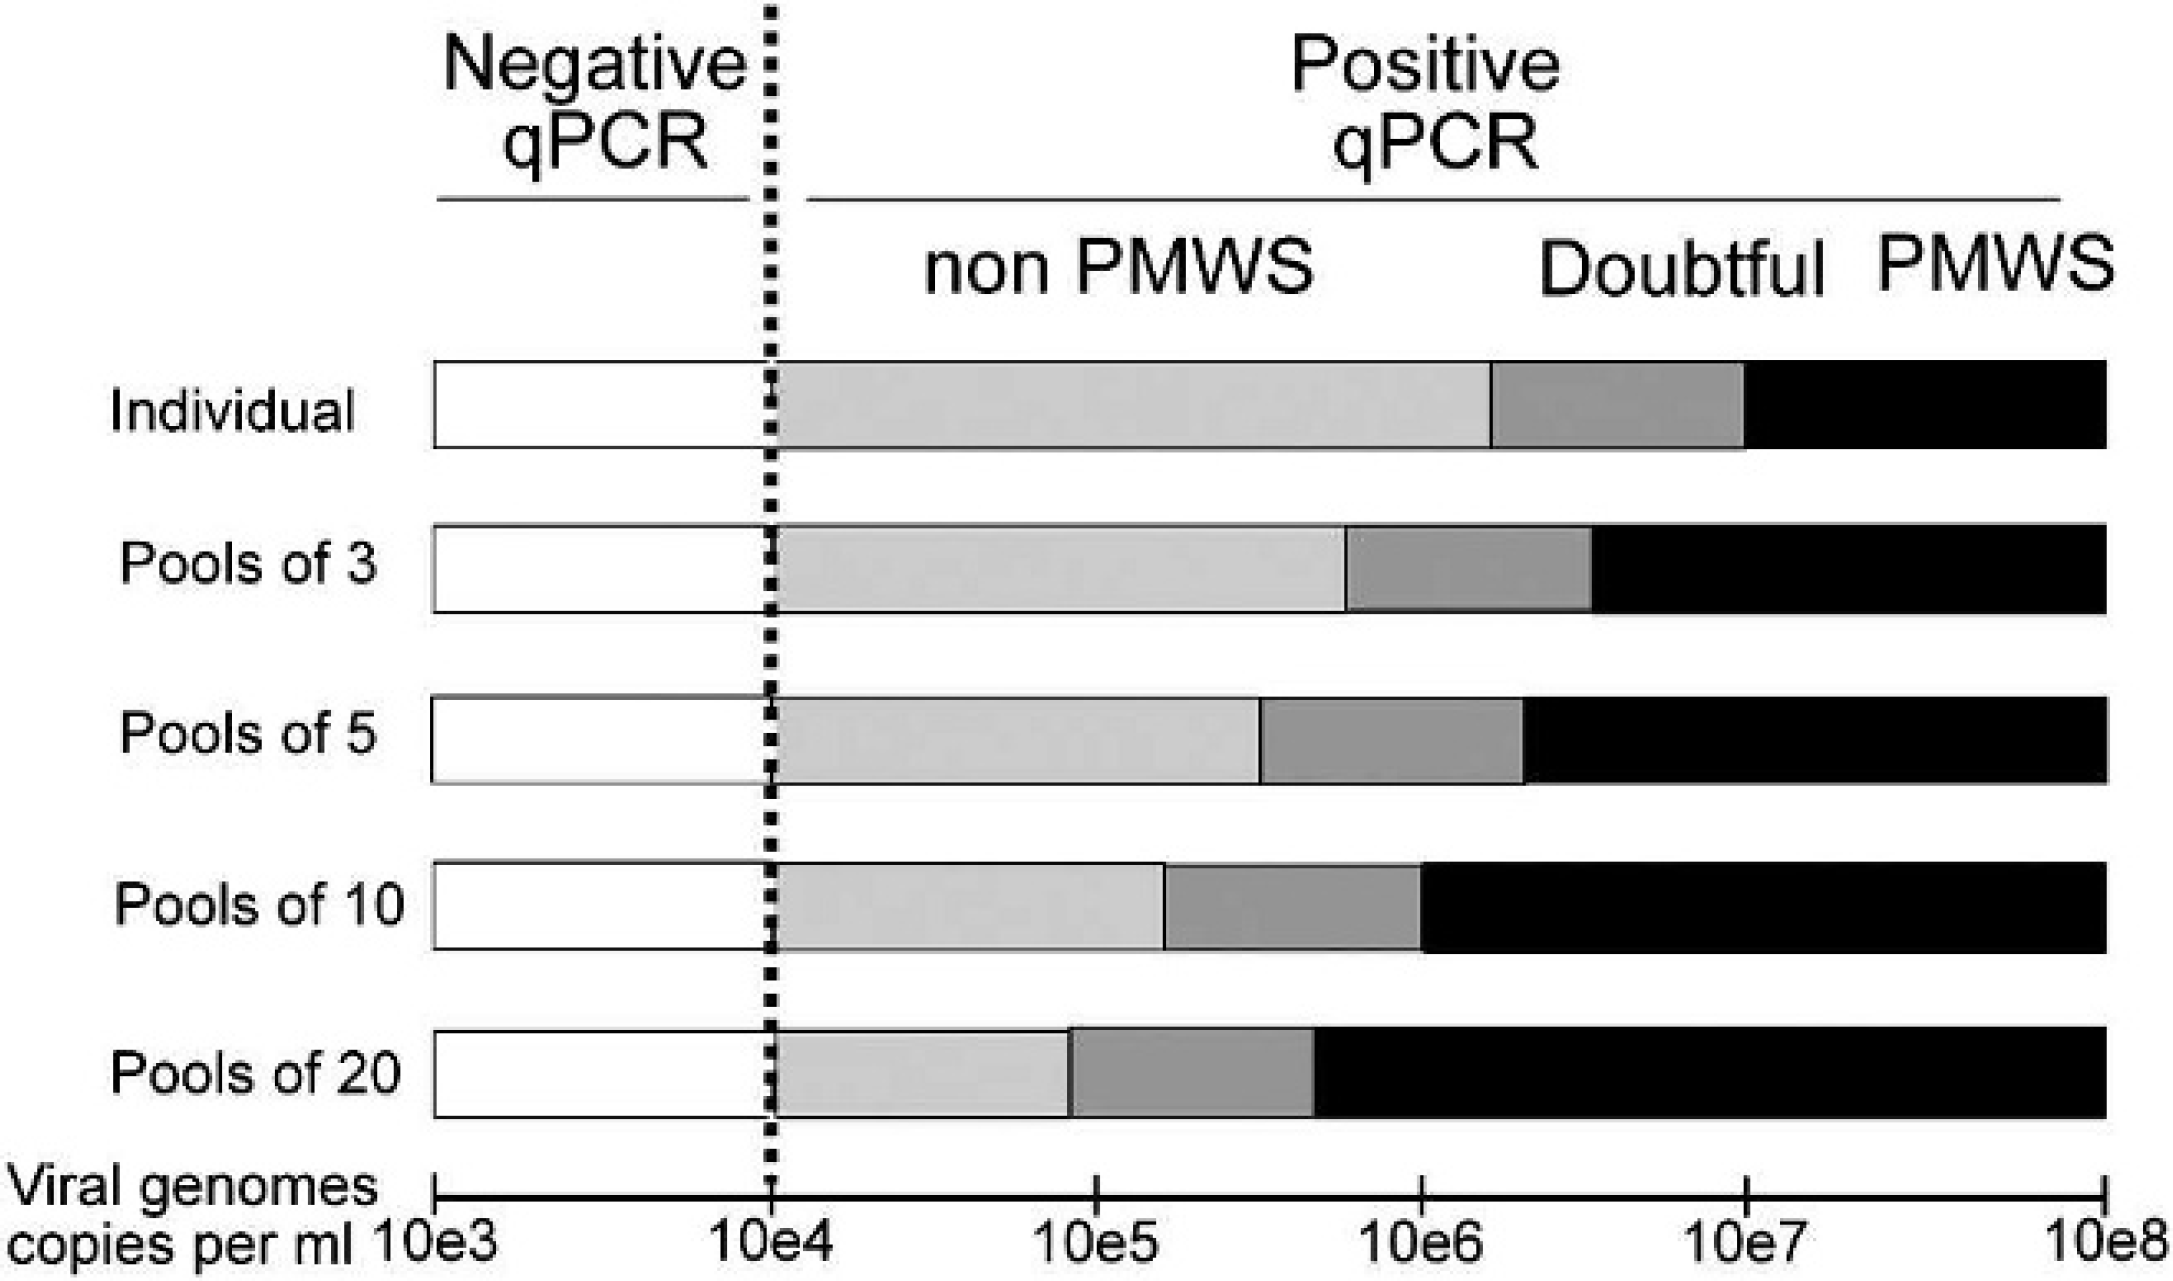
Model proposed for postweaning multisystemic wasting syndrome (PMWS) detection based on quantitative polymerase chain reaction (qPCR) thresholds. Depending on the qPCR result and the number of individuals pooled in a sample, results have been categorized as negative, non-PMWS, doubtful, and PMWS according to the qPCR thresholds proposed.
Real-time quantitative PCR thresholds
Figure 1 shows the expected results and thresholds for a qPCR at the individual level, according to the thresholds published for the particular qPCR technique used 11,25 : negative (<10 4 ), non-PMWS-affected (between 10 4 and 106.21), doubtful (between 106.21 and 10 7 ), and PMWS-affected (>10 7 ). The thresholds defined for individual samples were adapted to the different pools in the present study by dividing the corresponding threshold value by the number of samples in the pool (Fig. 1). The first category (<10 4 PCV-2 copies/ml) remained unchanged in all cases because it was based on the detection limit of the qPCR technique. These qPCR thresholds were used to determine the expected result of the pools generated in the Monte Carlo and combination simulations.
Experimental study and accuracy of pooled samples
To validate the accuracy with real pooled samples, pools of 3, 5, 10, and 20 individuals were constructed taking as base known concentrations of PCV-2 copies/ml. A PCV-2-negative serum (by standard PCR and qPCR for PCV-2) was spiked with a PCV-2 plasmid, resulting in a serum containing 10 8 PCV-2 genome copies/ml (representing a PMWS-positive individual). From this spiked serum sample, further sera harboring 10 6 PCV-2 copies/ml (doubtful), 10 4 PCV-2 copies/ml (non-PMWS), and 10 2 PCV-2 copies/ml (negative) were obtained. These spiked serum samples were combined to obtain 200 μl (volume of serum for DNA extraction) of pools of 3 (n = 14), 5 (n = 24), 10 (n = 49), and 20 (n = 77) serum samples, representing all the qPCR theoretical results: PMWS, doubtful, non-PMWS, and PCV-2 negative. Once pools were generated, DNA was extracted from 200 μl of pooled sera using a commercial kit a according to the manufacturer's instructions. PCV-2 DNA was quantified using the above-mentioned described qPCR technique. 25
Accuracy of PMWS diagnosis at herd level: simulation studies
In a first step, the pool sensitivities (PSe) and pool specificities (PSp) obtained under 2 pooling strategies, random sampling (animals selected for the pool regardless of their clinical status) and targeted sampling (only clinically affected animals included in the pool), were estimated by means of Monte Carlo simulations. In a second step, the PSe and PSp obtained previously were used to estimate herd pool sensitivity (HPSe) and herd pool specificity (HPSp) based on Christensen and Gardner. 7 A spreadsheet model was constructed. b The model was run for 20,000 iterations (Latin Hypercube sampling). c This process allowed the convergence of the probability distributions.
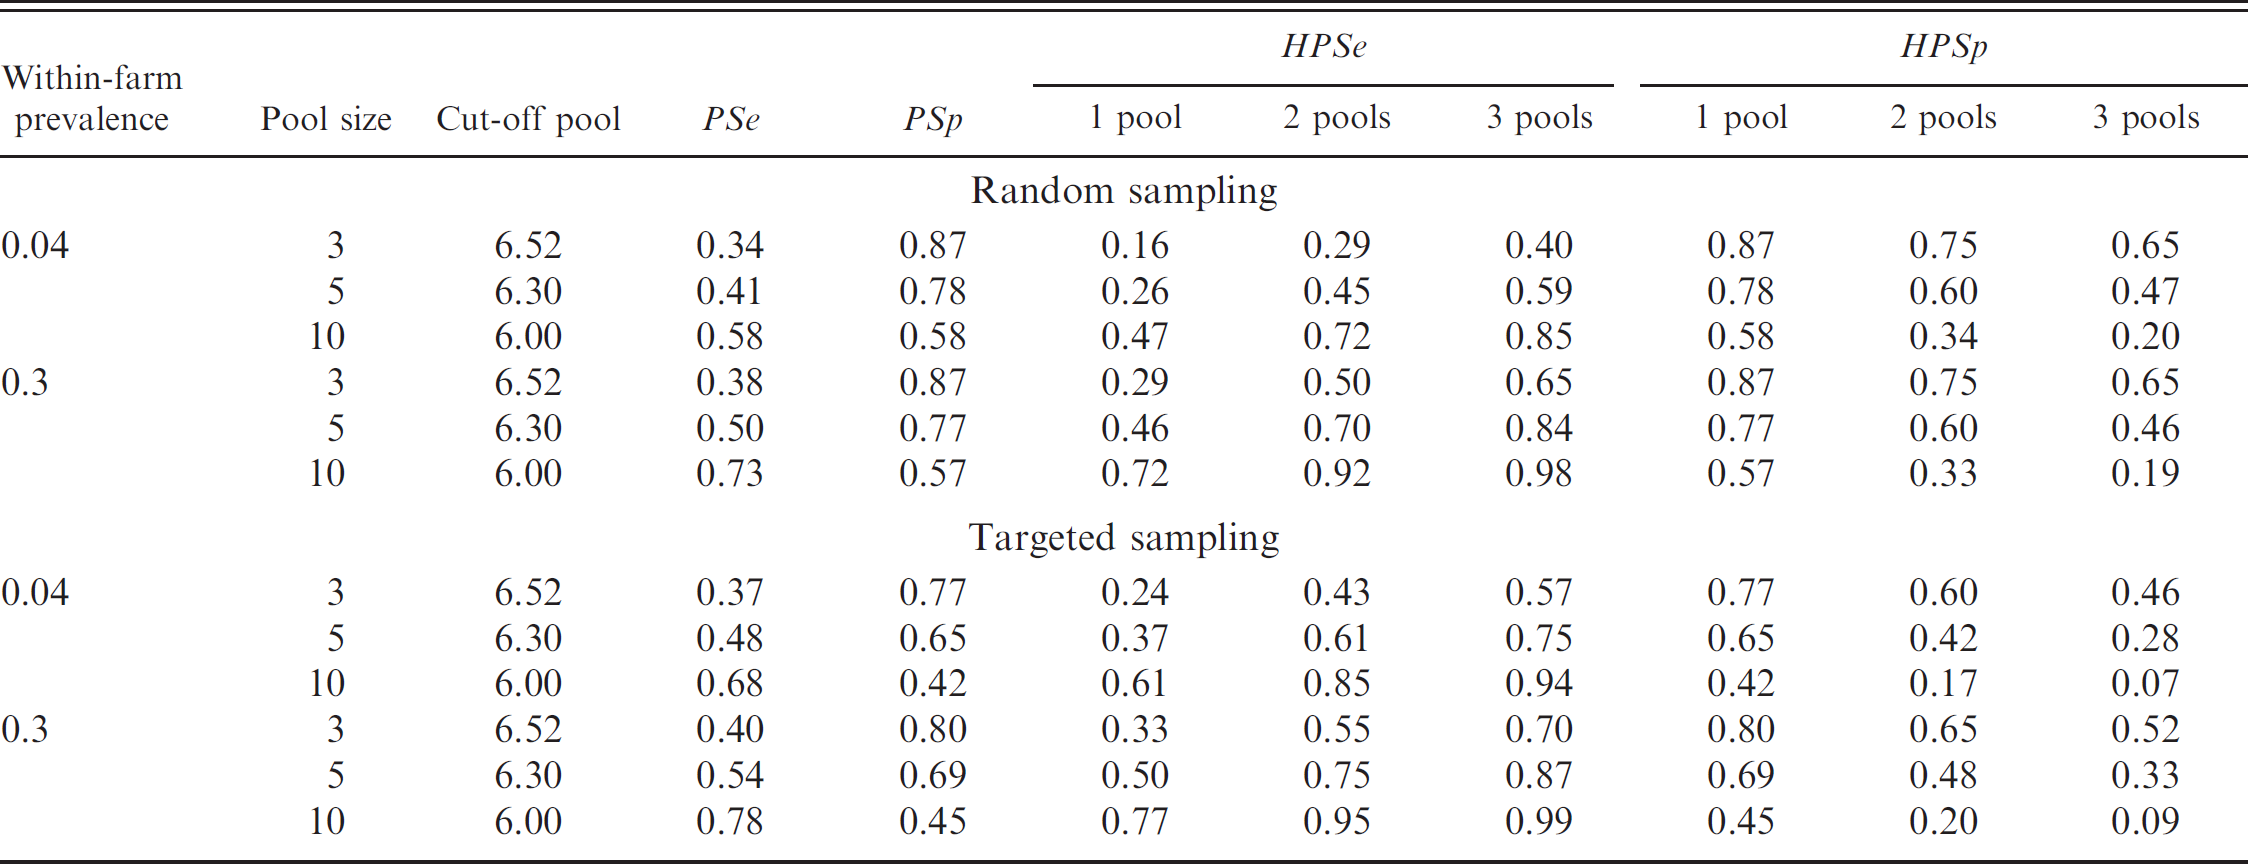
Monte Carlo simulation: estimation of PSe and PSp. PSe was defined as the probability (Pr) that the test gave a positive result (T+) given that at least one of the samples contained in the pool was from a PMWS-affected animal (D+, i.e. Pr (pool T+ | pool D+)). PSp was defined as the probability that the test gave a negative result (T-) given that all the samples contained in the pool were from nonaffected animals (D-), that is Pr (pool T- | pool D-). 7 The PSe depends on a series of factors: 1) the prevalence of affected animals, 2) the number of samples per pool, 3) the detection limit of the assay, and 4) the concentration of the agent in samples from affected animals. 26 In a PMWS diagnosis, the concentration of the agent in samples from nonclinically affected animals also was taken into account, because these animals were not necessarily PCV-2 qPCR negative. The simulation model allowed the assessment of the effect of different levels of prevalence, different pool sizes, and different limits of detection of the assay on the PSe and PSp. Two different levels prevalence (PA ), 0.04 and 0.30, were used and represented the lower and higher PMWS prevalence values, respectively, potentially detected in affected farms. 29 Pools of 3, 5, and 10 samples, with the diagnostic threshold adapted for each pool size (6.52, 6.30, and 6.00, respectively) were used.
In the random sampling approach, the qPCR results from the 35 animals classified as PMWS were assumed to represent the range of values of the affected animals and were described by a discrete distribution for the statistical simulations. The qPCR results from the 44 animals classified as wasted non-PMWS and the 79 animals classified as healthy (from both affected and nonaffected farms) were assumed to represent the range of values of non-PMWS-affected animals and also were described by a discrete distribution. Previously, the means of the qPCR results of nonaffected animals from affected and nonaffected farms had been compared using a Kruskal-Wallis test with the statistical package EpiInfo 3.3.2 (www.cdc.gov/epiinfo), and no statistically significant differences were found.
For the allocation of samples into the pools, the probability the sample was drawn from the discrete distribution of affected animals was given by the prevalence of affected animals (PA ). In contrast, 1 - PA represented the probability the sample was drawn from the discrete distribution of nonaffected animals. The disease status of the pool was determined based on the disease status of the individual animals, so that a pool containing at least one affected animal was considered as positive. To determine the qPCR result of the pooled test, the number of copies of PCV-2 of each of the individual samples was estimated as 10x, where x was the result of the individual qPCR. Then, the PCV-2 genome copy numbers of the individual samples were added and divided by the number of samples in the pool, and the logarithm of this number represented the qPCR result of the pooled test. When the qPCR result of the pooled test was larger than the chosen limit of detection of the assay the pool was scored positive. Finally, by counting the number of iterations that gave 1) a true positive result and 2) a false-negative result, the PSe was estimated.
For PSp estimation, the n samples of the pool were drawn from the discrete distribution of nonaffected animals. When the qPCR result of the pooled test was smaller than the chosen limit of detection of the assay, that meant that the test correctly classified the pool (composed of negative samples) as negative (true negative). When the qPCR result of the pooled test was larger than the chosen limit of detection of the assay, that meant that the test incorrectly classified the pool (composed of negative samples) as positive (false positive). By counting the number of iterations that gave 1) a true negative result and 2) a false positive result, the PSp was estimated.
An option to increase sensitivity at herd level is to use targeted sampling. If samples are selected from animals that show signs compatible with PMWS, the probability of detecting the disease would be theoretically increased. Besides, targeted sampling is a more precise representation of what is expected to occur in reality as animals with signs compatible with PMWS are more likely to be sampled. For targeted sampling, calculations and assumptions (prevalence of affected animals, number of samples per pool, and detection limit of the assay) were identical to those of random sampling, but the healthy animals were eliminated from the analysis, and only the qPCR results from animals wasted non-PMWS were used to construct discrete distribution which represented the qPCR values of the nonaffected animals.
Monte Carlo simulation: sensitivity and specificity at herd level (HPSe and HPSp). The HPSe is defined as the probability of a test positive pool given that at least one of the animals from the herd is truly affected. For a herd test based on r pools with k samples per pool, the HPSe may be estimated as 7 :

The HPSp is dependent only on PSp and may be estimated as 7 :

The HPSe and HPSp were estimated for 1 pool and also for 2 and 3 pools (the herd was considered as positive if at least one of the r pools was positive). The estimations of HPSe and HPSp are based on the assumption of no clustering of prevalence, PSe and PSp.
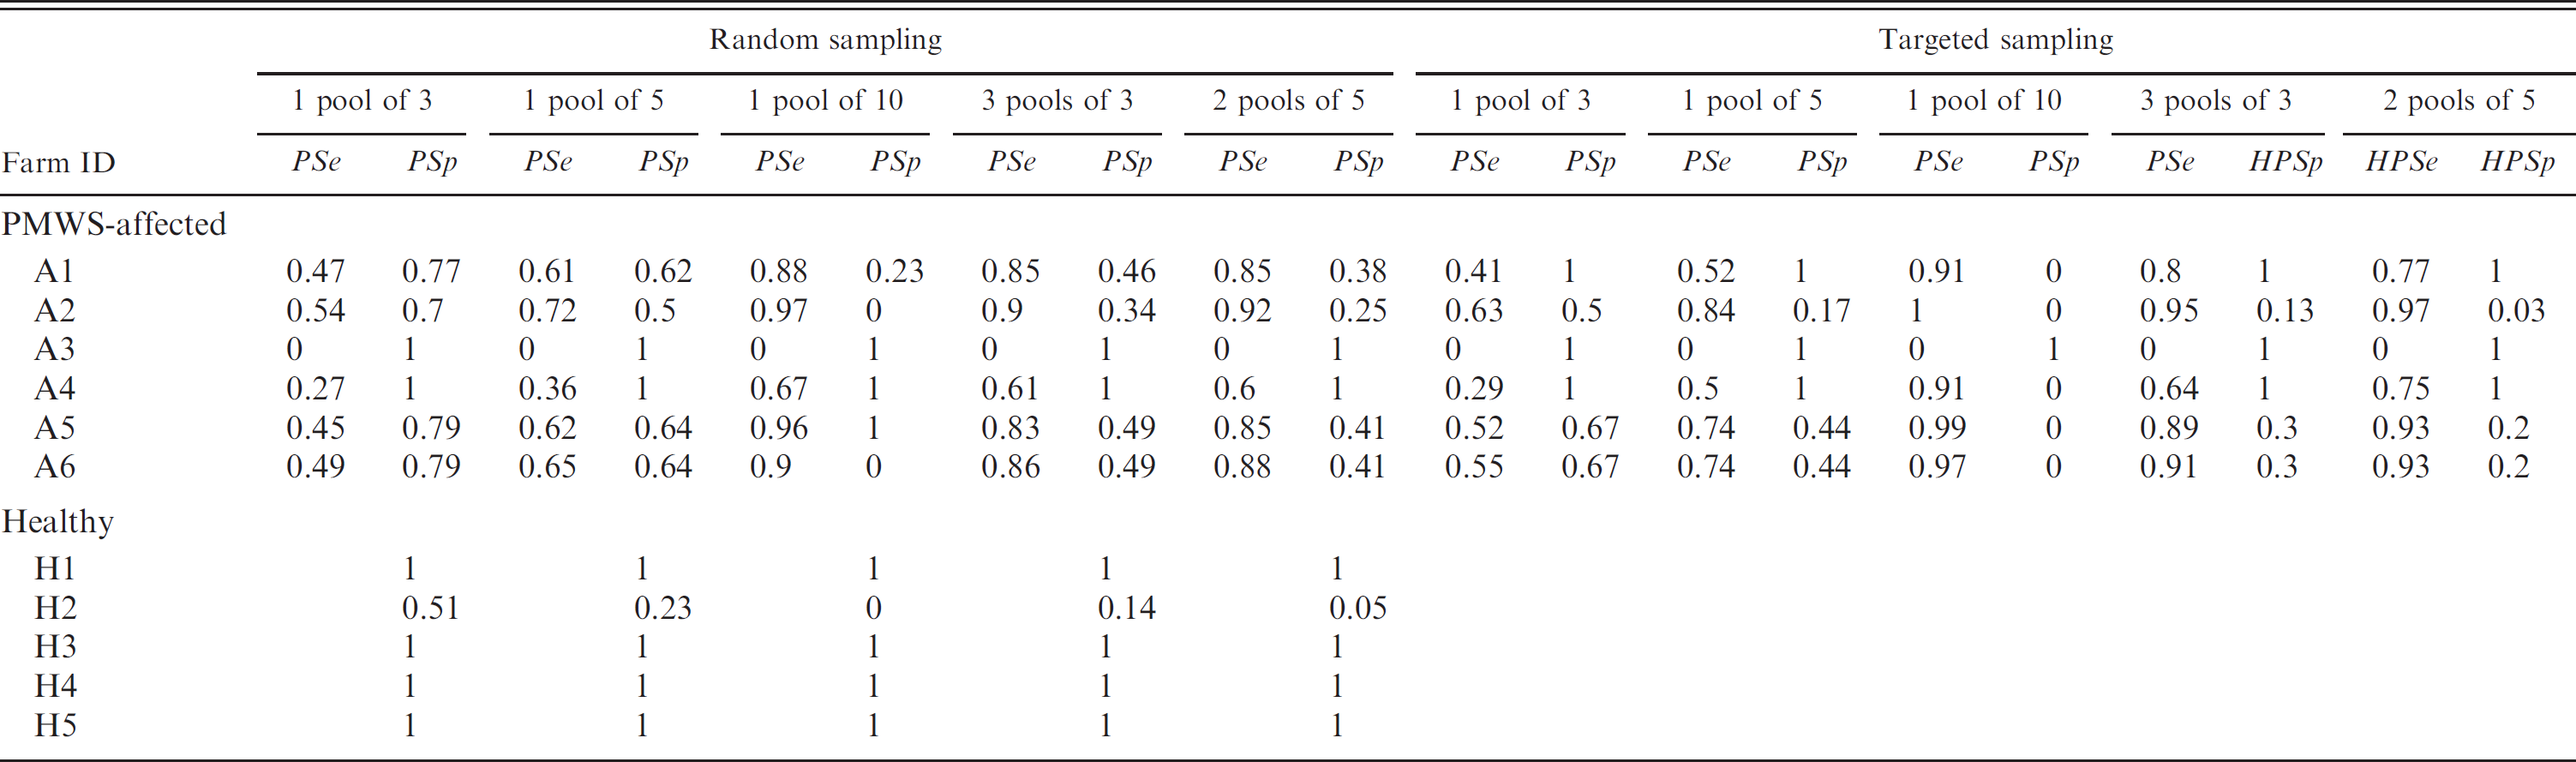
Combination simulation: estimation of PSe and PSp. The accuracy of the diagnosis at pool level also was also assessed by generating all the possible combinations of pools of 3, 5, and 10 individuals per farm using a spreadsheet b macro program. A pool that contained at least one affected animal (based on histopathology and PCV-2 in situ hybridization results) was considered as diagnostic of PMWS. In contrast, a pool containing only non-PMWS individuals was considered as negative. PSe in affected farms and PSp in affected and unaffected farms were estimated with different combinations of sample pooling using 9 or 10 sera per farm (3 pools of 3, 2 pools of 5, and 1 pool of 10). PSe for nonaffected farms was impossible to calculate because no PMWS or wasted non-PMWS individuals were detected in non-affected farms; thus, no positive pools were possible.
Results
Validation of the qPCR thresholds with pooled sera
The expected qPCR results (Fig. 1) were compared with the results of the pools prepared in the laboratory. No discrepancies were reported for pools of 3, 5, and 10 samples. However, some discrepancies were noticed in the pools of 20 sera: 22 of 77 pools gave incorrect inferences. In all cases, pools that should have been categorized as doubtful were scored as PMWS (data not shown). Given the lack of accuracy showed by pools of 20 samples, they were excluded from the remaining studies.
Pool and herd Se and Sp estimations
Overall, better PSe/HPSe and worse PSp/HPSp estimations were reported as the number of individuals in the pool increased (Table 2). For Sp estimations in the range of 0.80, Se values of approximately 0.35 were observed. Conversely, when Se values were higher than 0.90, Sp values drop under 0.40, thus increasing the probability of finding false positives. The best PSp and PSe estimations were obtained when a single pool of 10 individuals was used. At the herd level, both a single pool of 10 individuals and 2 pools of 5 individuals showed the best HPSp and HPSe estimations. The estimations obtained using targeted sampling did not improve the estimations obtained by random sampling. In general, neither of the combinations tested gave acceptable Se and Sp values together.
The accuracy of the diagnosis at farm level is shown in Table 3. For PMWS-affected farms, the best diagnostic accuracy was obtained using a single pool of 10 individuals, where satisfactory Se were reported in 5 of 6 farms, indicating that the model would correctly diagnose them, despite the fact that Sp values were close to zero. One farm would be wrongly diagnosed. In the case of non-PMWS-affected farms, results were very similar, regardless of the pool size used and 4 of 5 correctly diagnosed farms.
Estimations of pool sensitivity (PSe), pool specificity (PSp), herd pool sensitivity (HPSe), and herd pool specificity (HPSp) obtained by Monte Carlo simulations, depending on the within-farm prevalence, pool size, adapted quantitative polymerase chain reaction cut-off values of the pooled sample, assuming random or targeted sampling within the farm.
Discussion
Several studies have explored the possibility to use the PCV-2 qPCR as a technique to establish an individual PMWS diagnosis based on a certain cut-off threshold of PCV-2 genome copies/ml serum. 4,11,12,25,33 Only in one of these studies 11 were sensitivity and specificity of 2 different PCV-2 qPCR assays assessed in comparison with the standard PMWS diagnosis based on histopathology and PCV-2 detection in lymphoid tissues. 31,35 Unfortunately, one of the techniques in that study offered high sensitivity (91.3%) but low specificity (46.7%), whereas the other yielded low sensitivity (48.6%) but high specificity (90.7%). 11 Therefore, a desirable confidence level for establishing a correct individual diagnosis was not obtained. The main conclusion that qPCR (combined or not with PCV-2 serology) was not able to substitute histopathology plus detection of PCV-2 in tissues for the individual PMWS diagnosis within PMWS-affected farms 11 provided the impetus for the present study to assess feasibility of using serum sample pooling for qPCR testing to diagnose PMWS in a reliable manner.
Pooling of samples has been frequently used for herd screening programs and prevalence studies. 37,38 In the present study, 2 simulation studies were used to approach the diagnosis of PMWS with pooled serum samples, using qPCR thresholds as the criteria to determine the disease status of a given pool. Pooled serum samples were used to test the reliability of real pools compared with theoretical pools.
The Monte Carlo simulations used the distribution of all values, whereas the combination simulations studied the data per individual farm. Despite the fact that most of the farms were correctly diagnosed, these inferences at the farm level should be taken very cautiously because 1) the individuals sampled in each farm (10–26 animals) may not be representative of the population on those farms; 2) several zero PSe or PSp values were reported; 3) high qPCR values in one of the healthy farms (H2, qPCR mean load of 7.72 log10) may be indicative of a wrong clinical diagnosis in this particular farm; and 4) no farms with clinical wasting not caused by PMWS were tested, and sampled farms may represent only extreme (affected or nonaffected) farms in regard to the targeted disease.
Interestingly, targeted sampling (including only clinically diseased pigs) did not result in better estimations than random sampling. The increase in Se came together with an even higher decrease in Sp. This apparently contradictory situation (lack of diagnostic reliability difference using targeted or random sampling) is not surprising. Targeted sampling is composed of a mixture of potential PMWS-affected as well as wasted non-PMWS pigs, whereas random sampling includes mostly healthy individuals (disease prevalence may vary between 4% and 30%).
31
Taking into account that all studied diseased farms had a PMWS diagnosis, the possibility to discriminate between truly PMWS cases and non-PMWS cases (wasted non-
Pool sensitivity (PSe) and pool specificity (PSp) estimations in postweaning multisystemic wasting syndrome (PMWS)-affected and nonaffected farms using combination simulations for various pool sizes.
Theoretically, the inclusion of farms with animals displaying clinical wasting not caused by
Acknowledgements
This work was funded by projects 513928 from the Sixth Framework Programme of the European Commission, GEN2003-20658-C05-02 (Spanish Government), and Consolider Ingenio 2010-PORCIVIR (Spanish Government). Martí Cortey holds a Beatriu de Pinós postdoctoral research grant funded by the Government of Catalonia. The authors thank Dr. A. Olvera for valuable commentaries during discussion and M. Simon for providing samples from healthy farms.
Footnotes
a.
NucleoSpin® Blood, Macherey-Nagel GmbH & Co. KG, Düren, Germany.
b.
Microsoft® Office Professional Edition, 2003, Microsoft Corp., Redmond, WA.
c.
@Risk version 5.5.0, Palisade Corp., Ithaca, NY.