
Abstract
Pseudorabies virus (PRV) is the cause of Aujeszky’s disease, a disease that is significant economically for the swine industry worldwide. A real-time polymerase chain reaction (PCR) assay based on the gB and gE genes was used to identify PRV nucleic acid in diagnostic samples. Using virus isolation (VI) as the gold standard, the PCR assay performed well in a variety of diagnostic matrices. Testing was conducted on 1,027 nasal swabs with the following findings: gB sensitivity: 94.6% (95% confidence interval [CI]: 92.3–96.4%), specificity: 71.0% (95% CI: 64.0–77.3%); gE sensitivity: 94.6% (95% CI: 92.3–96.4%), specificity: 79.3% (95% CI: 72.9–84.7%). Diagnostic performance of the real-time PCR assay developed as a testing method indicates that it is a rapid, accurate assay that can provide reliable results on clinical samples.
Pseudorabies virus (PRV), also known as Aujeszky’s disease, is caused by Suid herpesvirus 1, a member of the Alphaherpesvirinae subfamily. Pseudorabies virus is a neurotropic alphaherpesvirus that produces fatal encephalitis in newborn pigs, respiratory disorders in fattening pigs, and reproductive failure in sows. 7 Swine are the natural host of PRV, and most domestic animals (cattle, sheep, dogs, cats, and goats but not horses) and many wild animals (rats, mice, raccoons, opossums, rabbits, and several fur-bearing mammals) are susceptible to infection; death is the usual outcome in nonnatural hosts. 7 Although pseudorabies was eradicated from the U.S. commercial pig industry in 2004, feral swine infected with PRV can serve as a wildlife reservoir leading to sporadic infections of domestic pigs that may live in close contact with feral swine. 4 Even though PRV isolates may vary in pathogenicity, protection induced by commercial PRV vaccines appears to be effective against all wild-type PRV. 7 An important factor in PRV eradication programs has been the use of marker vaccines; for example, in the United States, gE-deleted modified live virus vaccines with an accompanying gE differential enzyme-linked immunosorbent assay (ELISA) were used in combination to eliminate wild-type virus–infected swine. 6
Maintenance of a PRV-free status involves surveillance of susceptible swine. Serological testing for PRV antibody is the most common method used for herd diagnosis; it is quite efficient and sensitive once the animal has seroconverted. However, this testing is insensitive during the acute stages of the infection. 5 A critical need for the current PRV surveillance program in the United States is the rapid detection of PRV infection. Real-time polymerase chain reaction (PCR) is a high-throughput test system that has potential to detect PRV during the acute phase of the infection or before seroconversion. A set of 2 real-time PCR PRV assays detecting gB and gE genes and using commercial chemistry has been demonstrated to be very effective for the detection and differentiation of field and vaccine strains of PRV. 3 The PCR assay is designed as a dual assay with both gB and gE gene targets: gB as a marker for PRV (field isolates, Shope strain, and all commercial marker vaccines) and gE as indicator of wild-type PRV (positive) or commercial marker vaccine strain (negative), with the analytical sensitivity of each assay about 0.1 plaque forming units per reaction. 3 The aim of the present study was to evaluate the real-time gB and gE PCR assay for use as a diagnostic assay to detect an acute PRV infection in experimentally infected pigs.
Conventionally raised pigs free of clinical disease were purchased at 3 weeks of age from a herd that was negative for Porcine reproductive and respiratory syndrome virus and PRV. They were transported to the National Animal Disease Center (NADC) and housed according to NADC Institutional Animal Care and Use Guidelines. Pigs were randomly assigned to treatment groups and acclimated to isolation rooms for 7–10 days before beginning the experiment at 0 days postinoculation (dpi). Three PRV animal experiments were completed using 178 pigs to study various aspects of PRV infection in swine (unpublished observations, 2010). The duration of the animal studies was scheduled for 28, 28, and 7 dpi for experiments 1–3, respectively. Depending on experiment, pigs were inoculated with 1 of 4 PRV isolates or a sham inoculum, and nasal swabs a were collected at selected times to test for PRV.
Viruses used were feral swine isolate GG150-FS268 b (hereafter, FS268) isolated from the vaginal tract of a naturally infected free-range feral sow 8 ; feral swine isolate 3CR Ossabaw c (hereafter, 3CR Os) isolated from a prepuce swab of a “healthy” feral swine boar on Ossabaw Island, Georgia; feral swine isolate Panther-117 c (hereafter, FP-117) isolated from a panther presumably infected via contact with feral swine 1 ; and a well-characterized domestic swine isolate PRV ISUVDL4892 d (hereafter, ISU4892) isolated from a case in Iowa. 9 Each virus was administered intranasally as either a “high dose” (approximately 106.3 50% cell culture infective dose [CCID50]) or a “low dose” (a 1,000-fold dilution of the high dose). Each isolate was propagated once in a swine testicular (ST) cell line in a 75-cm2 plastic flask inoculated with 0.5 ml of original stock virus. Virus was allowed to adsorb for approximately 1 hr followed by a medium change with minimal essential medium (MEM) e and then maintained in maintenance medium (MEM including 10% fetal bovine serum and 50 mg/l gentamicin). When cytopathic effects (CPEs) involved 80–90% of the monolayer (24–36 hr postinoculation) the flask was frozen and thawed twice at −80°C before clarifying the cell culture lysate (1,000 × g for 10 min). The supernatant was stored in 0.5-ml aliquots at −80°C.
Nasal swab (NS) samples were collected in 2 ml of MEM from 0 to 14 dpi for experiments 1 and 2 and from 0 to 7 dpi for experiment 3 and stored at −80°C until tested for virus. For viral DNA extraction, the sample was thawed, vortexed, and centrifuged (652 × g, 4°C, 30 min). All viral DNA was extracted from samples using a commercial kit. f After 4 washes, the DNA was mixed with the elution buffer and kept at −80°C until used in the PCR reactions. Real-time PCR assays for the detection of gB and gE genes were conducted using commercial chemistry g as previously reported. 3 Suspensions of 0.084 µg/ml gB plasmid and 0.023 µg/ml gE plasmid 3 were used as standards for the respective gB and gE real-time PCR assays. Virus isolation (VI) was performed on MARC (cloned African green monkey kidney cell line)-145 cells cultured at 37°C in 5% CO2 atmosphere in 24-well plastic plates. A confluent monolayer of cells was inoculated with 0.1 ml of filtered (0.45 µm) NS sample in a single well. After approximately 1 hr postinoculation, the medium was changed, and cells were incubated in maintenance medium at 37°C in 5% CO2 atmosphere for 96 hr, with daily monitoring for development of CPE. Negative samples were blind passed 1 time. A random sampling of PRV-positive wells was confirmed using PCR. Although all NS samples were tested for infectious virus using the MARC-145 cell line, NS from experiment 1 had initially been thawed 1 time and tested on ST cells before virus isolation on MARC-145 cells.
The sensitivity of the ST and MARC-145 cells for replicating PRV was compared using VI and PCR. For each virus, a 20-µl volume of stock challenge virus was inoculated into a 25-cm2 tissue flask containing a monolayer of either ST or MARC-145 cells. Approximately 1 hr postinoculation, the medium and flasks were incubated at 37°C in 5% CO2 atmosphere for 24 hr, at which time the flask was frozen at −80°C and thawed. The lysate was collected and clarified at 1,000 × g for 15 min, and a 0.5-ml volume of virus solution was dispensed into 2-ml cryovial tubes for storage at −80°C. Two vials were thawed for testing (second freeze–thaw cycle), and 2 vials were frozen and thawed 3 additional times before testing (fifth freeze–thaw cycle). Each isolate propagated in ST or MARC-145 cells was tested for infectious virus by titration of the virus on ST and MARC-145 cells. In addition, viral DNA was extracted and tested by PCR. Serum samples collected at 0 and 14 dpi were tested for PRV antibodies using an ELISA assay, i according to manufacturer’s recommendations, where PRV gB ELISA optical density sample-to-negative (S/N) ratio <0.60 is positive, S/N ratio >0.60 to ≤0.70 is suspect, and S/N ratio >0.70 is negative.
Sensitivity (Se), specificity (Sp), and kappa (κ) coefficients of agreement were calculated for the real-time PCR assay performance compared with results of VI, the gold standard test, using contingency tables and Fisher exact test (2-tailed) preformed with commercial software.j,k The κ coefficient of agreement can take values between 0 and 1, where poor agreement κ is <0.20, fair agreement κ = 0.20–0.39, moderate agreement κ = 0.40–0.59, good agreement κ = 0.60–0.79, and very good agreement κ = 0.80–1.00. 2
Control animals did not display clinical signs or lesions consistent with PRV infection. The PRV-inoculated pigs developed a spectrum of disease that ranged from mild to severe, which required euthanasia for humane reasons. Clinical signs observed included sneezing, anorexia, listlessness, increased respiration rates, dyspnea, rough-haired appearance, and loss of condition. The onset, magnitude, and duration of clinical signs were variable among pigs within a group and between groups inoculated with different viruses and seemed related to challenge dose (i.e., the groups that received the “high” dose had more virus-positive and affected pigs compared with the “low” dose groups). Moreover, there appeared to be differences in the pathogenicity of the viruses, with the ISU4892 being the most pathogenic followed by the FP-117, 3CR Os, and FS268 isolates, in that order. Mortality following inoculation did occur in some groups and is reflected in the reduction of pig numbers (decrease in the denominator) shown in Table 1.
Detection of Pseudorabies virus in nasal swabs by real-time polymerase chain reaction (PCR) assay and virus isolation (VI).
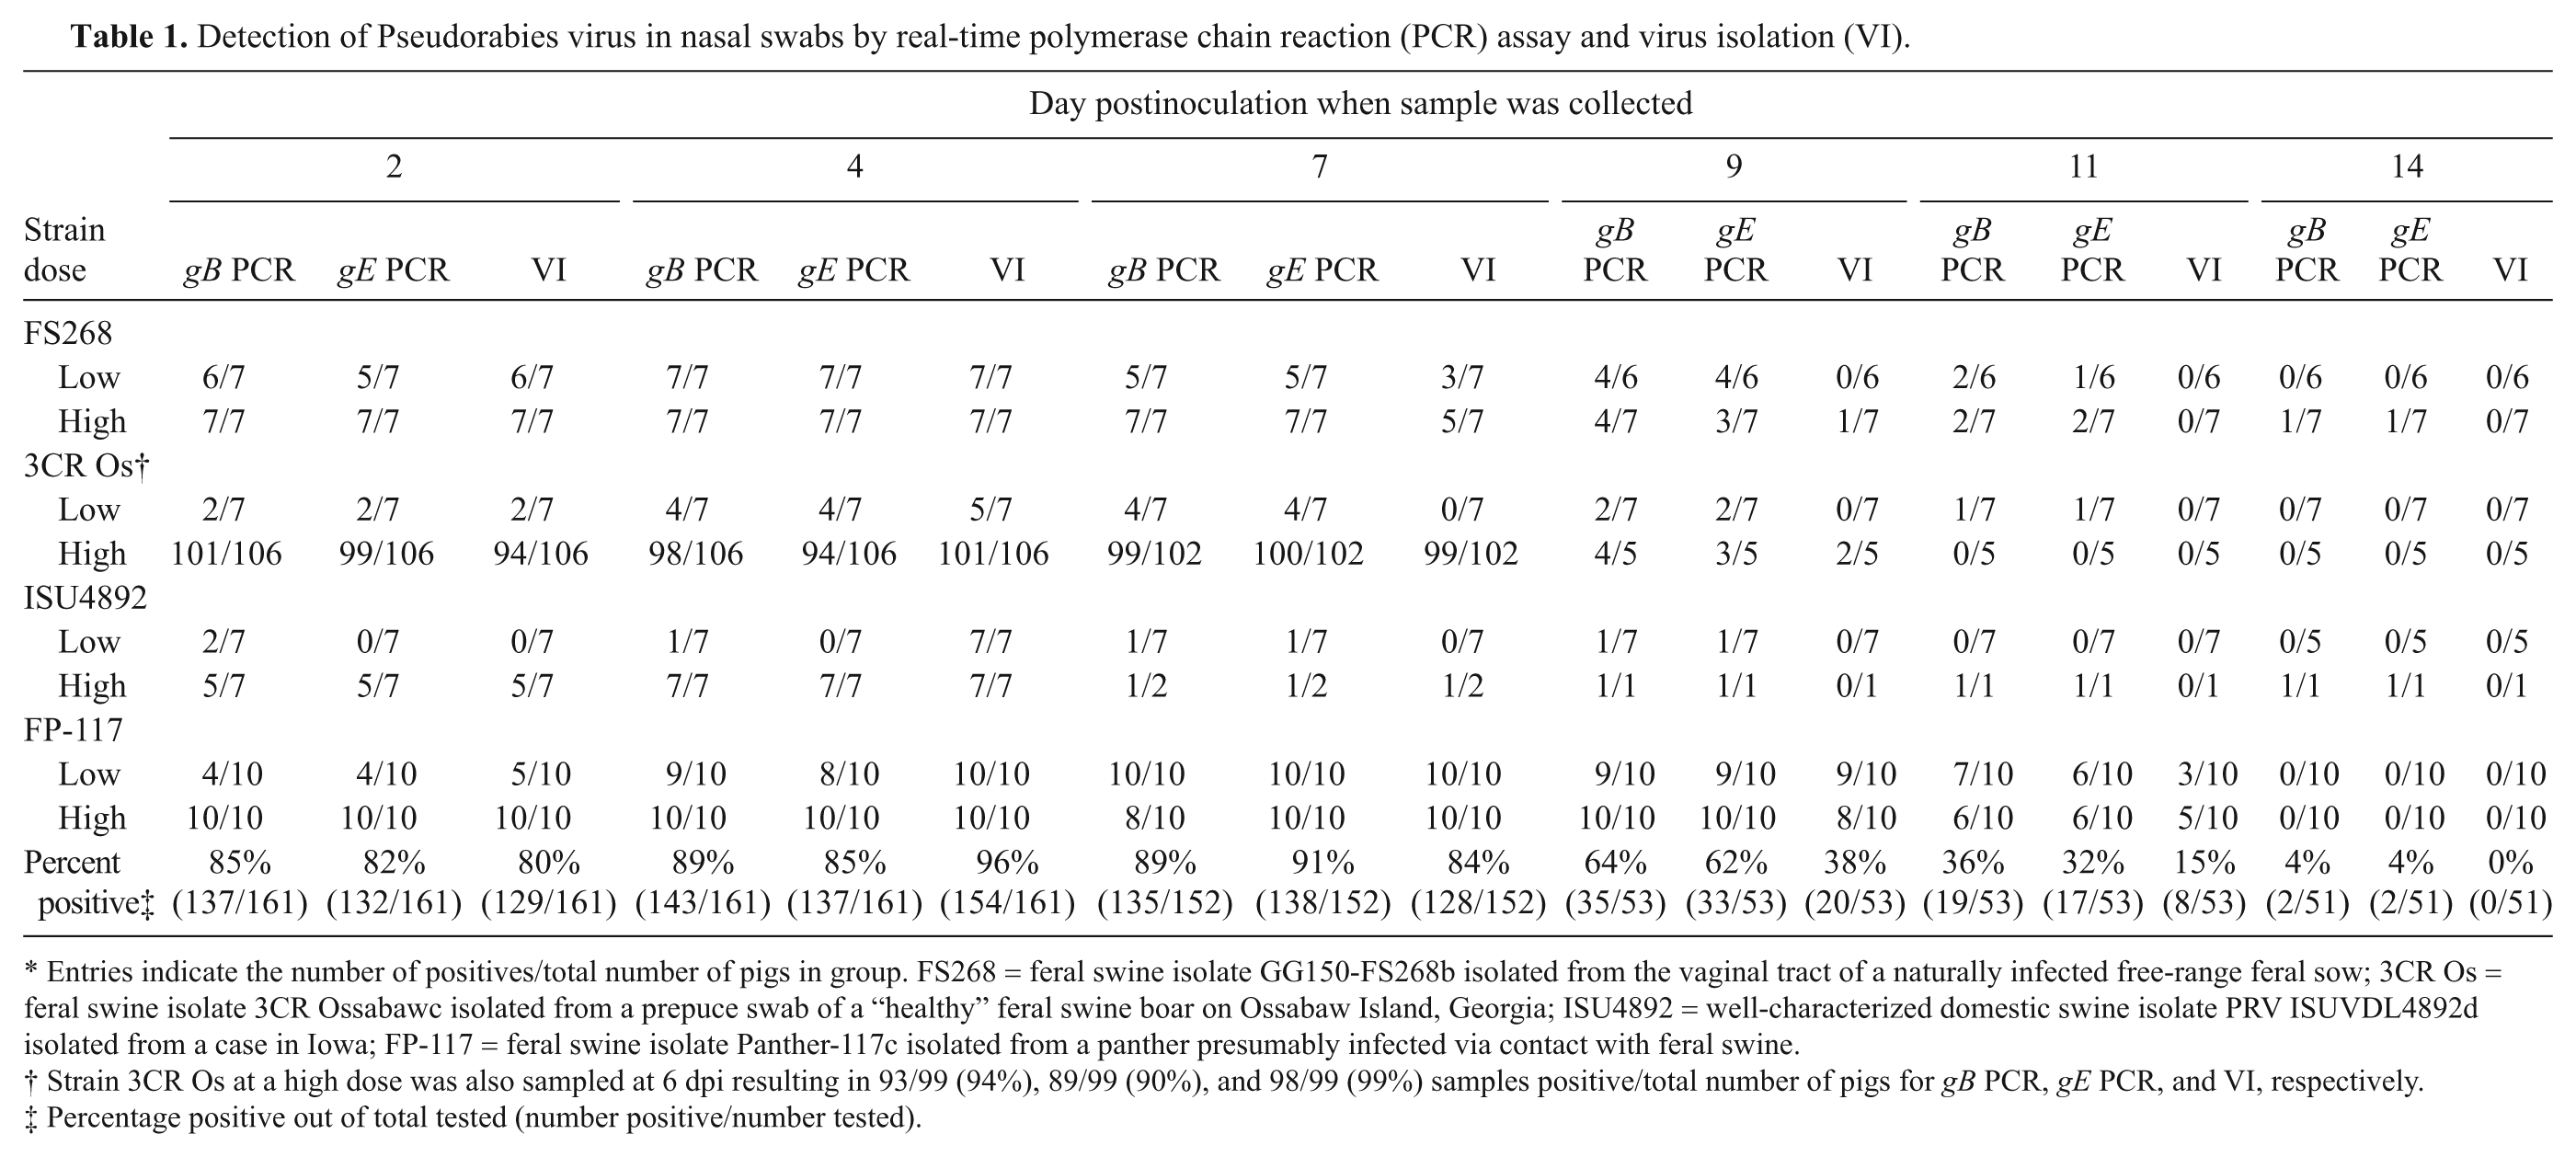
Entries indicate the number of positives/total number of pigs in group. FS268 = feral swine isolate GG150-FS268b isolated from the vaginal tract of a naturally infected free-range feral sow; 3CR Os = feral swine isolate 3CR Ossabawc isolated from a prepuce swab of a “healthy” feral swine boar on Ossabaw Island, Georgia; ISU4892 = well-characterized domestic swine isolate PRV ISUVDL4892d isolated from a case in Iowa; FP-117 = feral swine isolate Panther-117c isolated from a panther presumably infected via contact with feral swine.
Strain 3CR Os at a high dose was also sampled at 6 dpi resulting in 93/99 (94%), 89/99 (90%), and 98/99 (99%) samples positive/total number of pigs for gB PCR, gE PCR, and VI, respectively.
Percentage positive out of total tested (number positive/number tested).
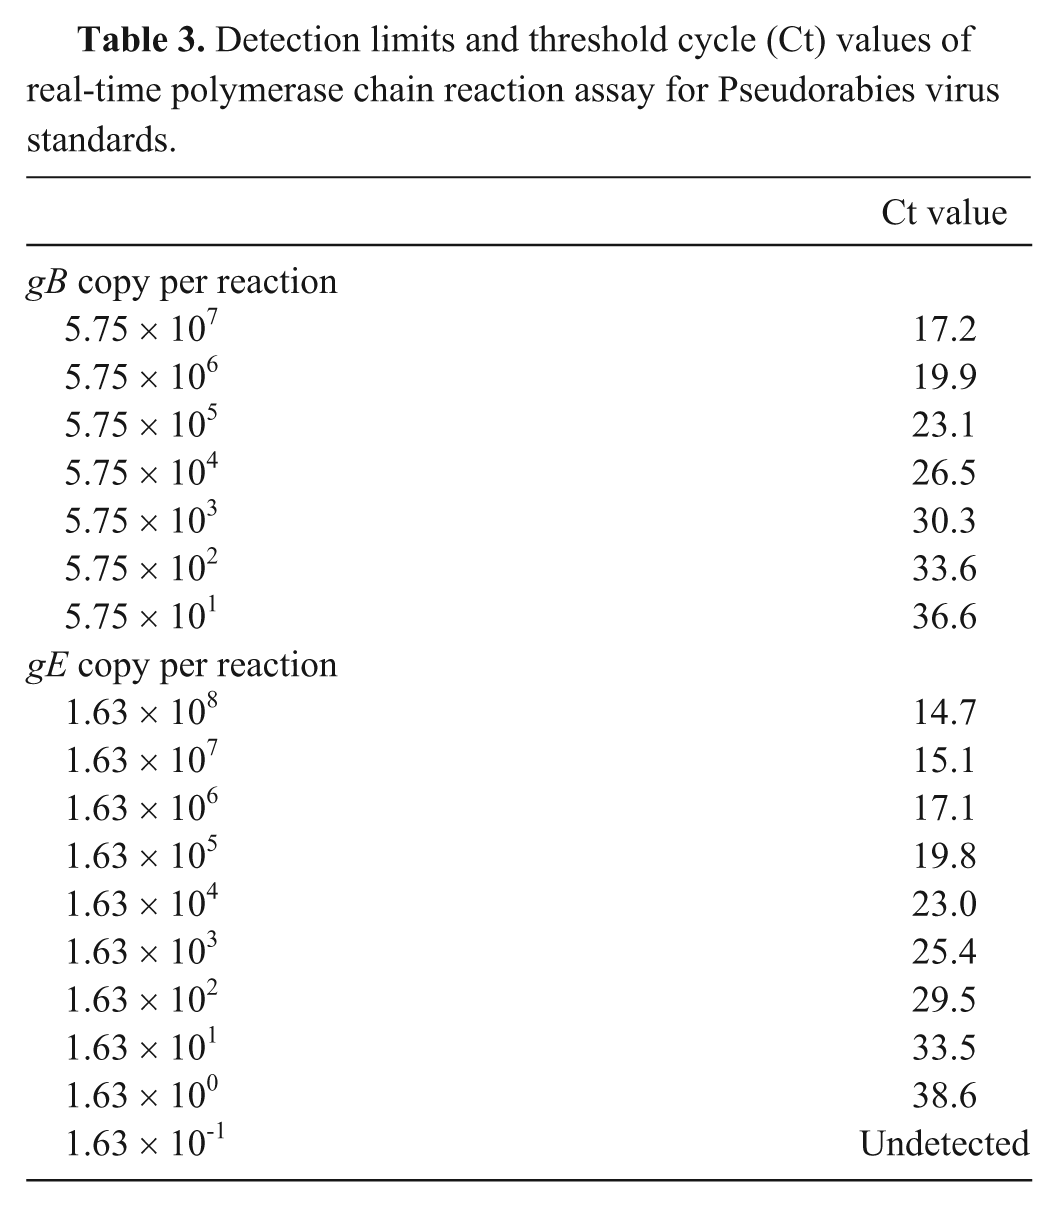
The MARC-145 cell line was chosen for VI because 1) the cells consistently grew better compared with ST cells in the laboratory, making the process of VI on hundreds of samples much more efficient; 2) PRV infection of MARC-145 cells induced a dramatic CPE consisting of large formations of syncytia that were easily observed; and 3) under the conditions of the current study, the MARC-145 cells were as sensitive or more so for PRV isolation compared with ST cells (Table 2). Compared with ST cells, the CPE for each PRV isolate that developed in MARC-145 cells following inoculation was more rapid and extensive by 24 hr, the time of freezing for each flask. However, the viral titers produced in either cell line were similar for each virus despite the cell line in which the virus was propagated (Table 2). Likewise, the quantitative PCR results were similar for viruses produced in ST or MARC-145 cells (Table 2). A suspension of field isolate PRV strains FS268, 3CR Os, and ISU4892, and plasmid, as well as serial dilutions in MEM, were tested in duplicate to determine real-time PCR assay sensitivity (Table 3). The real-time PCR assay was able to detect a range of positive dilutions (up to 10-5 using MEM as diluent). Concentrations of 102.2 CCID50/ml FS268, 101.7 CCID50/ml 3CR Os, and 101.9 CCID50/ml ISU4892 were detected (Table 4). Because of the small size of the PCR product, sequencing was not performed; however, size of the product was consistent among samples tested. In general, the gB threshold cycle values were lower than those from the gE PCR. A sample was classified positive if at least 1 duplicate tested positive for the following gB or gE PCR results.
Analytical comparison of Pseudorabies virus propagation in ST (swine testicular) cell line and MARC (cloned African green monkey kidney cell line)-145 cells by virus titration and by virus isolation via real-time polymerase chain reaction assay on ST or MARC-145 cells.*
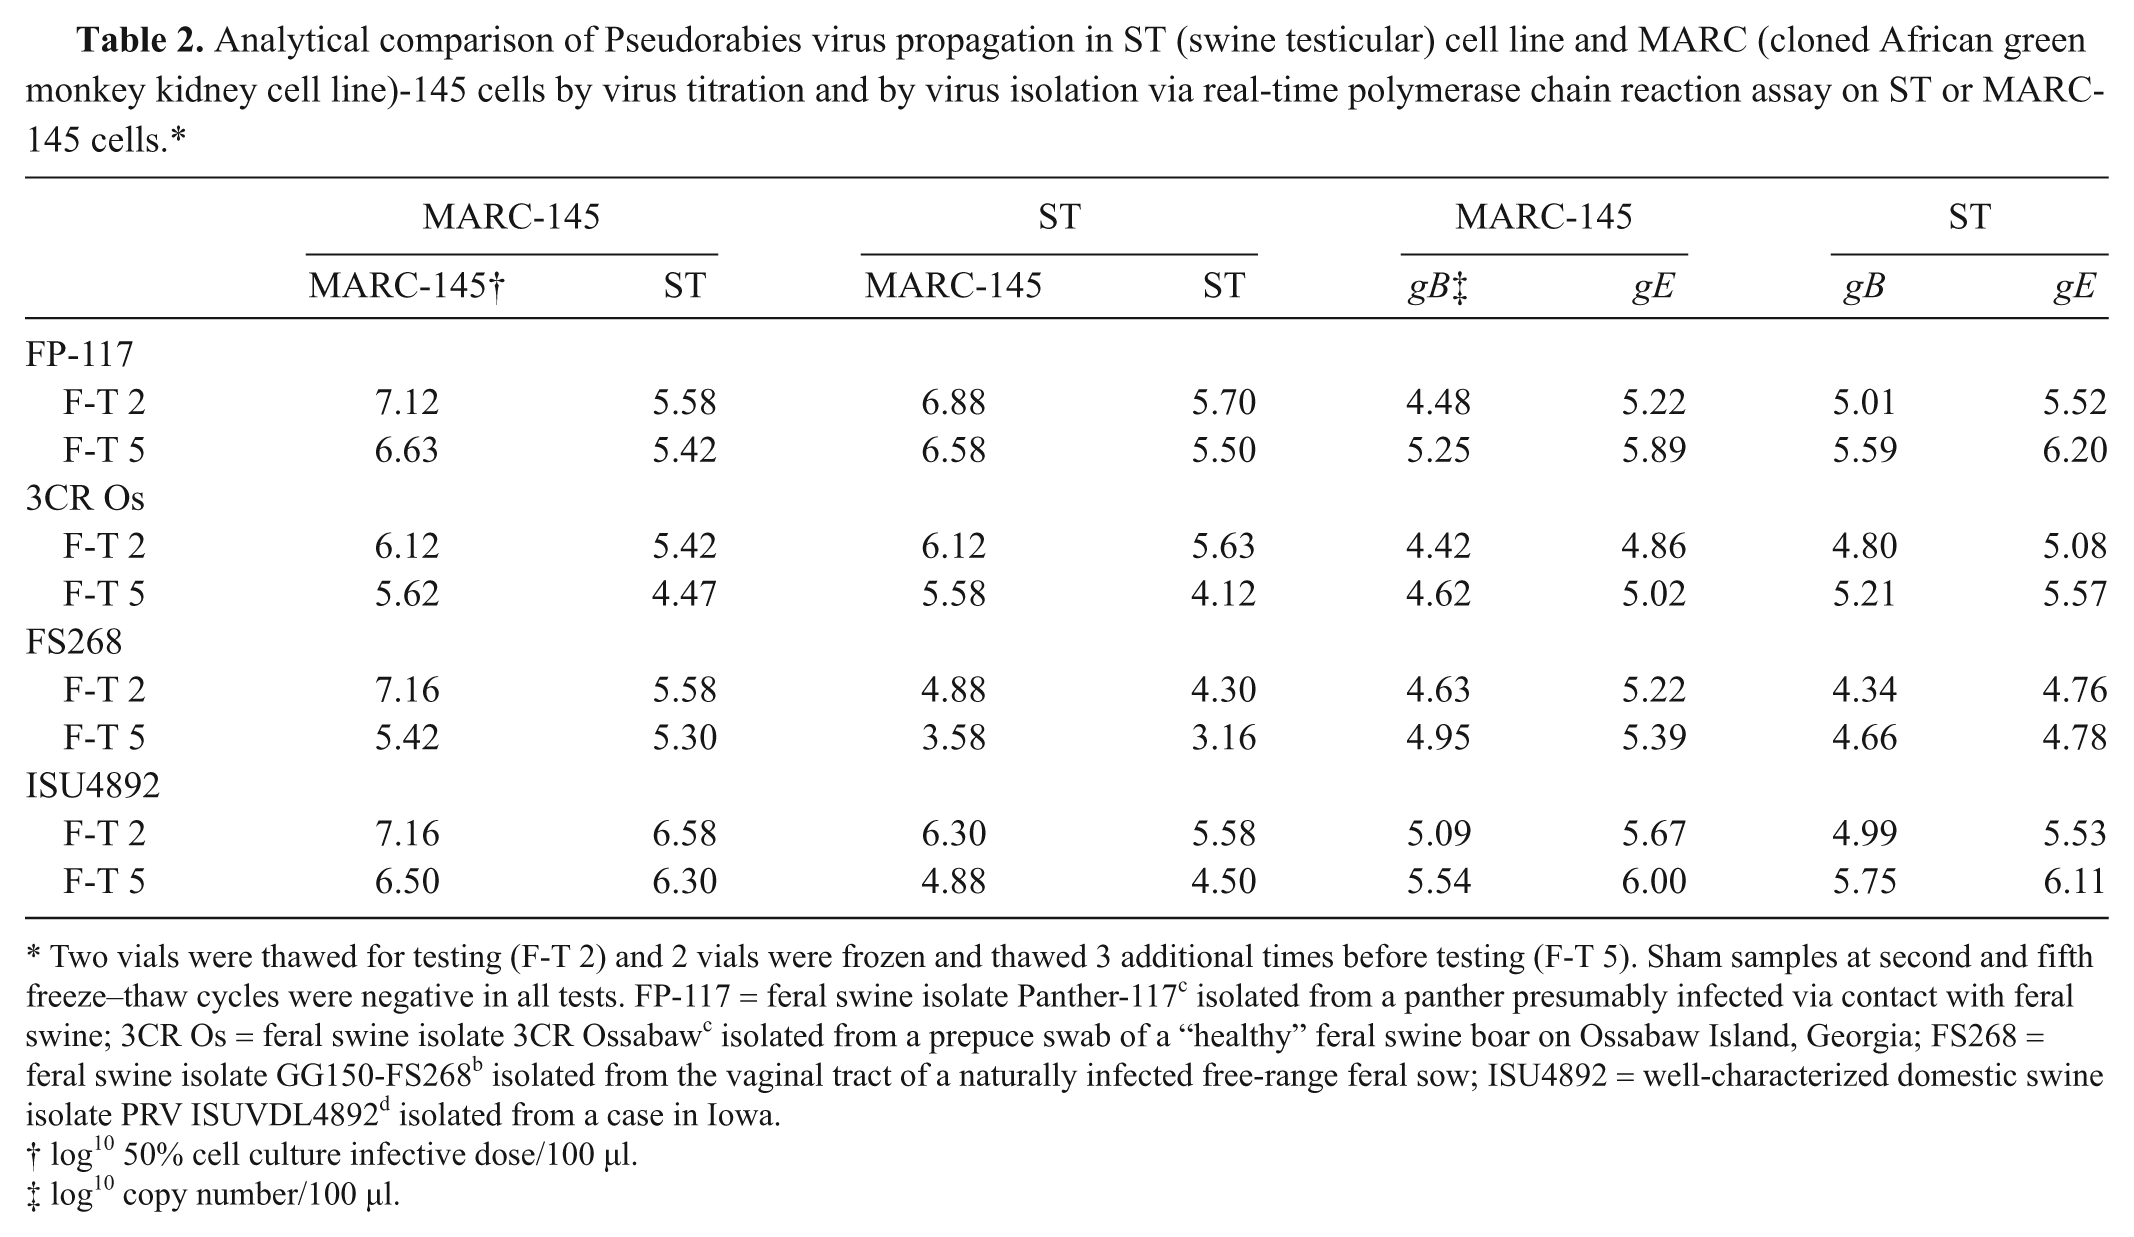
Two vials were thawed for testing (F-T 2) and 2 vials were frozen and thawed 3 additional times before testing (F-T 5). Sham samples at second and fifth freeze–thaw cycles were negative in all tests. FP-117 = feral swine isolate Panther-117 c isolated from a panther presumably infected via contact with feral swine; 3CR Os = feral swine isolate 3CR Ossabaw c isolated from a prepuce swab of a “healthy” feral swine boar on Ossabaw Island, Georgia; FS268 = feral swine isolate GG150-FS268 b isolated from the vaginal tract of a naturally infected free-range feral sow; ISU4892 = well-characterized domestic swine isolate PRV ISUVDL4892 d isolated from a case in Iowa.
log10 50% cell culture infective dose/100 µl.
log10 copy number/100 µl.
Detection limits and threshold cycle (Ct) values of real-time polymerase chain reaction assay for Pseudorabies virus standards.
Detection limits and threshold cycle (Ct) values of real-time polymerase chain reaction assay for Pseudorabies virus field samples.
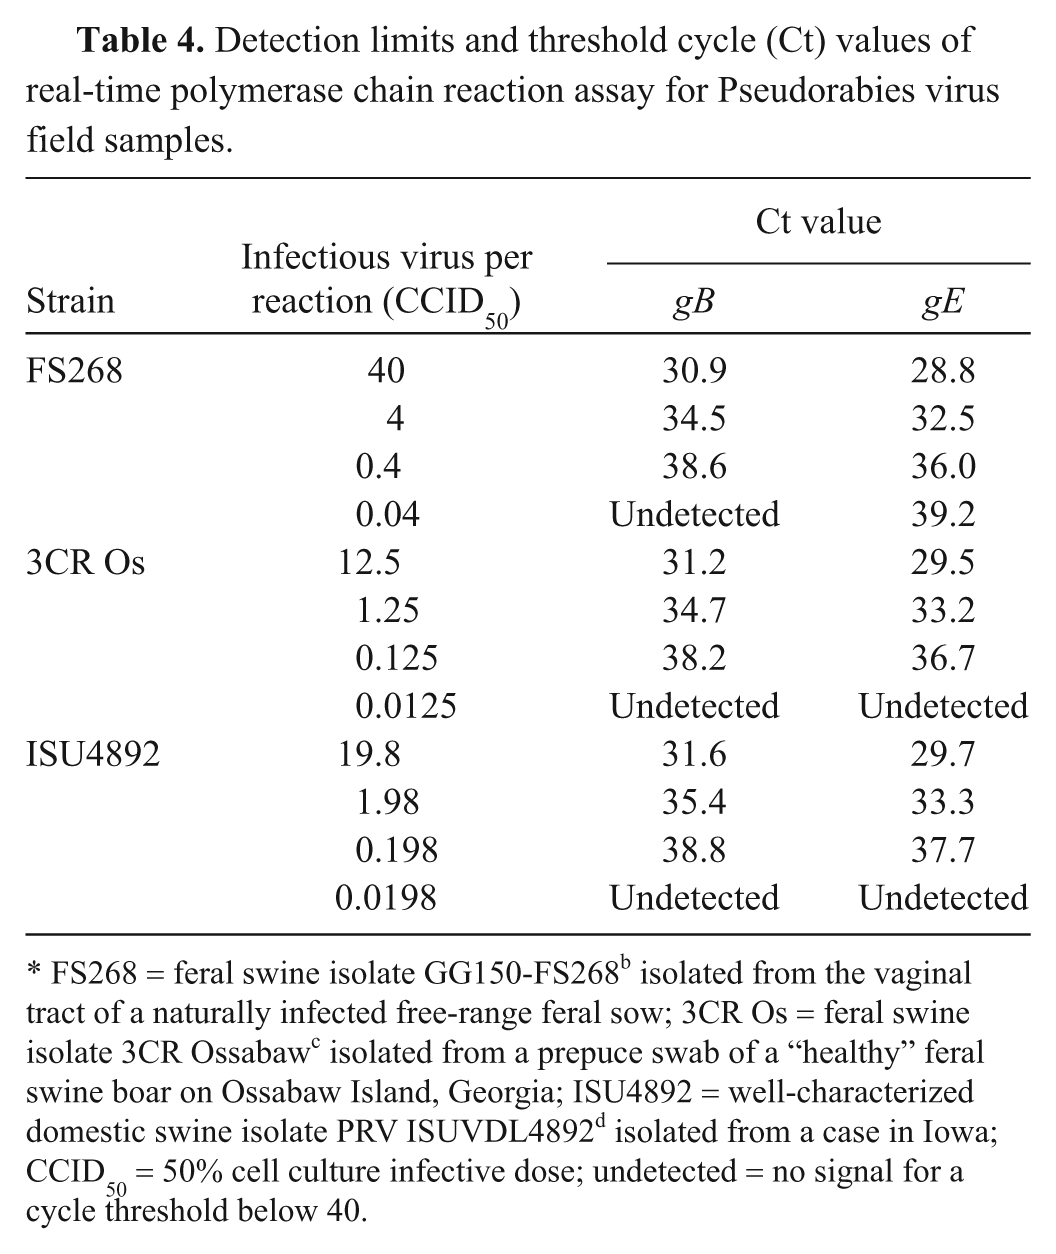
FS268 = feral swine isolate GG150-FS268 b isolated from the vaginal tract of a naturally infected free-range feral sow; 3CR Os = feral swine isolate 3CR Ossabaw c isolated from a prepuce swab of a “healthy” feral swine boar on Ossabaw Island, Georgia; ISU4892 = well-characterized domestic swine isolate PRV ISUVDL4892 d isolated from a case in Iowa; CCID50 = 50% cell culture infective dose; undetected = no signal for a cycle threshold below 40.
A total of 1,027 NS were collected from 0 to 14 dpi and tested for infectious virus; 136 NS were from 17 control pigs and 891 NS were from PRV-inoculated pigs. All samples from control pigs and the 0 dpi NS collected from the PRV-inoculated pigs were negative for infectious virus, a total of 297 NS samples (data not shown). Pseudorabies virus was isolated from 537 of the 730 NS collected 2–14 dpi from the 161 PRV-inoculated pigs (Table 1). The incidence of positive NS ranged from 80% at 2 dpi to 0% at 14 dpi with a peak of 99% at 6 dpi (Table 1). When individual challenge groups were compared, the incidence of positive NS was similar among groups, with apparent differences related to challenge dose. Due to relatively small animal numbers in some of the groups, statistical analysis was not applied to the incidence of positive NS among groups.
A total of 1,027 NS were tested with the gB and gE real-time PCR assays. For VI, 136 NS were from 17 control pigs and 891 NS were from PRV-inoculated pigs. All samples from control pigs tested negative by the gB and gE assays. One of the 161 NS samples collected from the PRV-inoculated pigs at 0 dpi tested positive by gB and gE, and the remaining 160 NS samples at 0 dpi tested negative by both gB and gE assays. Collectively, 296 of the 297 NS samples collected from the control pigs and the PRV-inoculated pigs at 0 dpi were negative by PCR (data not shown). The single PCR-positive 0 dpi sample that tested positive by gB and gE retested positive by the gB and gE assays and was negative by VI. Of the NS collected from 2 to 14 dpi from the PRV-inoculated pigs, 564 of 730 and 548 of 730 samples tested positive by the gB and gE assays, respectively (Table 1).
To evaluate the Se, Sp, and κ agreement for the gB and gE PCR assays, VI was used as the gold standard test. Overall, 73.6% of the swab samples tested positive by VI, and 77.3% and 75.1% tested positive by the gB and gE PCR assays, respectively. The Se, Sp, and κ values (Table 5) show a good agreement between the assays despite a higher percentage of positive samples in the PCR assays compared with VI. Most of the difference between the PCR-positive and VI-positive samples was detected at 9–14 dpi, with more samples being PCR positive than VI positive (Table 1). This is in contrast to 2–7 dpi, where more samples were VI positive than PCR positive, indicating a higher likelihood to isolate virus during the first week postchallenge compared with the second week.
Overall results, sensitivity (Se), specificity (Sp), and kappa (κ) degree of agreement for real-time polymerase chain reaction (PCR) assay versus virus isolation (VI) for Pseudorabies virus collected by nasal swab.*
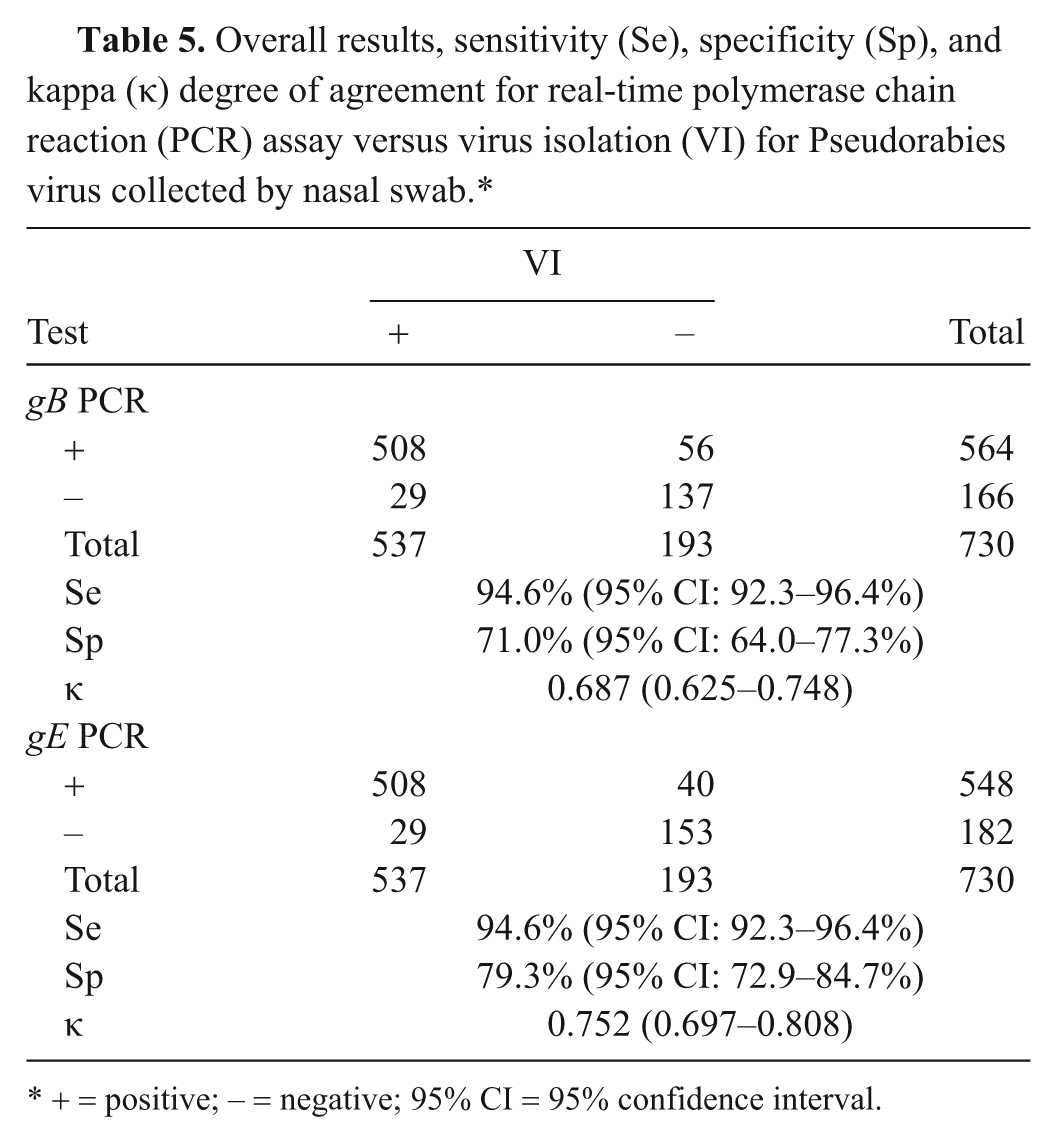
+ = positive; − = negative; 95% CI = 95% confidence interval.
Based on the ELISA, all PRV-inoculated pigs were seropositive by 14 dpi (mean S/N 0.26 ± 0.2) All control pigs for the duration of the study as well as all 0 dpi sera were negative (mean S/N 1.22 ± 0.03) for PRV gB antibody.
A variety of methods can be used to detect PRV infection in swine. Selecting a method or methods to use may be based on a number of factors (e.g., available equipment and reagents, the need to detect acute or chronic infections, and the necessity to screen large numbers of samples for antibody, antigen, infectious virus, or viral nucleic acid). In PRV-free swine herds, detection of antibody is a very efficient and reliable tool to monitor PRV status. 7 A limitation of this type of testing is the potential to miss positive animals because they have not yet seroconverted. The potential of a real-time PCR test to detect PRV during the acute phase of infection was evaluated at a time when pigs would be developing a humoral response and thus would be seronegative by currently available antibody tests.
The acute nature of the PRV infection observed in experiments 1–3 is demonstrated in Table 1 with isolation of infectious PRV by 2 dpi in most inoculated pigs and in 99% of the pigs at 6 dpi. The incidence of VI-positive pigs decreased to 0% by 14 dpi, a time when all surviving animals have become antibody positive. The incidence of PCR-positive pigs mirrors the VI data with slight temporal differences in which the incidence of VI-positive pigs is similar to or greater than PCR-positive pigs during the first week of infection and the incidence of PCR-positive pigs is greater than VI-positive pigs during the second week of the infection.
Real-time PCR assays have been developed and standardized for the detection of wild-type PRV using the gB gene target and the gE gene to differentiate from vaccine virus. 3 In the present study, the real-time PCR assays were evaluated for diagnostic and surveillance potential and showed a high sensitivity that detected the viral genome in every inoculated pig. Utilization of a real-time PCR assay eliminates the requirement of separate amplification and detection reactions associated with gel-based techniques. Compared with conventional PCR, real-time PCR assays based on fluorogenic probes have additional advantages, including improved sensitivity that is based on very short amplification products and results in increased specificity, simultaneous detection of relevant PCR products using multichannel analysis, and reduction of cross-contamination through absence of post-PCR handling of product.
The higher sensitivity of the real-time PCR assays compared with VI assays was demonstrated in the present study. The real-time PCR assay as described 3 detected a number of various PRV strains including feral and domestic from different geographical regions. The potential for false-positive or false-negative results is a risk associated with any amplification-based assay, including real-time PCR. In the current study, 1 PCR false-positive was easily detected because it was found in a sample collected at 0 dpi. This sample was still positive by both PCR assays upon retest but was negative by VI. Although it is not known why this sample was PCR positive, a technical mistake is presumed to have been made (i.e., a mistake in tube labeling). Nevertheless, there was 1 known PCR-positive sample of 298 samples that should have all been negative because they were either collected from nonchallenge control pigs or collected prior to challenge (0 dpi) in the challenge pig groups. It is not possible to assess the potential for false-positive results in the PRV-challenged pigs because all pigs were considered positive (i.e., virus was isolated [gold standard] at least 1 time from each challenge pig, at least 1 NS sample was PCR positive for each pig, and all pigs alive at 14 dpi were seropositive). Although each PRV-inoculated pig was deemed PRV positive, not all samples tested from each pig were positive (Table 1). It is believed that the detection of negative samples in the virus-challenged animals reflects more upon the host response to the disease and not a false-negative rate of approximately 25% overall.
Collectively, results from these studies indicate that natural infection of domestic swine with feral swine PRV isolates should be detected either through detection of virus during the acute phase of the infection or through detection of antibody in the convalescent phase of the infection. This conclusion supports many current control programs that screen sera for PRV-specific antibody and that may consider incorporating testing tissues for virus by real-time PCR.
Footnotes
Acknowledgements
Dr. Eraldo Zanella was a recipient of a scholarship from CNPq/Brazil in partial support of this work. The authors thank Dr. Romero from the University of Florida for the feral swine isolate FS268, Dr. Stallknecht from the Southeastern Cooperative Wildlife Disease Study for the feral swine isolate C3R Ossabaw Is and the panther isolate FP117-05, and Dr. Yoon from Iowa State University for the domestic swine isolate ISUVDL4892. The authors would also like to thank S. Anderson and D. Adolphson for technical assistance, and S. Ohlendorf for secretarial assistance in preparation of the manuscript.
Mention of trade names or commercial products in this article is solely for the purpose of providing specific information and does not imply recommendation or endorsement by the U.S. Department of Agriculture (USDA). The USDA prohibits discrimination in all its programs and activities on the basis of race, color, national origin, age, disability, and, where applicable, sex, marital status, familial status, parental status, religion, sexual orientation, genetic information, political beliefs, reprisal, or because all or part of an individual’s income is derived from any public assistance program. (Not all prohibited bases apply to all programs.) Persons with disabilities who require alternative means for communication of program information (Braille, large print, audiotape, etc.) should contact the USDA TARGET Center at (202)720-2600 (voice and TDD). To file a complaint of discrimination, write to USDA, Director, Office of Civil Rights, 1400 Independence Avenue, SW, Washington, DC 20250-9410, or call (800)795-3272 (voice) or (202)720-6382 (TDD). USDA is an equal opportunity provider and employer.
a.
Dacron® nasal swabs, American Scientific. Products, McGraw Park, IL.
b.
Dr. Carlos H. Romero, Department of Infectious Diseases and Pathology, University of Florida, Gainesville, FL.
c.
Dr. David E. Stallknecht, Southeastern Cooperative Wildlife Disease Study, Department of Medical Microbiology and Parasitology, College of Veterinary Medicine, The University of Georgia, Athens, GA.
d.
Dr. Kyoung-Jin Yoon, Veterinary Diagnostic Laboratory, College of Veterinary Medicine, Iowa State University, Ames, IA.
e.
Invitrogen Corp., Carlsbad, CA.
f.
KingFisher MagMax-96 Viral RNA isolation kit (Ambion 1939), Life Technologies, Grand Island, NY.
g.
TaqMan® Universal PCR, Applied Biosystems, Carlsbad, CA.
h.
7500 Real-Time PCR System, Applied Biosystems, Carlsbad, CA.
i.
Pseudorabies Virus gB Antibody Test Kit Assay, IDEXX Laboratories Inc., Westbrook, ME.
j.
GraphPad Software, La Jolla, CA.
k.
CLIVE consortium, University of Edinburgh.
Declaration of conflicting interests
The author(s) declared no potential conflicts of interest with respect to the research, authorship, and/or publication of this article.
Funding
The author(s) disclosed receipt of the following financial support for the research, authorship, and/or publication of this article: This work was supported by Interagency Agreement 0414701 between the U.S. Department of Agriculture Agricultural Research Service and Animal and Plant Health Inspection Service.