
Abstract
P-glycoprotein, encoded by the MDR1 or ABCB1 gene, is an integral component of the blood–brain barrier as an efflux pump for xenobiotics crucial in limiting drug uptake into the central nervous system. Dogs homozygous for a 4–base pair deletion of the canine MDR1 gene show altered expression or function of P-glycoprotein, resulting in neurotoxicosis after administration of the substrate drugs. In the present study, the usefulness of microchip electrophoresis for genotyping assays detecting this deletion mutation was evaluated. Mutagenically separated polymerase chain reaction (MS-PCR) and real-time PCR assays were newly developed and evaluated. Furthermore, a genotyping survey was carried out in a population of Border Collies dogs in Japan to determine the allele frequency in this breed. Microchip electrophoresis showed advantages in detection sensitivity and time saving over other modes of electrophoresis. The MS-PCR assay clearly discriminated all genotypes. Real-time PCR assay was most suitable for a large-scale survey due to its high throughput and rapidity. The genotyping survey demonstrated that the carrier and mutant allele frequencies were 0.49% and 0.25%, respectively, suggesting that the mutant allele frequency in Border Collies is markedly low compared to that in the susceptible dog breeds such as rough and smooth Collies.
Introduction
P-glycoprotein (P-gp), an adenosine triphosphate (ATP)-driven multidrug efflux carrier, is the product of the multidrug-resistance MDR1 gene. 9 More recently, the MDR1 gene has also been referred to as ABCB1 based on the systematic nomenclature of the ATP-binding cassette transporter family. 6 P-glycoprotein is expressed in various mammalian tissues such as the brush border membrane of epithelial cells in the intestinal tract, the luminal membrane of proximal tubules in the kidney, and the canalicular membrane of liver hepatocytes. 33 Apical and luminal expression of P-gp in these organs diminishes oral drug bioavailability and promotes drug elimination into urine and bile. 8 Additionally, at the blood–brain barrier, P-gp is expressed at the luminal membrane of endothelial cells of the brain capillaries 5 and restricts the entry of drugs into the central nervous system by an efflux-based transport mechanism. 30
In 2001, a 4–base pair (bp) deletion mutation (c.227_230del) was identified in the canine MDR1 gene and was referred to as mdr1-1Δ, ABCB1-1Δ, or MDR1 nt230(del4).10,23-25 This mutation results in generation of a truncated P-gp with a length of approximately 7% of the full-length P-gp. 28 The MDR1 mutation correlates with the ivermectin-sensitive phenotype that was recognized in Collie dogs in the early 1980s.26,31 To date, this mutation has been detected in more than 10 dog breeds including rough Collie, smooth Collie, Shetland Sheepdog, Australian Shepherd, miniature Australian Shepherd, Border Collie, Old English Sheepdog, English shepherd, German Shepherd Dog, white Swiss shepherd, Wäller, longhaired Whippet, silken windhound, and McNab.7,11,12,24,25 Dogs homozygous for the deletion mutation do not express a functionally intact P-gp and show increased sensitivity to many P-gp–transported drugs such as moxidectin, milbemycin oxime, acepromazine, butorphanol, digoxin, vincristine, and loperamide as well as ivermectin.7,20,22 There is also a report that the pharmacokinetic parameters of fexofenadine and quinidine are significantly altered in MDR1 mutant dogs. 18 Regarding some of these drugs, brain penetration is highly increased, and the dogs develop severe neurotoxicosis, even when the drugs are administered at a normal therapeutic dosage, as in the case of ivermectin and doramectin.7,20,22
Several different genotyping methods have been described for the detection of the 4-bp deletion mutation.1,10,15,16,25,28 Most of these methods use PCR amplification of the flanking regions followed by length polymorphism (LP) analysis most often performed by polyacrylamide gel electrophoresis (PAGE)10,25,28 and rarely by agarose gel electrophoresis. 15 These methods have various problems including time-consuming technique, detection sensitivity, and waste management. In the present study, the usefulness of microchip electrophoresis for LP-based genotyping assays was evaluated. Mutagenically separated PCR and real-time PCR assays were newly developed for clear genotype discrimination. Furthermore, the genotyping survey was carried out in a population of Border Collies in Japan to determine the allele frequency in this breed.
Materials and methods
Standard samples and treatment
Control DNA samples for each genotype were obtained from 7 rough and 2 smooth Collies from a kennel specializing in Collies after obtaining informed consent from the breeder, and 4 Beagles kept as blood donors by the Veterinary Teaching Hospital in Kagoshima University. The samples were collected as saliva specimens spotted on Flinders Technology Associates filter papers (FTA card), a using a special applicator a to swab saliva, and stored at approximately 4°C until used. The genotypes of these dogs were determined by direct DNA sequence analysis by a commercial company b using the primer pair DS-F and DS-R shown in Table 1, demonstrating 6 mutant homozygous (–/–) Collies (5 rough and 1 smooth), 3 heterozygous carrier (+/–) Collies (2 rough and 1 smooth), and 4 normal homozygous (+/+) Beagles.
Characteristics of primers and TaqMan probes used in the present study.*
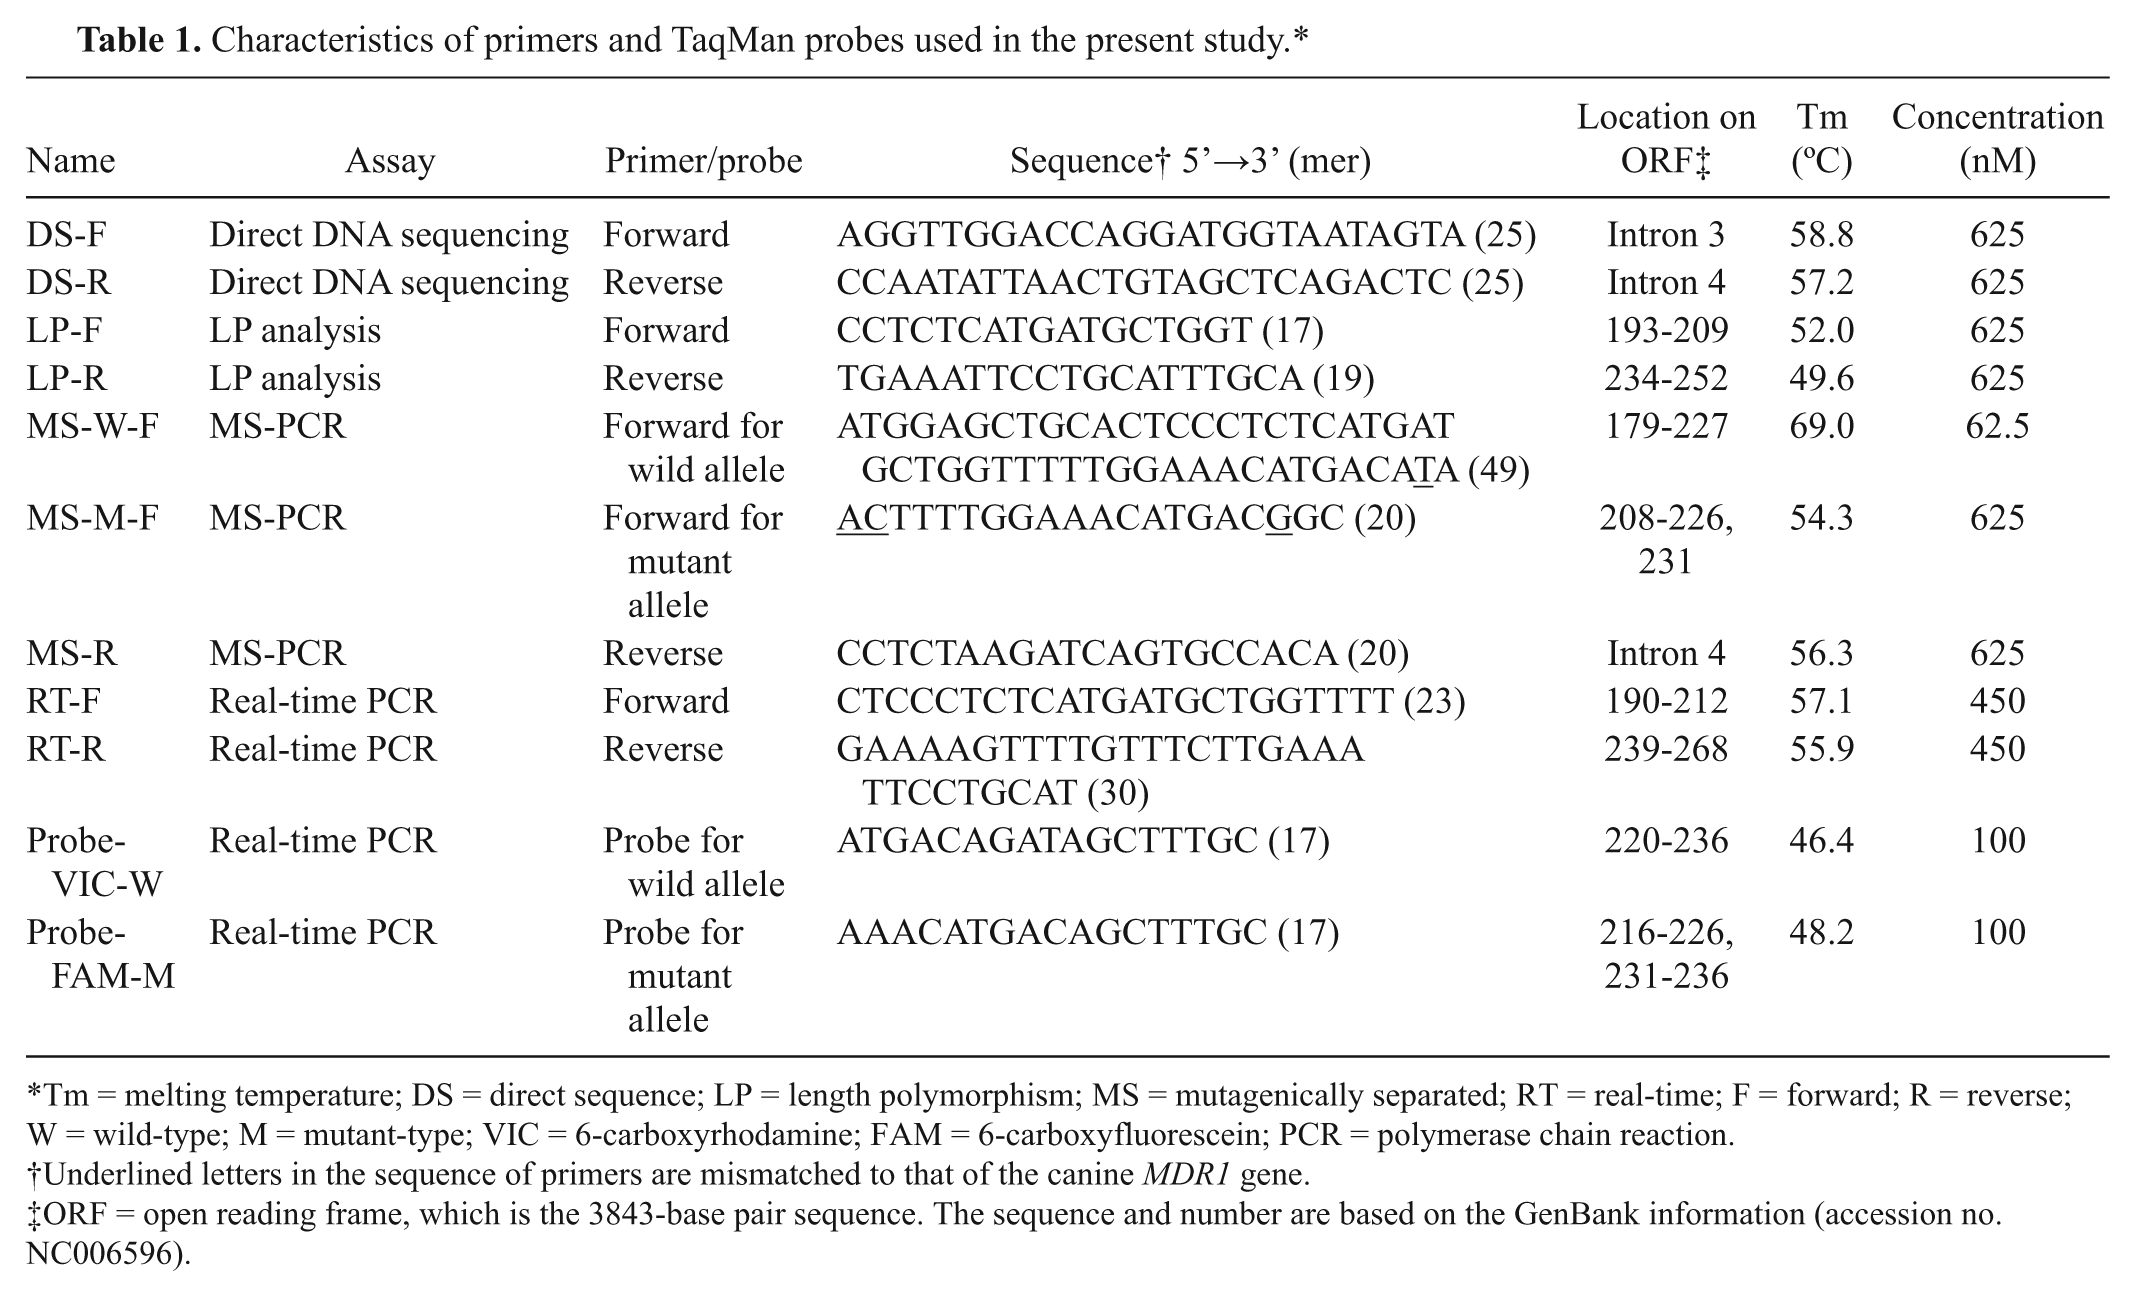
Tm = melting temperature; DS = direct sequence; LP = length polymorphism; MS = mutagenically separated; RT = real-time; F = forward; R = reverse; W = wild-type; M = mutant-type; VIC = 6-carboxyrhodamine; FAM = 6-carboxyfluorescein; PCR = polymerase chain reaction.
Underlined letters in the sequence of primers are mismatched to that of the canine MDR1 gene.
ORF = open reading frame, which is the 3843-base pair sequence. The sequence and number are based on the GenBank information (accession no. NC006596).
For a DNA template of each PCR such as direct DNA sequence, LP analysis, and MS-PCR assay, a 1.2-mm in diameter disc punched from the FTA card using a hole punch a was used. The disc was placed into a separate 0.2-ml tube for PCR. The disc on the tube bottom was washed 3 times for 5 min with 100 µl of washing solution, a rinsed twice for 5 min with 200 µl of Tris–ethylenediamine tetra-acetic acid buffer (pH 8.0), c and dried at 60°C for 10 min. The treated disc was used directly as a template for these PCR procedures, except real-time PCR.
LP analysis method
The LP analysis was carried out with forward (LP-F) and reverse (LP-R) primers reported previously 15 in a 20-µl reaction mixture containing 10 µl of 2× PCR master mix, d 12.5 pmol of primers, and the treated disc of FTA card as a template. After the first denaturation at 94°C for 2 min, 40 cycles of amplification were carried out, at a denaturing temperature of 94°C for 1 min, an annealing temperature of 56.2°C for 1 min, and an extension temperature of 72°C for 1 min. Extension during the last cycle was carried out for 2 min.
Mutagenically separated PCR method
The MS-PCR is a method utilizing sequence-specific hybridization by 2 primers with widely different sizes in 1 PCR tube without a restriction endonuclease digestion process. 29 In the present study, the MS-PCR assay was designed based on the general rules of MS-PCR, 29 and the ratio of short to long allele-specific forward primers (MS-W-F and MS-M-F) was increased to 10:l on a molar basis (Table 1) in order to produce bands of similar intensity in the heterozygous carrier when visualized on electrophoresis. The MS-PCR assay was conducted using these 2 allele-specific forward primers and a reverse primer (MS-R) simultaneously in a 20-µl reaction mixture containing 10 µl of 2× PCR master mix, d 1.25 pmol of the MS-W-F primer, 12.5 pmol of MS-M-F and MS-R primers, and the treated disc of FTA card as a template. After the first denaturation at 95°C for 5 min, 40 cycles of amplification were carried out, at a denaturing temperature of 95°C for 30 sec, an annealing temperature of 56°C for 45 sec, and an extension temperature of 72°C for 45 sec. Extension during the last cycle was carried out at 72°C for 3 min 45 sec.
Electrophoresis
The products of LP analysis and MS-PCR assay were subjected to electrophoresis on 5% and 3% (wt/vol) agarose gel, e respectively. The product of LP analysis was also subjected to electrophoresis on 20% (wt/vol) polyacrylamide gel. f Molecular size markers g were used in both electrophoreses. The electrophoresed agarose gel was stained with ethidium bromide and irradiated by an ultraviolet transilluminator. The polyacrylamide gel was stained with a silver staining kit. f Analysis of PCR products was also performed using a microchip electrophoresis system h with a special reagent kit h that included internal DNA size markers and DNA separation buffer. A fluorescent dye f was added to the DNA separation buffer according to the manufacturer’s protocol for the microchip electrophoresis system. DNA ladder markers f from 25 to 450 bp were used as references for DNA sizing.
Real-time PCR method
For a DNA template of real-time PCR, a 1.2-mm in diameter disc was punched from the aforementioned FTA cards using a hole punch, a placed into a separate 0.2-ml tube, lysed in the tube with 8 µl of lysis solution from a special DNA extraction kit, i and subsequently incubated at 95°C for 3 min. Then, 8 µl of DNA stabilizing solution from the kit i was added to the tube. This DNA-containing solution was transferred to a new tube and stored at −25°C until analysis. Amplifications were performed on a real-time PCR system i using a specific primer pair (RT-F and RT-R) and TaqMan minor groove binder (MGB) probes bound with each fluorescent reporter dye (6-carboxyrhodamine or 6-carboxyfluorescein) at the 5’-end and a nonfluorescent quencher dye at the 3’-end (Table 1), which were synthesized by a commercial company. i The real-time PCR amplifications were carried out in a final volume of 10 µl consisting of a master mix (2×), i a genotyping assay mix (80×) i including specific primers and TaqMan MGB probes, nuclease-free water, and 2 µl of the DNA-containing solution as a DNA template. The holding stage before PCR was performed at 25°C for 30 sec. The cycling conditions were 20 sec at 95°C followed by 50 cycles of 3 sec at 95°C and 20 sec at 60°C. The holding stage after PCR was performed at 25°C for 30 sec. In addition, an allelic discrimination plot was constructed based on the 3 types of amplification plots. Those data were calculated using software i based on the results obtained using DNA samples from the 13 dogs described above (i.e., 4 MDR1 (+/+), 3 MDR1 (+/–), and 6 MDR1 (–/–) dogs).
Genotyping survey
The genotyping survey was carried out using DNA samples from saliva- or whole blood–spotted FTA cards of 407 Border Collies in Japan. These samples were randomly collected with the owners’ informed consent for scientific evaluation of their dogs’ DNA. Sample collection was performed between 2006 and the present by the Japan Border Collie Health Network (JBCHN), a volunteer breeders association for the healthy breeding of Border Collies. Genotyping was carried out using the real-time PCR assay. Direct DNA sequence analysis was carried out to confirm the sequence of MDR1 (+/–) dogs that were identified by this genotype survey. Furthermore, the genetic relationships of these carrier dogs and their related dogs were analyzed using the pedigree papers issued in the Japan Kennel Club and the Kennel Club of Japan.
Results
Length polymorphism analysis
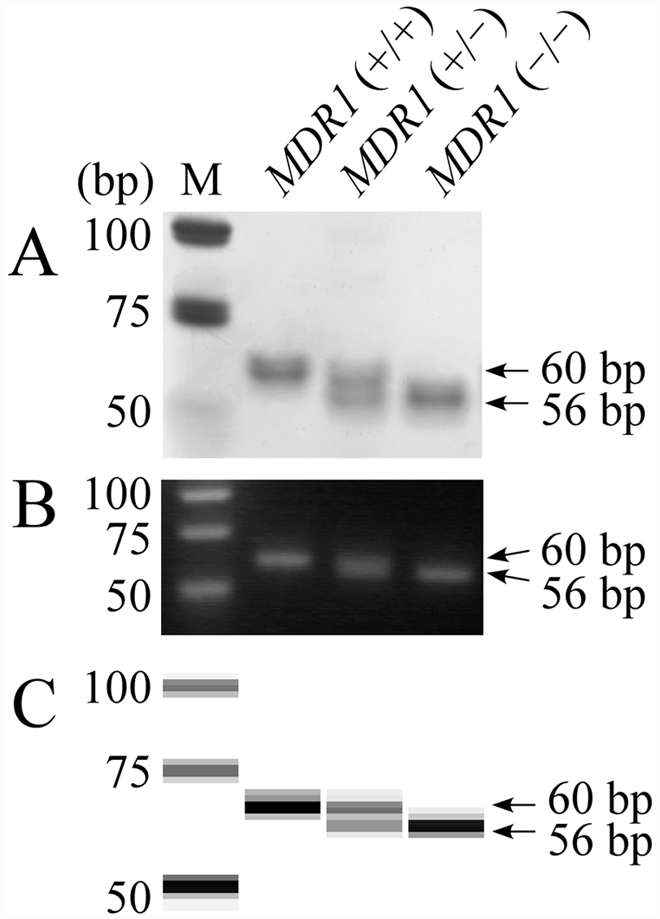
On LP analysis, a 60-bp band from the wild-type allele and a 56-bp band from the mutant allele are expected to be amplified and electrophoresed at different sites on the gels reflecting different band sizes. As shown in Figure 1, the 4-bp difference was recognized on PAGE (Fig. 1A), but indistinct on agarose gel, showing 1 broad band on MDR1 (+/–) genotype (Fig. 1B). On microchip electrophoresis, 2 amplification products were clearly separated in the gel image (Fig. 1C), allowing easy discrimination of the 3 genotypes.
Electrophoretogram of polyacrylamide gel (
Mutagenically separated PCR assay
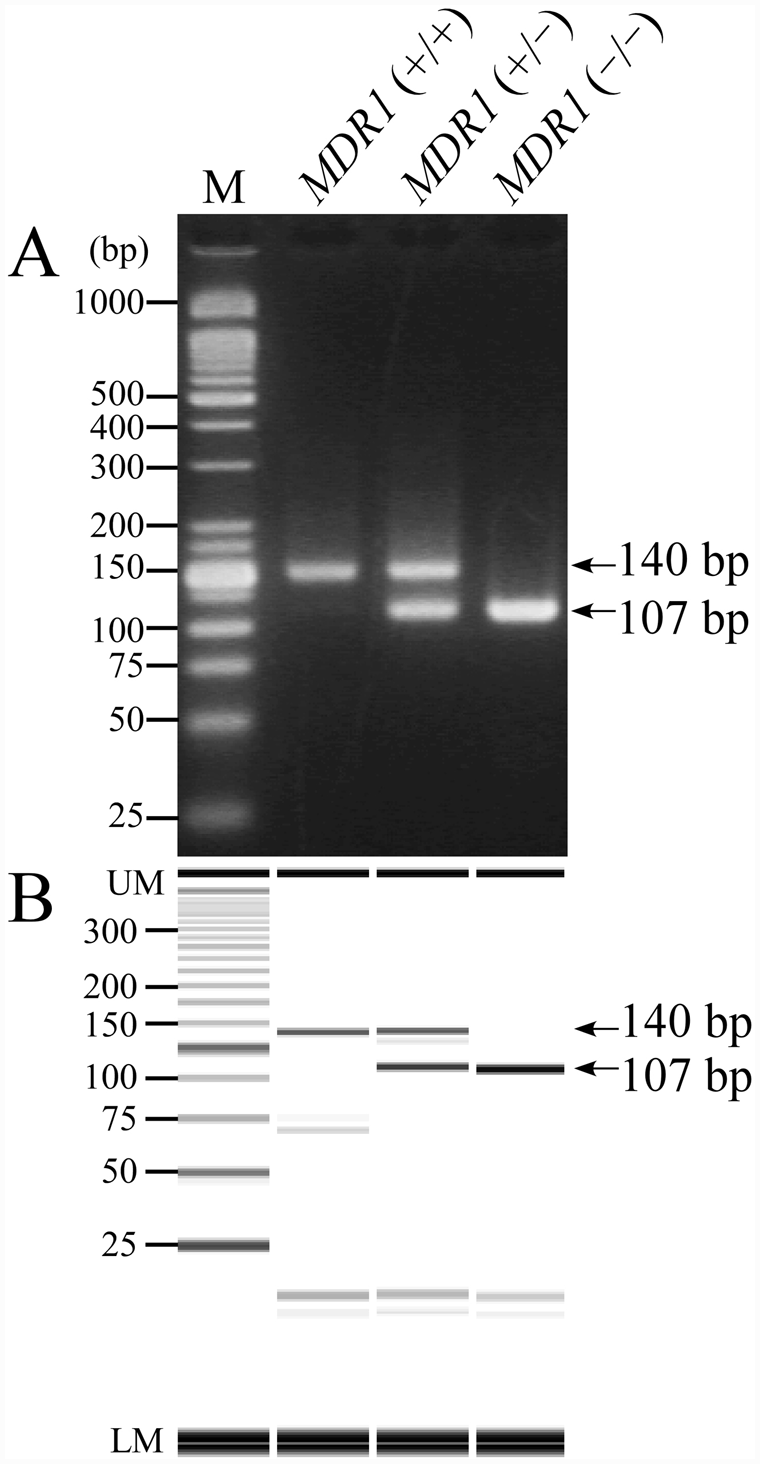
As expected, on MS-PCR assay, a 140-bp band including a longer MS-W-F primer was amplified from a wild-type allele, and a 107-bp fragment including a short MS-M-F primer was amplified from a mutant allele (Fig. 2). In the carrier dog with MDR1 (+/–) genotype, these 2 bands of similar intensity were clearly seen on both agarose gel and microchip electrophoreses.
Electrophoretogram of agarose gel (
Real-time PCR assay
Amplification of wild-type allele tended to be slightly higher than that of mutant allele (Fig. 3). A slight, nonspecific amplification, like wild-type allele, was observed in the MDR1 (–/–) genotype, but the amplification did not interfere with the genotype discrimination. Consequently, the real-time PCR assay with TaqMan MGB probes clearly determined all genotypes of the MDR1 gene defect. The total required time for 50-cycle amplification was approximately 40 min. Fifty cycles of amplification were sufficient for clear genotyping. In addition, an allelic discrimination plot was constructed based on the 3 genotypes of amplification plots obtained using DNA samples from 13 dogs including 4 MDR1 (+/+), 3 MDR1 (+/–), and 6 MDR1 (–/–) genotypes (Fig. 4). Three genotypes of the 13 dogs were clearly determined by this allelic discrimination plot, and the results were completely consistent with those of the direct DNA sequencing and other PCR-based assays developed in the present study.
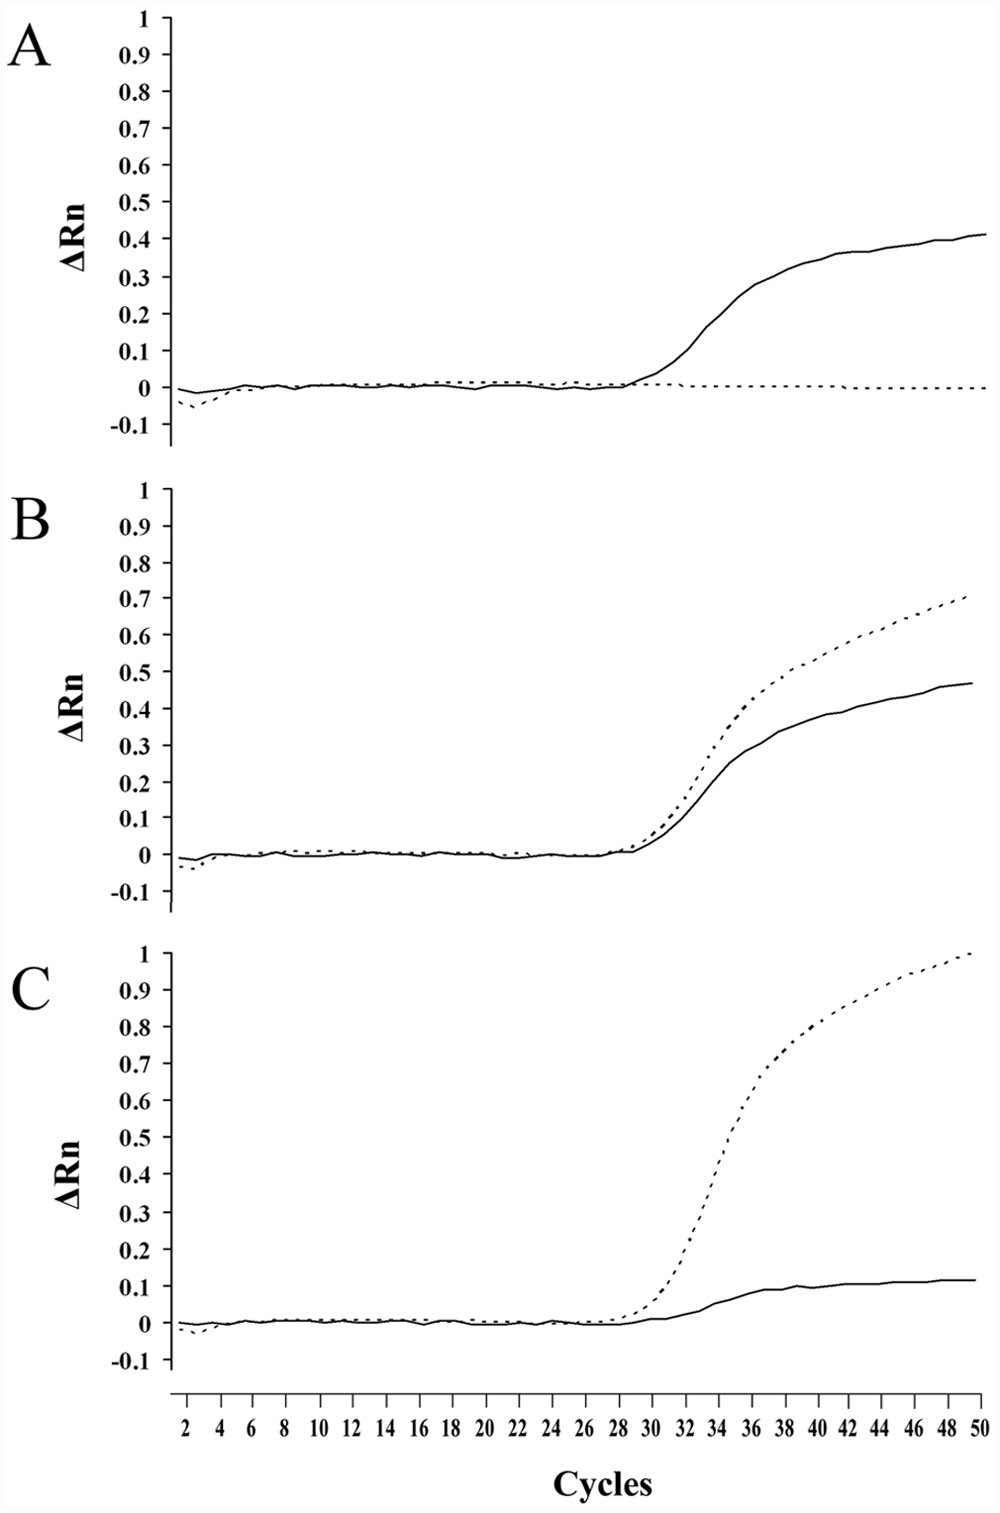
Real-time polymerase chain reaction amplification plots of wild-type and mutant alleles in the canine MDR1 gene defect. Amplification was plotted as fluorescence intensity (ΔRn value) against cycle number. The ΔRn value is the reporter dye signal normalized to internal reference dye and corrected for the baseline signal established in the first few cycles of reaction. Each of 3 amplification plots showed the 3 genotypes: MDR1 (+/+;
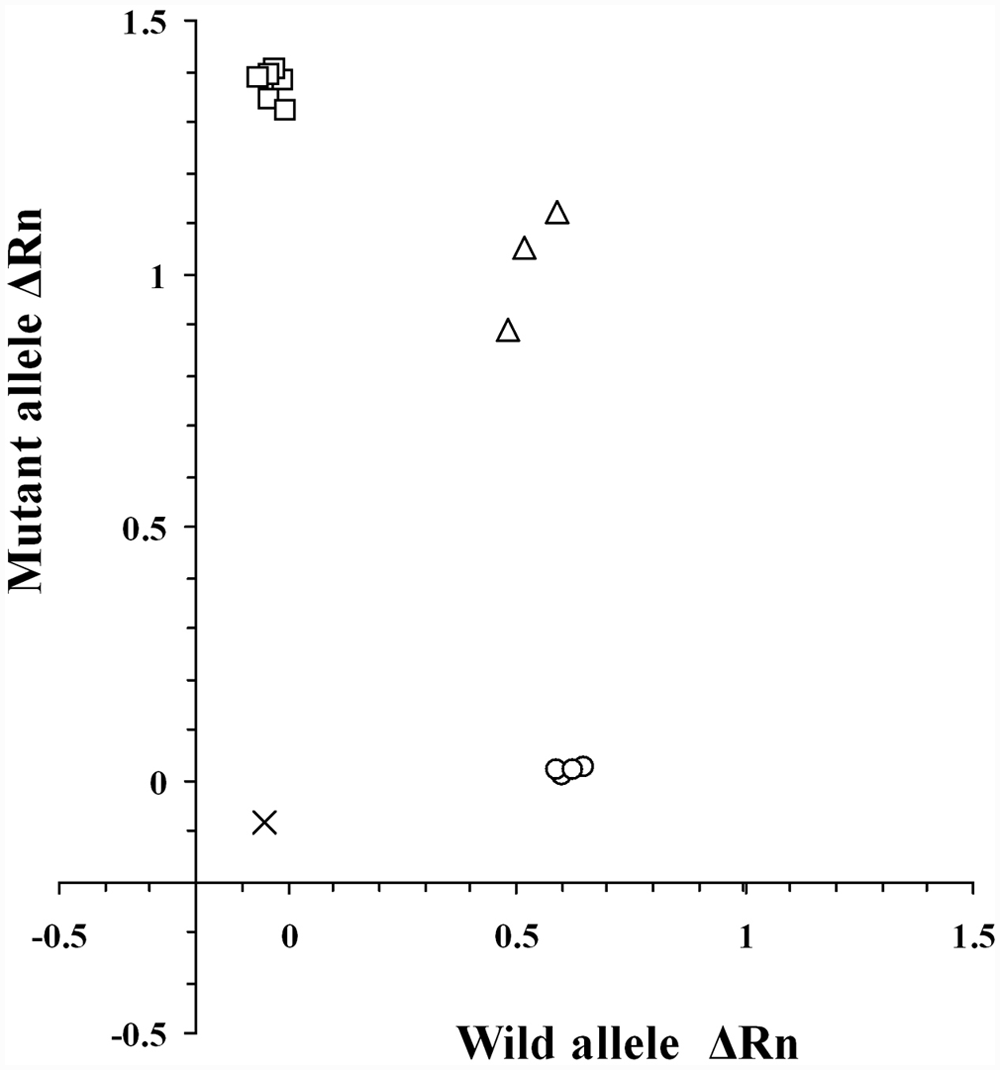
Allelic discrimination plot of end point fluorescence real-time polymerase chain reaction data showing the 3 genotypes of the canine MDR1 gene defect. Allelic discrimination plot was depicted using representative 13 DNA samples that had already been genotyped by direct DNA sequencing. The plot is expressed as fluorescence intensities (ΔRn value) for each allele at the X- and Y-axes. The ΔRn value in this figure is the end point reporter dye signal normalized to internal reference dye and corrected for the baseline signal established in the first few cycles of reaction. x = no template control; ○ = MDR1 (+/+); Δ = MDR1 (+/–); □ = MDR1 (–/–) genotypes.
Allele frequency and pedigree analysis
In the genotyping survey carried out on 407 Border Collies, there were no MDR1 (–/–), 2 MDR1 (+/–), and 405 MDR1 (+/+) dogs, indicating that the carrier and mutant allele frequencies were 0.49% and 0.25%, respectively. Direct DNA sequencing analysis confirmed that the 2 MDR1 (+/–) dogs detected in the current survey were heterozygous carriers for the 4-bp deletion mutation. Pedigree analysis carried out using the pedigree papers of these carrier dogs and their related dogs demonstrated that these 2 carriers had a common sire (Fig. 5).
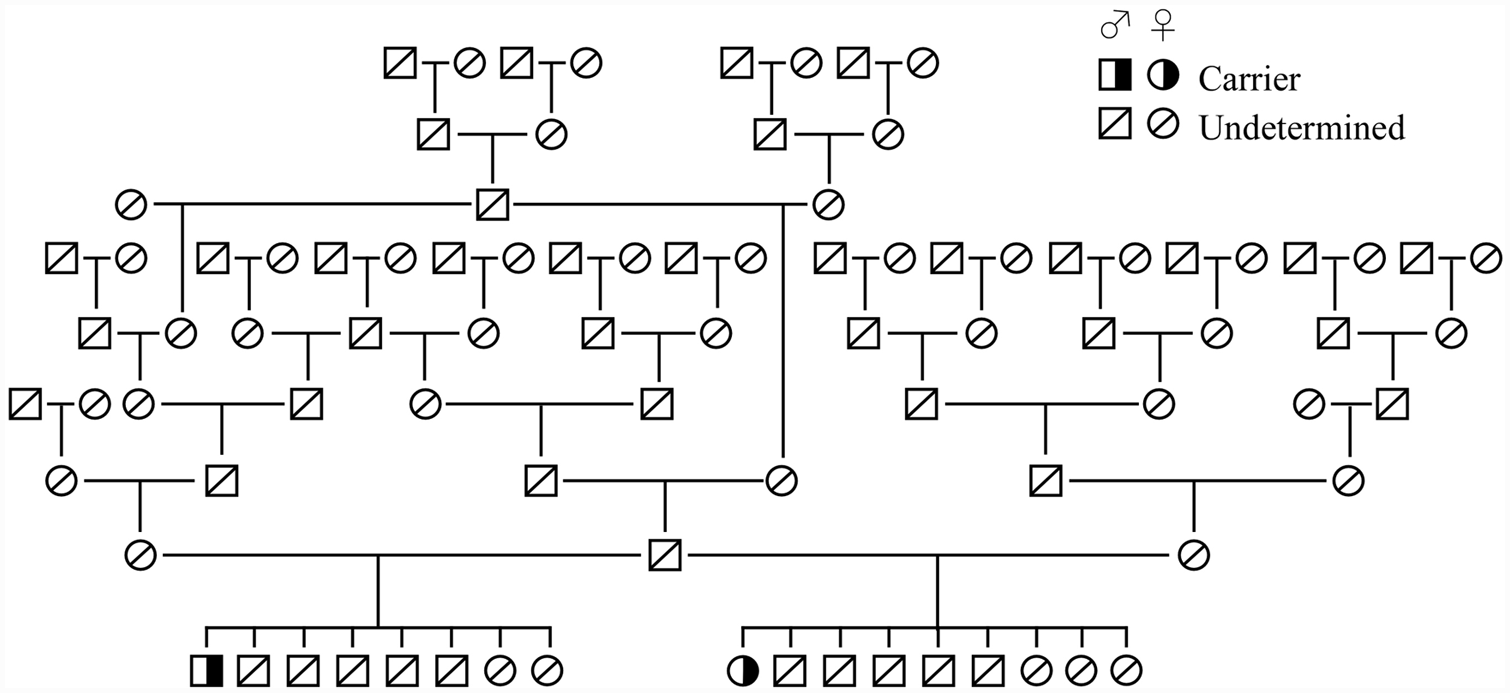
A genetic relationship of the 2 carrier dogs found in the genotyping survey using real-time polymerase chain reaction assay. Analysis of the 2 carriers and their related dogs was carried out using the pedigree papers issued by the Japan Kennel Club and the Kennel Club of Japan.
Discussion
Length polymorphism analysis is relatively simple because it does not require an endonuclease digestion step. However, a 4-bp difference lies on the dividing line in the separation using gel electrophoresis. In the present study, the 4-bp difference of the amplified bands was detected in the LP analysis using PAGE in combination with silver staining (Fig. 1A), but not detected in agarose gel electrophoresis in combination with ethidium bromide staining (Fig. 1B). Microchip electrophoresis separated most clearly and rapidly these 2 bands resulting in the clear discrimination of the 3 genotypes (Fig. 1C). Microchip electrophoresis has recently attracted considerable attention in DNA and RNA analysis due to its high efficiency, high throughput, timesaving ability, easy operation, and low consumption of samples and reagents.4,27,35 The use of microchip electrophoresis can markedly shorten the time for analysis of DNA fragment patterns, which is currently approximately 3 min per sample. Furthermore, gel electrophoresis requires hazardous substances (acrylamide) or mutagenic (ethidium bromide) and toxic (silver nitrate) stains as well as longer analytical time, whereas the use of toxic substances and expenses incurred for hazardous waste disposal can be avoided using microchip electrophoresis. Consequently, microchip electrophoresis had advantages in detection sensitivity, timesaving, and waste management over other electrophoresis methods.
Mutagenically separated PCR can be performed more simply and inexpensively than other LP analyses and real-time PCR assay because it needs only a thermal cycler and standard electrophoresis equipment using agarose gel. 29 There is a non–LP-type PCR test using allele-specific primers in combination with agarose gel electrophoresis, 1 but that process needs a 2-step PCR using 2 tubes and 2 lanes for judgment in the gel electrophoresis, whereas MS-PCR can be performed in 1 tube and 1 lane, as shown in Figure 2. MS-PCR was originally developed to be used for analysis of point mutations, 29 and was utilized for a single nucleotide substitution in several diseases or polymorphisms.27,32 In the present study, however, MS-PCR was applied for detection of a 4-bp deletion mutation with a modification in the design of primers shown in Table 1. The molecular difference of amplified bands was enlarged by the length of the allele-specific primers, resulting in a lower concentration of agarose gel and the use of only 1 lane of electrophoresis for a genotype determination, compared to the LP analysis and 2-step PCR, respectively.
Recently, rapid real-time quantitative PCR approaches have been developed to detect mutations in genes causing hereditary diseases in human beings14,34 and animals.3,4 In the canine MDR1 gene defect, a real-time PCR assay using TaqMan MGB probes was reported previously. 16 In the present study, the sequence of probes and the hybridization site of the reverse primer were changed significantly compared with the previous method. As a result, it was thought that these modifications made the genotyping discrimination markedly clear, as shown in Figures 3 and 4, compared to that in the previous report. 16 Furthermore, real-time PCR assay, in combination with FTA cards for sampling, markedly shortens the time required for genotyping and simplifies the procedure3,4 because FTA cards reduce the steps required for DNA collection, transportation, purification, and storage, consequently reducing the cost and time required to process a DNA sample to the final step of purified DNA ready for downstream application. 21 Therefore, among the assays developed and modified in the present study, the real-time PCR assay in combination with FTA cards for sampling was the most suitable for a large-scale survey due to its high throughput and rapidity.
The genotyping survey demonstrated that the carrier and mutant allele frequencies were 0.49% and 0.25%, respectively, in the population of Border Collies in Japan. The pedigree analysis demonstrated that the 2 carriers found in the present survey had a common sire (Fig. 5), suggesting that the mutant allele is limited to a minority of kennels for Border Collies in Japan. There are some similar reports of large-scale surveys of the mutant allele in more than 100 Border Collies in the United States24,25 and Germany.11,12 Two different surveys carried out in the United States demonstrated 0.99% 24 and 0% 25 mutant allele frequencies, respectively. In Germany, 0.60% 11 and 0.85% 12 frequencies were reported in 2 different surveys. These data together with the result of the present survey suggest that the mutant-allele frequency in Border Collies is markedly low compared to that in MDR1 gene defect–susceptible breeds such as Collie (51–59%), Australian Shepherd (17–29%), and Shetland Sheepdog (6.6–30%).11,12,24,25
Although the 4-bp deletion mutation in the canine MDR1 gene was often responsible for the hypersensitivity for the substrate drugs of P-gp especially in Collies,20,22 it was reported that non-Collie dogs lacking this mutation were affected with subchronic neurotoxicity following administration ivermectin, milbemycin, and/or moxidectin for generalized demodicosis. 2 Recently, a novel insertion mutation of the canine MDR1 gene was identified in an ivermectin-sensitive Border Collie, although the correlation between the insertion mutation and the ivermectin-sensitive phenotype in this dog was not clarified completely. 13 In human beings, at least 3 single nucleotide polymorphisms were found in the human MDR1 gene, 17 which may be related to abnormal sensitivity to multiple drugs. Furthermore, except for P-gp, other drug-efflux transporters such as multidrug-resistance proteins or organic anion transporting polypeptides are expressed at the blood–brain barrier and these transporters function supportively to prevent entry of xenobiotics from free access to the central nervous system. 19 Based on these aspects together with the low mutant allele frequency in Border Collies, it is suggested that demonstration of only the 4-bp deletion mutation in the canine MDR1 gene cannot completely ensure security from adverse effects of the substrate drugs of P-gp especially in this dog breed.
Footnotes
Acknowledgements
The authors are grateful to all members of JBCHN for their help with collection of DNA samples of Border Collies and to all dog owners and breeders who consented to the use of their dogs’ DNA in this study.
Notes
The author(s) declared no potential conflicts of interest with respect to the research, authorship, and/or publication of this article.
This study was supported financially by grants (nos. 20380173, 20-08112, and 21658109, OY) from the Ministry of Education, Culture, Sports, Science and Technology of Japan.