
Abstract
Quantitative real-time polymerase chain reaction (PCR) has become an important tool for Porcine circovirus-2 (PCV-2) research and diagnosis. However, significant differences in detection limit and quantification data, among laboratories and quantitative real-time PCR methods, have been demonstrated. New efforts are required for providing more accurate and comparable results. The current study is an evaluation of the effects of DNA extraction procedures on PCV-2 quantification in lymph node samples. Differences, greater than 1 log10 copies/g, were shown among PCV-2 loads detected after different extraction procedures. The work highlighted the critical role of the DNA extraction method in PCV-2 quantification by quantitative real-time PCR. This important aspect should be evaluated when comparing data from different laboratories or different studies. The PCV-2 quantification data should not be considered comparable before demonstrating the equivalence of the DNA extraction methods performed.
Porcine circovirus-2 (PCV-2; family Circoviridae, genus Circovirus) is a nonenveloped virus, with a small circular single-stranded DNA genome (1.8 kb). PCV-2 has been described as the etiologic agent of postweaning multisystemic wasting syndrome (PMWS), which causes remarkable economic losses in swine industry worldwide. The presence of PCV-2 has also been associated with several disease syndromes in swine,23,25 collectively named porcine circovirus diseases (PCVD). Numerous studies have already demonstrated that PCV-2 loads in serum and/or plasma (Meehan BM, Gilpin DF, Krakowka S, et al.: 2001, In vivo quantification analyses of PCV2 DNAs: correlation of virus load measurements with disease reproduction. In: Proceedings of the European Society Veterinary Virology, PMWS, p. 101, St. Malo, France)4,17,19 and tissue specimens4,15,21,24 are significantly higher in PMWS-affected pigs than in healthy ones. Therefore, virus quantification has become an important tool for PCV-2 research and diagnosis.3,4,9,18,28 Several quantitative real-time polymerase chain reaction (qPCR) protocols for quantification of PCV-2 DNA in clinical specimens have been published.*
Procedures proposed in the literature differ in sample preparation, DNA extraction method, and primers and probes used. Many more discrepancies could probably be pointed out among protocols in use in diagnostic laboratories. Recent papers, reporting interlaboratory and interassay comparisons, have highlighted significant differences in PCV-2 genome detection limits and quantification data.13,14 New efforts are required to provide more accurate and comparable results. Many aspects of sample preparation and analysis can influence the final quantification data. DNA extraction and purification are unquestionably very critical steps; isolation efficiency, repeatability, purity, and removal of PCR inhibitors can undoubtedly affect qPCR performance and results. Different DNA purification methods are cited in publications reporting PCV-2 qPCR data. Most works employed commercial extraction kits based on silica affinity purification4,18-20,23,28 of DNA. Alternatively, extremely rapid extraction methods5,26 or magnetic separation have been described. 26 Because of PCV-2 genome structural features (single-strand circular DNA molecule of very small size), co-purification of PCV-2 DNA and total RNA by means of phenol–chloroform-based methods have been reported. 8 This extraction method, although infrequently cited, is diffuse and advantageous in diagnostic laboratory practices where samples have to be tested for multiple pathogens. A 2010 publication 26 briefly reports a comparison of threshold cycles obtained after extraction of PCV-2 DNA from swine lymph nodes by 2 different methods. However, there is no report to date comparing multiple extraction methods and their effect on qPCR for PCV2.
Lymph nodes are important specimens to take into consideration for PCV-2 research studies and postmortem diagnosis.4,10,12 The current work is an evaluation of PCV-2 qPCR data, obtained after application of different DNA extraction methods to lymph node specimens, in order to assess their comparability. In the first part of the study, 3 manual DNA extraction methods were evaluated: the DNeasy® tissue kit, a as representative of silica-based commercial DNA extraction kits; an in-house silica-based affinity protocol modified from Boom et al. 2 ; and DNAzol® reagent, b particularly interesting for its rapidity. Phenol–chloroform-based methods were omitted from the experimental design because inhibitors are not completely removed during extraction of lymph node tissue (data not shown). In the second part of the work, the manual method with the best performance was compared with the BioSprint 96 One-For-All Vet kit, c as representative of automated procedures employing magnetic beads separation. This latter method has the double advantage of rapidity and co-purification of DNA and RNA from the same specimen.
Lymph node samples, previously shown to be positive for PCV-2 by real-time PCR or immunohistochemistry investigation, were collected and frozen at −20°C. Approximately 1 g of lymph node specimen was homogenized mechanically in saline buffer in order to obtain a 20% w/v suspension. Lymph node homogenates were divided into aliquots of 100 µl, and processed in duplicate according to the different methods. For the DNeasy tissue kit, prior to incubation at 56°C for 2 hr, 20 µl of proteinase K (20 mg/ml) and 180 µl of lysis buffer were added to homogenate samples. DNA was eluted in 200 µl of elution buffer. For the DNA extraction modified from Boom et al., prior to incubation at 56°C for 2 hr, 20 µl of proteinase K d (20 mg/ml), 100 µl of saline buffer, and 1 ml of lysis buffer (5 M guanidinium thiocyanate, d 22 mM ethylenediamine tetra-acetic acid, d 50 mM Tris–HCl d [pH 6.7], 0.65% Triton-X100 d ) were added to homogenate samples. After lysis, 100 µl of silicon dioxide d suspension (20% w/v in 0.17 M HCl) was added to samples and incubated for 10 min at room temperature, keeping powder in suspension by shaking. Samples were centrifuged for 15 sec at 12,000 rcf, and the supernatant was discarded. Pellets were washed twice with 200 µl of washing solution (5 M guanidinium thiocyanate, 50 mM Tris–HCl [pH 6.7]), twice with 200 µl of ethanol d solution (70% v/v in water), and finally with 200 µl of acetone. Pellets were air dried by heating for 10 min at 56°C. DNA was eluted in 100 µl of water. For the DNAzol method, PCV-2 DNA was extracted from homogenate samples according to manufacturer’s instructions. The final ethanol-washed DNA pellets were air dried and then dissolved in 20 µl of water. For the One-For-All Vet kit, DNA was extracted from 50 µl of homogenate and 50 µl of saline buffer. The protocol, “Purification of viral nucleic acids from animal tissue homogenates,” was followed according to manufacturer’s instructions, using an automated magnetic particle processing instrument. e DNA was eluted in 100 µl of elution buffer. Lymph node specimens were processed in pairs using each method, and each extract obtained was then analyzed in duplicate. DNA was extracted contemporaneously from groups of 3 or 4 starting specimens. DNA extracts were then analyzed the same day or the day after, in a single qPCR run. DNA solutions were maintained at 4°C until analysis. No evaluation of total DNA yield was taken into consideration since it was considered an imperfect indicator of PCV-2 DNA yield. Also, DNA purity was not evaluated since many studies have already demonstrated that it is the presence of inhibitors, rather than the generic purity, that affects qPCR performance and results.6,7 Real-time PCR reactions were performed according to a previously published protocol. 19 An exogenous internal positive amplification control f was incorporated, according to manufacturer’s instructions, in order to reveal the presence of inhibitors. An exogenous control was preferred to an endogenous one as the latter could be influenced not only by inhibitors, but also by differences in porcine genomic DNA yields, not strictly corresponding to PCV-2 DNA yields. A recombinant plasmid g carrying a synthetic DNA sequence identical to that of the reference protocol 19 (PCV-2 open reading frame-2 GenBank accession no. AF465211) was used as standard. The manufacturer provided the plasmid lyophilized, in a specified quantity. A plasmid solution was prepared in house, and its concentration was confirmed by a fluorescence-based DNA quantification assay h and spectrophotometric analysis. A dilution curve was prepared in order to obtain a wide quantification range (108–100 plasmid copies/µl). Correlation coefficient (R2) was 0.98 and reaction efficiency was 103%. The assay was able to detect plasmid concentration as low as 100 plasmid copies/µl, corresponding to approximately 2 copies/reaction, but not the further 10-fold dilution. All lymph node DNA extracts (6 for each lymph node specimen) were analyzed in duplicate by qPCR i in a reaction volume of 25 µl. j A 6-point standard curve was included in duplicate at every run. All the samples showed genome loads inside the linear range of the qPCR assay. The titers obtained, expressed in copies/µl, were transformed in log10 copies per gram (copies/g) of starting specimen. For this computation, all dilution steps performed during extraction procedures were considered, together with the elution volumes applied. A mean PCV-2 load was calculated for each extract, taking into consideration the values obtained by the 2 qPCR replicates performed. For each lymph node specimen, an average viral load, relative to each extraction method, was obtained with the 2 replicates of the 2 extractions performed. The intra-assay coefficients of variation (CVs) of qPCR were calculated by dividing the standard deviation, relative to the log10 PCV-2 genome copies/g of the amplification duplicates, by their average. The intra-assay CVs of qPCR plus extraction method were calculated for each starting lymph node by dividing the standard deviation, relative to the log10 PCV-2 genome copies/g of the amplification replicates of both extractions executed, by their average. The interassay CVs of qPCR plus extraction method were calculated for each starting lymph node by dividing the standard deviation, relative to the log10 PCV-2 genome copies/g of the amplification duplicates of all extracts derived from all purification methods, by their average. All CVs were finally expressed as percentages (CV%).
To compare the quantitative results obtained after different extraction methods, linear regression was performed using a worksheet available specifically for statistical computation (http://faculty.vassar.edu/lowry/VassarStats.html). In order to assess the linear association between the PCV-2 viral loads detected after different extraction methods, 27 the Spearman correlation test was performed using a worksheet specifically for biological statistics (http://udel.edu/~mcdonald/statspearman.html). The Bland–Altman plot 1 was employed to evaluate the agreement between qPCR data obtained after different extraction procedures.
For the evaluation of manual DNA extraction procedures, 20 lymph node specimens were prepared, processed, and analyzed as described above. None of the internal amplification control curves revealed inhibitory effects, showing that all methods produced DNA samples suitable for further real-time PCR amplification. Seventeen of the 20 starting lymph node specimens were confirmed positive in both qPCR replicates of both extracts obtained through each method. PCV-2 genome was detected in all qPCR replicates of all extracts prepared by the Boom modified method. DNeasy led to negative results in 2 qPCR replicates relative to a low viral load sample (<4.5 log10 copies/g). DNAzol was the extraction method with the higher number of negative qPCR replicates. Some of the negative replicates, corresponding to a specimen with a high mean viral load (>8 log10 copies/g), were probably due to an operator error. A lack of extraction efficiency was the presumable cause of negative results obtained in some qPCR replicates related to 2 low mean viral load lymph nodes (<4.5 log10 copies/g).
The mean intra-assay CV% of qPCR was 1.8%. Mean PCV-2 loads relative to each starting lymph node and each extraction method are summarized in Table 1, together with the corresponding intra-assay CV percentage values of qPCR plus extraction method. The mean values of this coefficient were good: 2.9% for DNeasy, 3% for Boom modified, and 3.9% for DNAzol. Interassay CV percentage values were calculated by grouping together data relative to all methods, in order to estimate the variability of PCV-2 genome loads when considered independently from the extraction procedure applied (Table 2). The mean interassay CV% of qPCR plus extraction methods was high at 11.33%. Restricting the mean interassay CV% to Boom modified and DNeasy kit (silica-based affinity methods), its value decreased to 5.6%. This simple interassay CV% analysis indicated that PCV-2 genome loads, estimated by qPCR, were influenced by the extraction method applied to sample preparation.
Mean Porcine circovirus-2 loads obtained after different manual extraction methods and corresponding coefficient of variation percentage (CV%) values.*
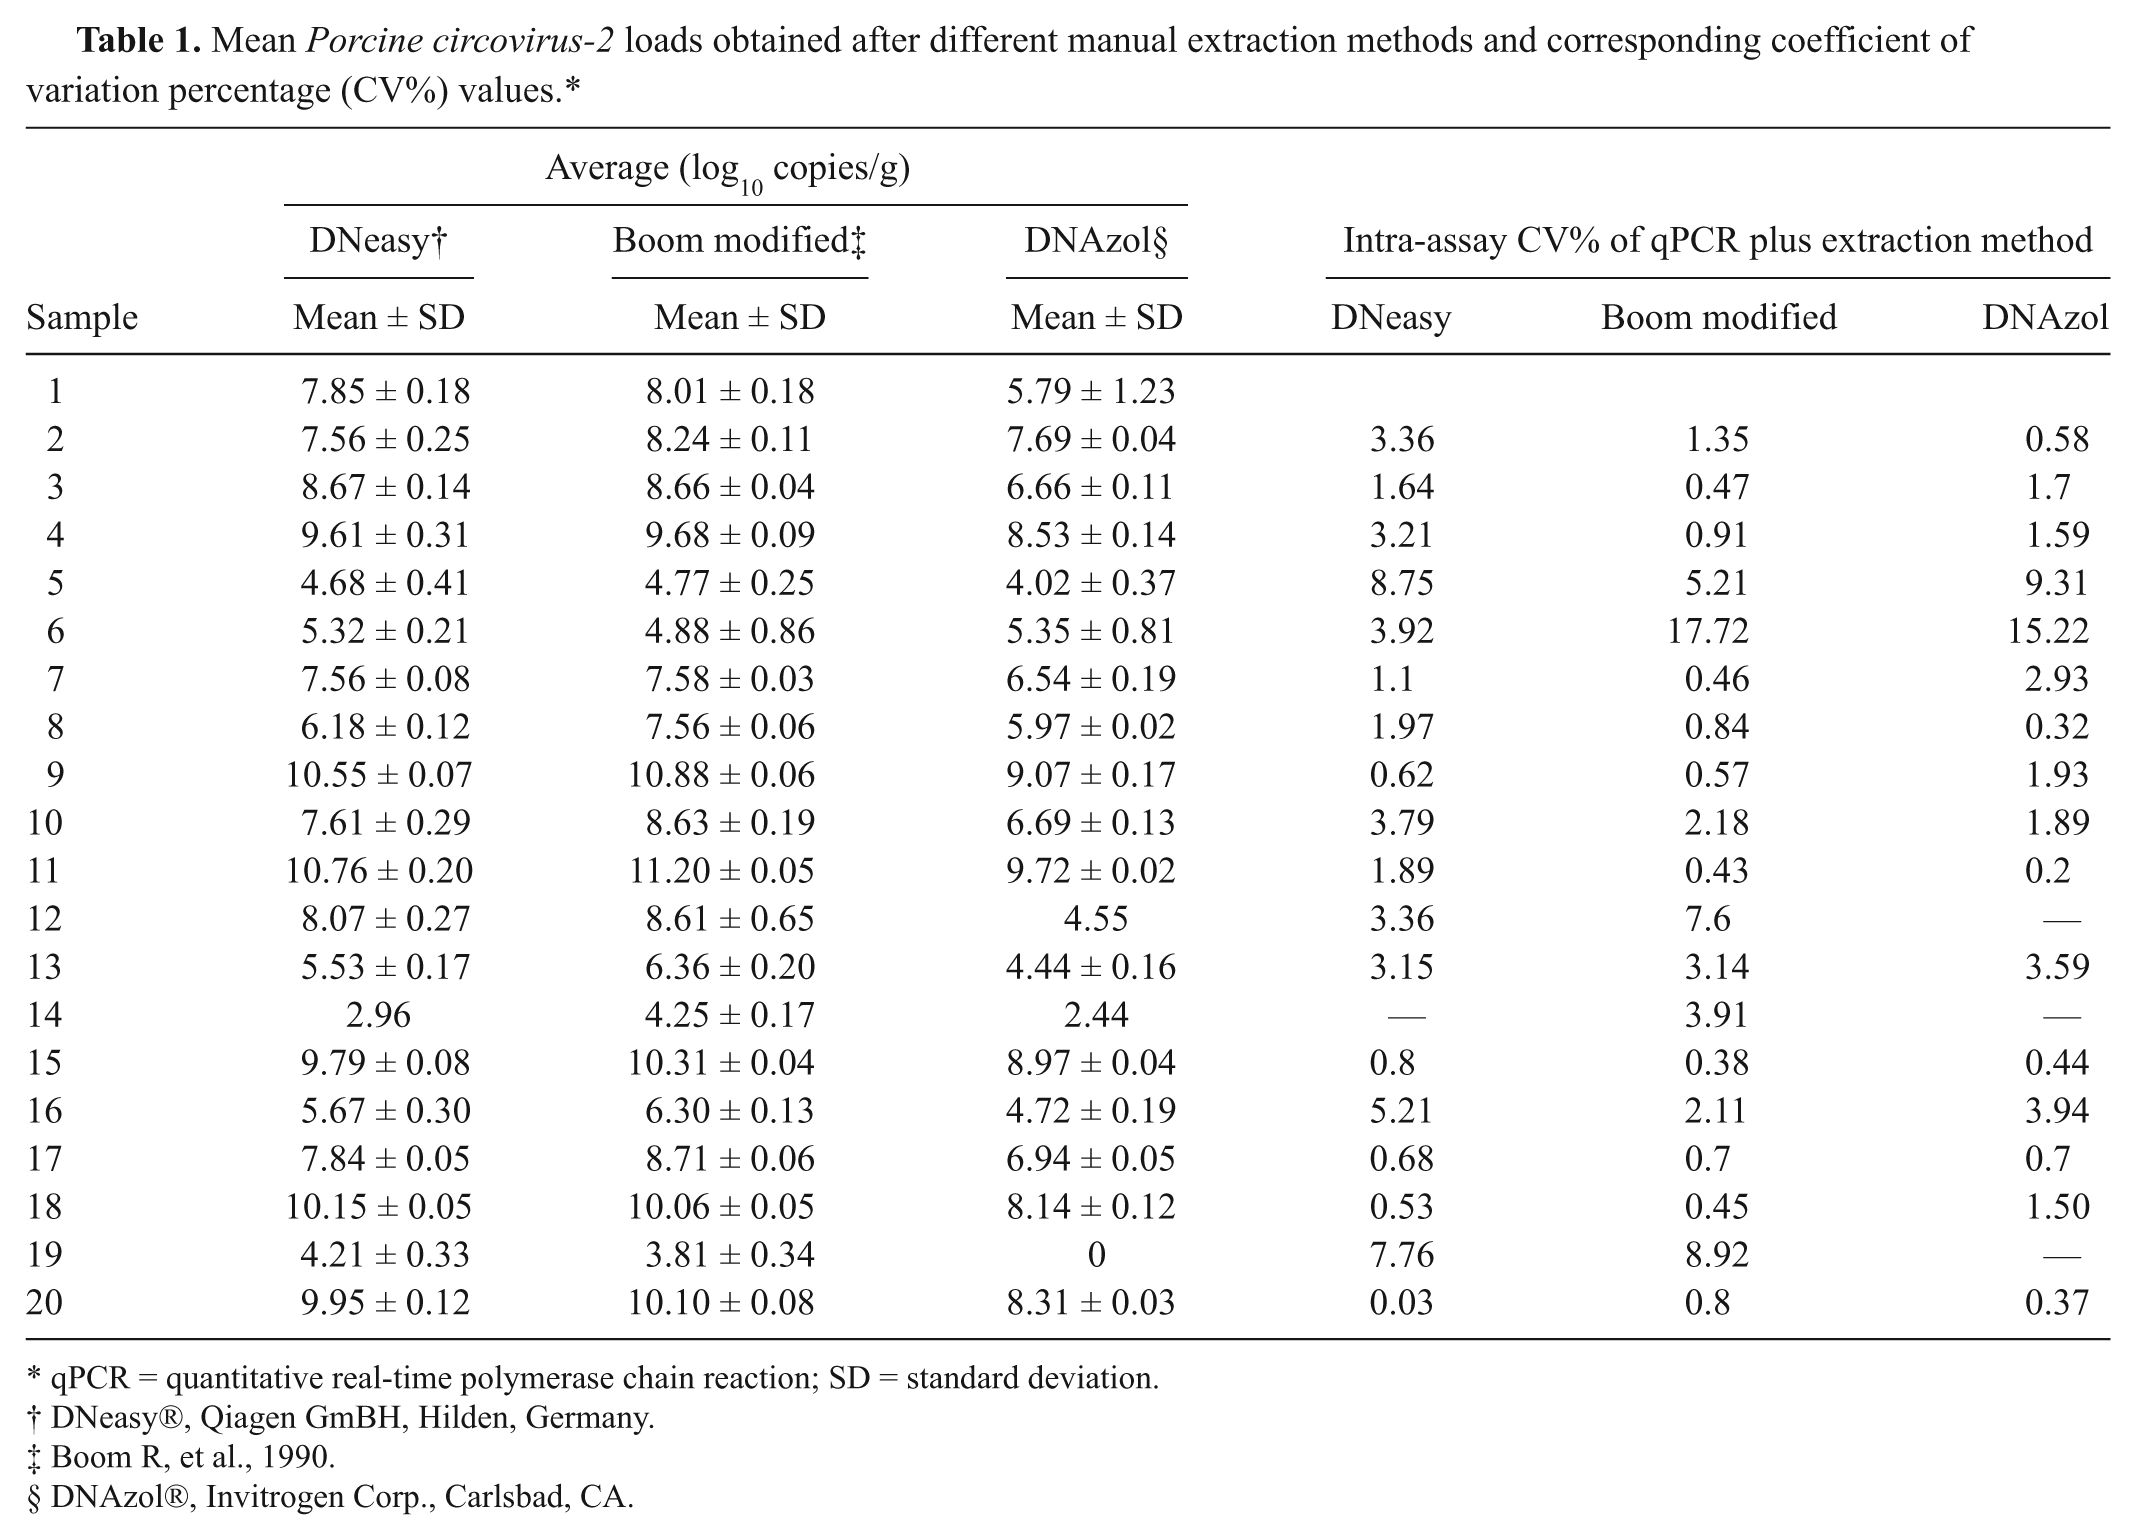
qPCR = quantitative real-time polymerase chain reaction; SD = standard deviation.
DNeasy®, Qiagen GmBH, Hilden, Germany.
Boom R, et al., 1990.
DNAzol®, Invitrogen Corp., Carlsbad, CA.
Mean Porcine circovirus-2 loads and corresponding coefficient of variation percentage (CV%) values obtained by grouping together data relative to different manual extraction methods.*
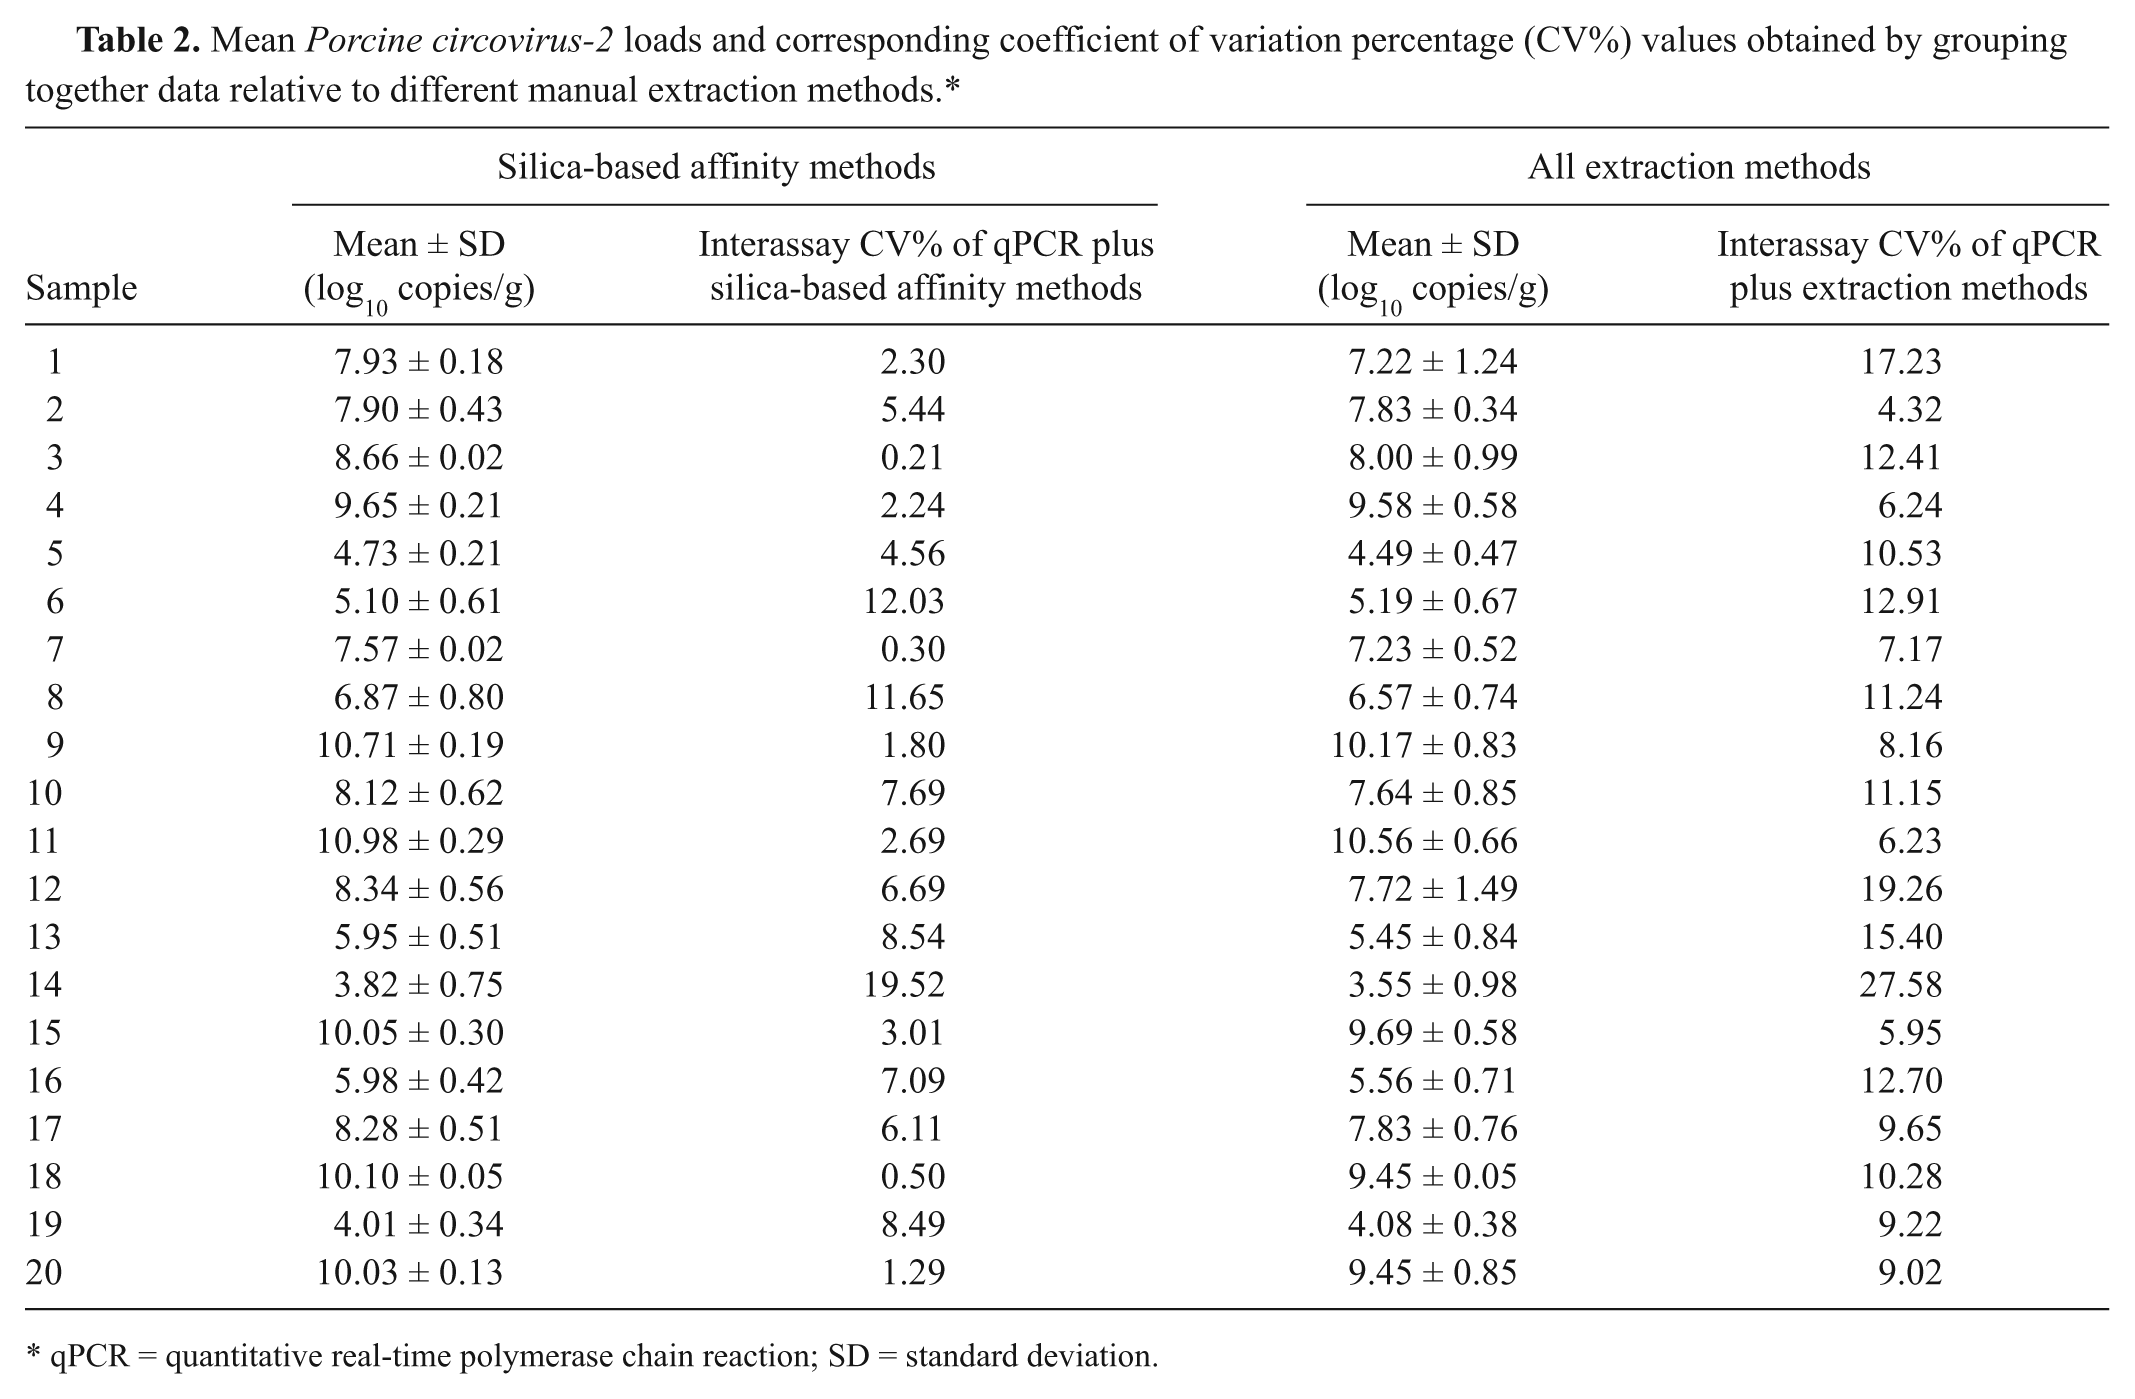
qPCR = quantitative real-time polymerase chain reaction; SD = standard deviation.
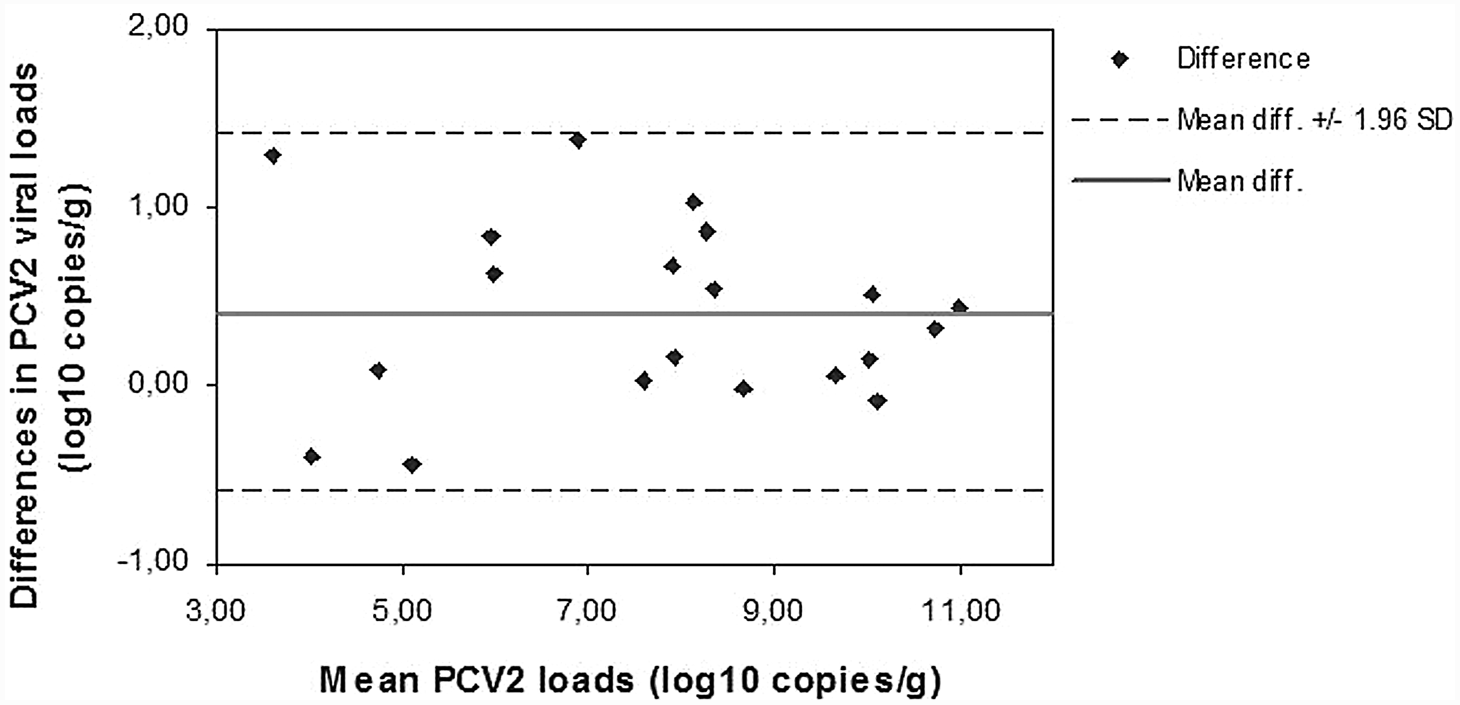
Linear regression analysis showed a significant linear association between quantitative data obtained after the 3 extraction methods. The regression coefficients were as follows: R2 = 0.949 for DNeasy plotted against Boom modified (P < 0.0001), R2 = 0.806 for Boom modified plotted against DNAzol (P < 0.0001), R2 = 0.837 for DNeasy plotted against DNAzol (P < 0.0001), and R2 = 0.844 for affinity-based methods plotted against DNAzol (P < 0.0001; Fig. 1). Similar results were found when data were analyzed with the Spearman rank correlation test. Since good correlation does not imply an equally good agreement between methods, an evaluation of the differences, between data obtained after diverse extraction procedures, was performed by the Bland–Altman representation. Mean PCV-2 loads obtained after the affinity extraction methods were similar; the average difference between Boom modified and DNeasy was 0.4 log10 copies/g (Fig. 2). The 2 assays gave equivalent quantification for 11 out of 20 (55%) samples (<0.5 log10 copies/g difference). All of the 9 paired results, differing by more than 0.5 log10 genome copies/g, presented higher virus load values for the Boom modified method. In contrast, a Bland–Altman plot highlighted that PCV-2 loads obtained after DNAzol extraction were lower than those revealed after both affinity extraction methods; the average difference between Boom modified and DNAzol was 1.7 log10 copies/g and the average difference between DNeasy and DNAzol was 1.3 log10 copies/g. The Bland–Altman plot consistently showed that when considering together the 2 affinity extraction methods the mean PCV-2 loads obtained were higher (1.52 log10 copies/g difference) than those detected after DNAzol extraction (Fig. 3).
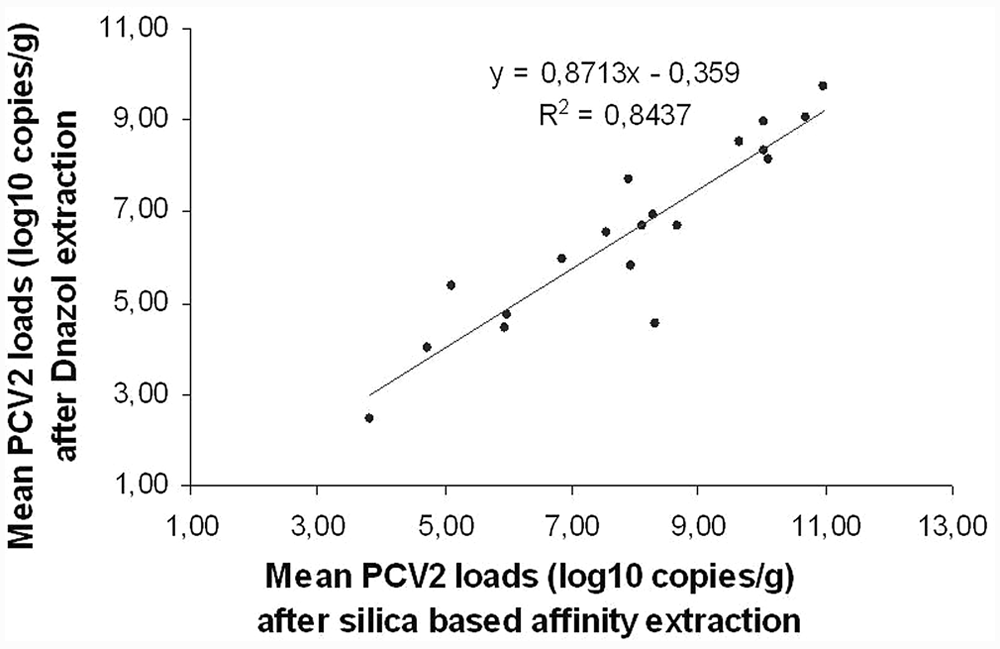
Linear regression analysis of mean Porcine circovirus-2 (PCV-2) DNA loads after extraction by DNAzol® b and silica-based affinity methods (R2 = 0.844; P < 0.0001).
Bland–Altman plot of mean Porcine circovirus-2 (PCV-2) DNA loads after extraction by Boom modified method and DNeasy® kit. a Mean difference: 0.4 log10 copies/g.
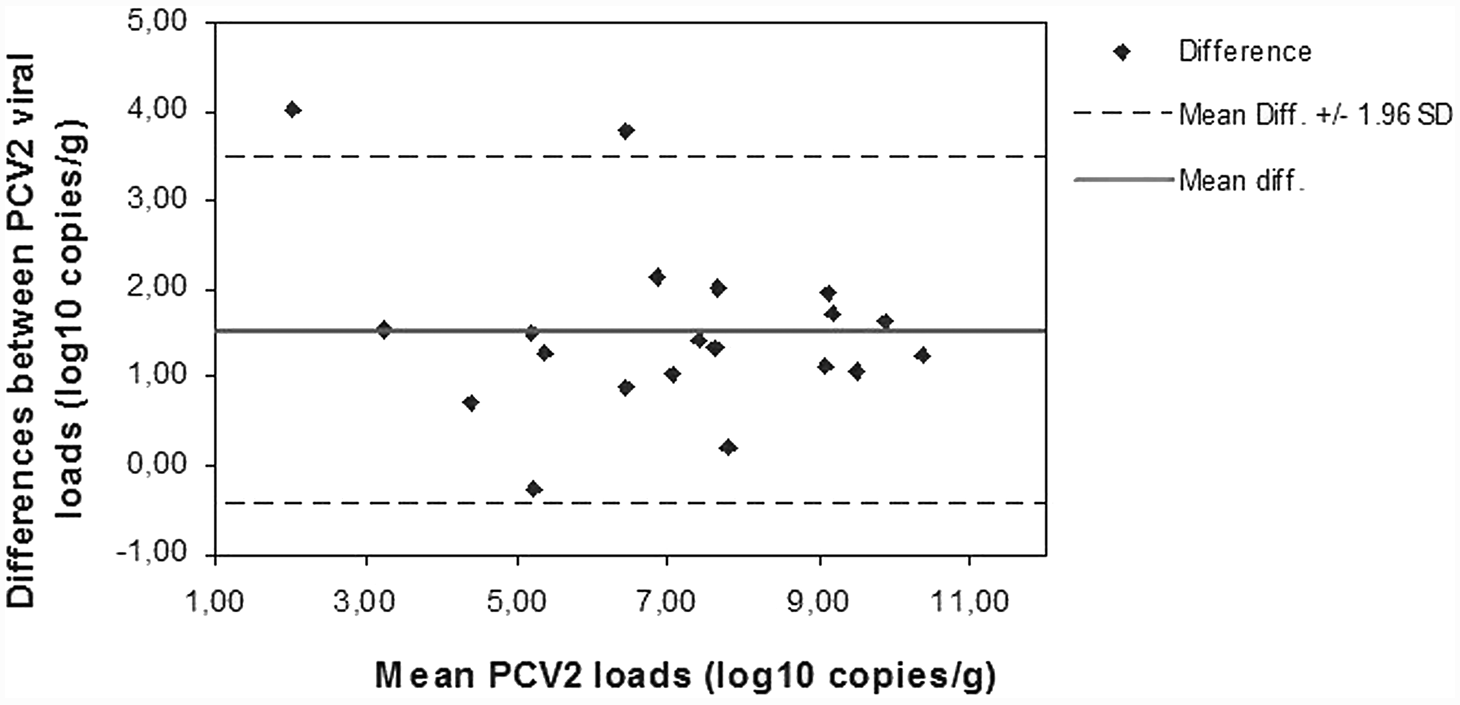
Bland–Altman plot of mean Porcine circovirus-2 (PCV-2) DNA load after extraction by silica-based affinity methods and DNAzol®. b Mean difference: 1.52 log10 copies/g.
The manual extraction method with best performance, the Boom modified protocol, was then compared with a silica-based automated magnetic separation procedure, the One-For-All Vet kit. Homogenates of 20 PCV-2–positive lymph node specimens were prepared, processed, and analyzed according to the protocols described above. None of the internal amplification control curves showed inhibitory effects, and all the lymph node specimens were confirmed positive in all qPCR replicates of all extracts. Mean PCV-2 loads, relative to each starting lymph node and each extraction method, are summarized in Table 3, together with the corresponding CV percentage values. The mean intra-assay CV% of qPCR was 0.7%. Also, the mean intra-assay CV% of qPCR plus extraction method were good: 2.4% for Boom modified and 1.7% for the magnetic kit. The mean interassay CV% of qPCR plus extraction methods was 2.9%, indicating a low data variability. Linear regression analysis showed a significant linear association between quantitative data (R2 = 0.994; P < 0.0001). Similar results were found through the Spearman rank correlation test (Spearman rho = 0.989; P < 0.0001). The Bland–Altman representation showed that mean PCV-2 loads, obtained after the Boom modified method and One-For-All Vet kit, were similar: the average difference was 0.25 log10 copies/g (Fig. 4). The 2 assays gave equivalent quantification for all samples (<0.5 log10 copies/g difference).
Mean Porcine circovirus-2 loads and corresponding coefficient of variation percentage (CV%) values relative to Boom modified and One-For-All Vet kit comparison.*
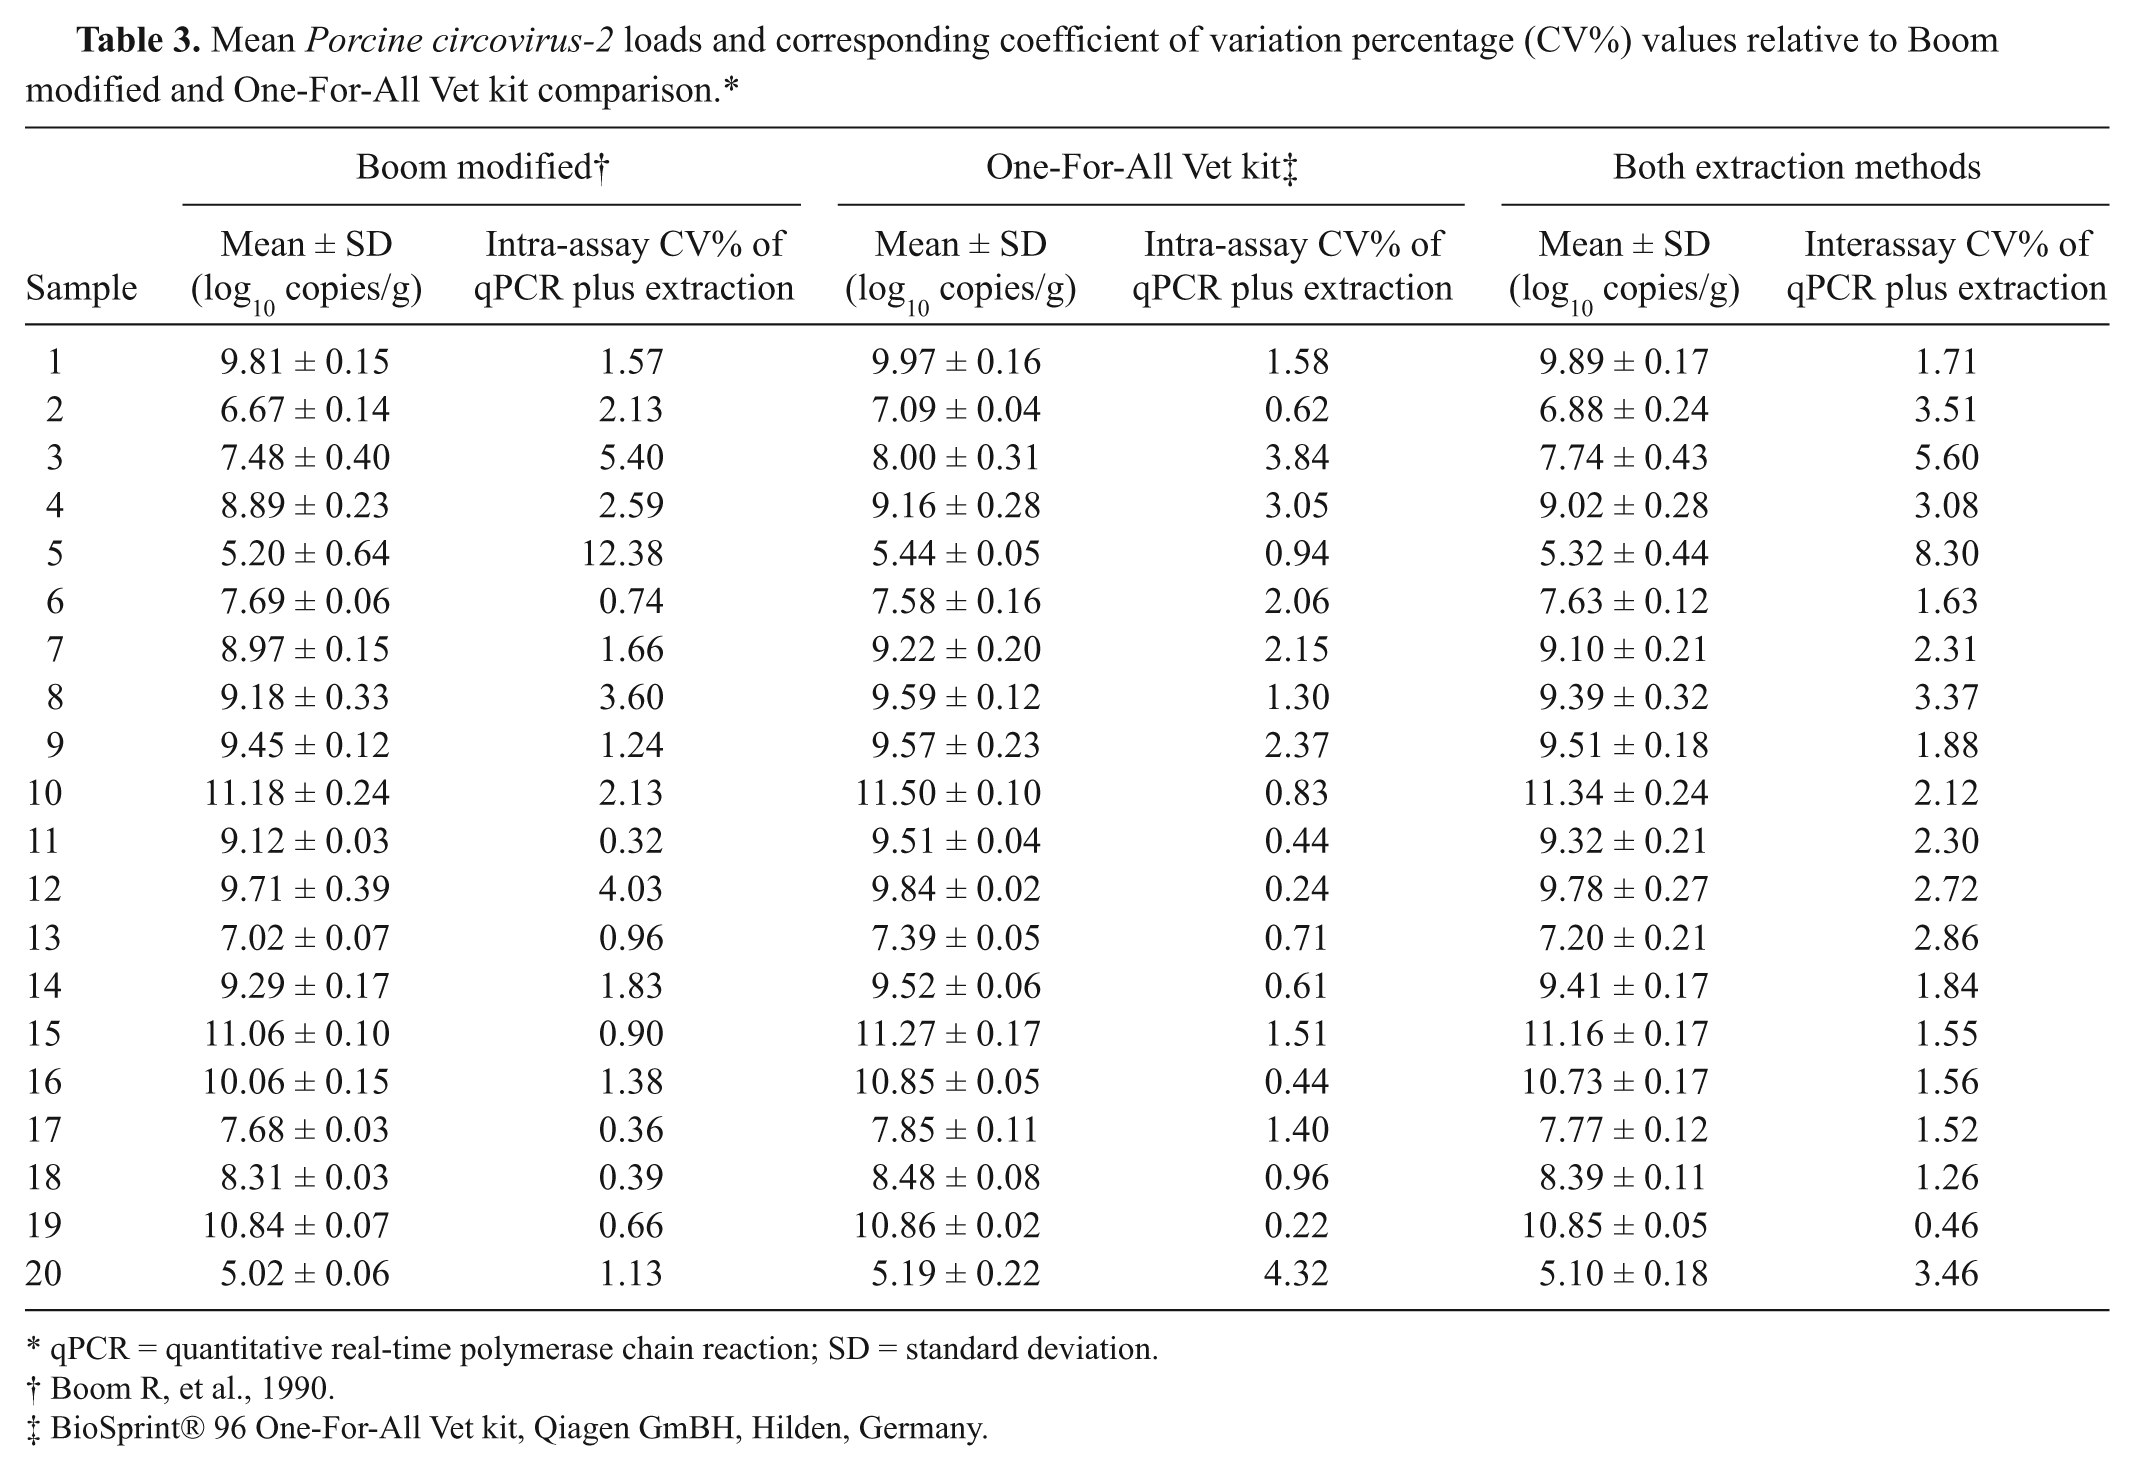
qPCR = quantitative real-time polymerase chain reaction; SD = standard deviation.
Boom R, et al., 1990.
BioSprint® 96 One-For-All Vet kit, Qiagen GmBH, Hilden, Germany.
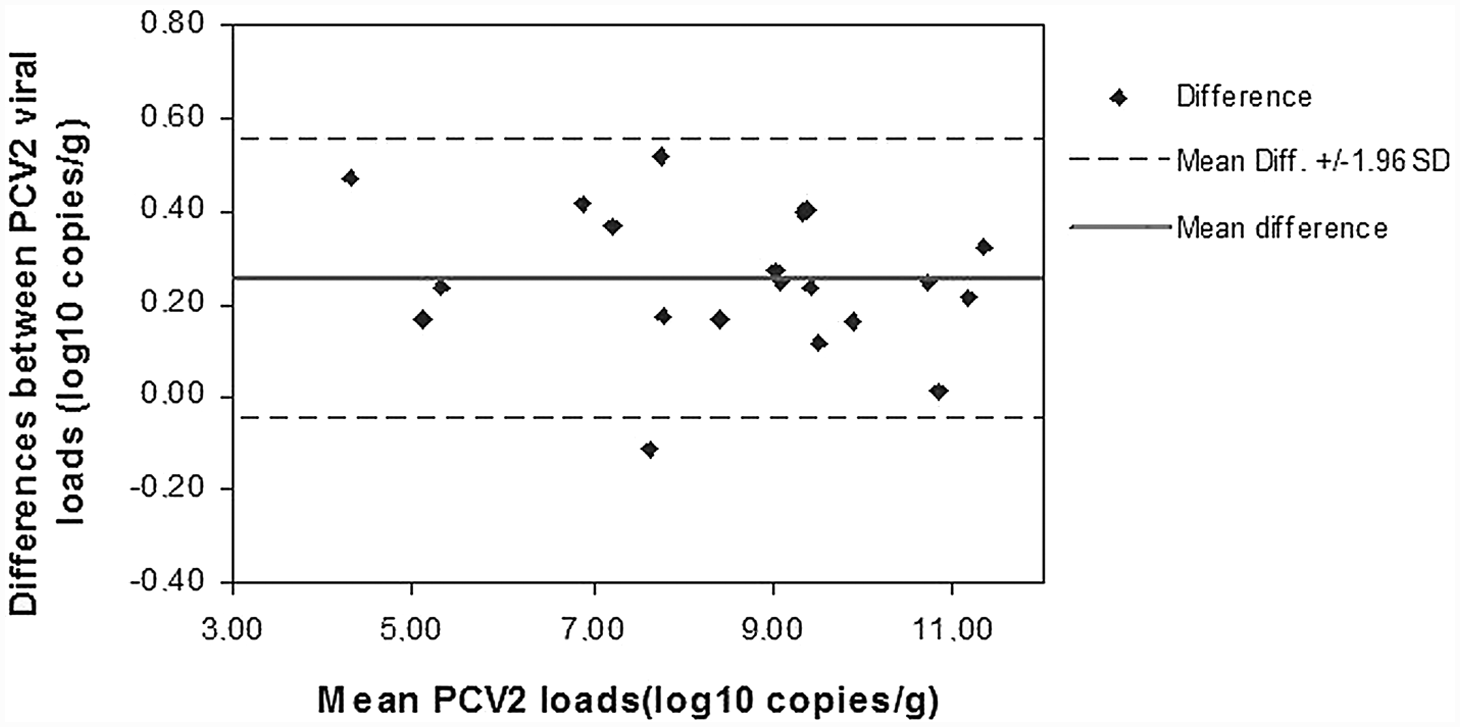
Bland–Altman plot of mean Porcine circovirus-2 (PCV-2) DNA loads after extraction by Boom modified method2 and BioSprint® 96 One-For-All Vet kit. c Mean difference: 0.25 log10 copies/g.
Silica-based affinity DNA extraction methods proved to be the most suitable for preparation of lymph node samples for PCV-2 qPCR analysis in the current study. The Boom modified procedure gave very good results: PCV-2 loads on average were slightly higher, but still comparable with those obtained after the DNeasy commercial kit extraction. The DNAzol extraction method was very rapid, but was inadequate for obtaining qPCR data comparable with those detected after application of silica-based affinity methods. The One-For-All Vet kit, combining silica affinity and magnetic separation technology, led to viral load quantifications slightly higher, but substantially equivalent to those obtained after the Boom modified method. The high rapidity of the procedure, and the possibility of purifying DNA and RNA simultaneously from the same specimen, make this magnetic separation method particularly interesting for diagnostic applications.
The current study demonstrated that the DNA extraction method significantly affects PCV-2 quantification in lymph node samples by qPCR. This is an important aspect to be evaluated when comparing data from different laboratories or different studies. The PCV-2 quantification data, even though obtained through the application of the same qPCR protocol, should not be considered comparable before demonstrating the equivalence of the DNA extraction methods performed.
Footnotes
Acknowledgements
The authors thank Donà Giulia and Sarzi Simonetta for their technical support, and Rossella Luppi Aquila for proofreading the manuscript.
Notes
The author(s) declared no potential conflicts of interest with respect to the research, authorship, and/or publication of this article.
This work was funded by the project IZSLER PRC2008015 by the Italian Ministry of Health.