
Abstract
Q fever is an important zoonotic disease caused by infection with the bacterium Coxiella burnetii. Veterinary diagnostic laboratories, including the Veterinary Laboratories Agency (VLA) in England and Wales, have traditionally relied on the complement fixation test (CFT) for serological diagnosis. However, Q fever has assumed greater significance in recent years following several large human outbreaks linked to exposure to infected ruminants and it is essential that more reliable tests are introduced to detect the presence of C. burnetii infection in animals. The objective of the current study was to evaluate the performance of 3 commercially available enzyme-linked immunosorbent assays (ELISAs) for detection of antibodies to C. burnetii and to compare the findings with the CFT using a sample panel of 548 sera from sheep, goats, and cattle, including animals of known disease status. The statistical analysis using TAGS (test accuracy in the absence of a gold standard) software and receiver operating characteristic techniques demonstrated that the 3 ELISAs all showed improved sensitivity over the CFT. The test based on ovine antigen demonstrated the best overall performance and therefore, the VLA has adopted this test for routine use.
Introduction
Q fever is an important zoonosis with a worldwide distribution. The etiological agent, Coxiella burnetii, is a Gram-negative, obligate, intracellular bacterium classified within the order Legionellales. 2 Coxiella burnetii occurs in 2 antigenic forms: the pathogenic phase I, found in infected animals or human beings, and the avirulent phase II, obtained by repeated passages in embryonated eggs or in cell cultures. Additionally, C. burnetii may occur as a small-cell variant or large-cell variant. The small-cell variant undergoes sporogenic differentiation to produce resistant spore-like forms and can survive for long periods in the environment.
Coxiella burnetii is an Advisory Committee on Dangerous Pathogens (http://www.dh.gov.uk/ab/ACDP/index.htm) category-3 pathogen. Infection in animals is mainly subclinical, but sporadic abortions and occasionally large outbreaks are diagnosed in sheep, cattle, and goats. Infected animals shed large numbers of organisms at parturition, which presents a major zoonotic hazard for occupationally exposed groups, particularly since in its spore-like form C. burnetii is very resistant to disinfection and desiccation.
In human beings, Q fever is often asymptomatic or causes only mild flu-like illness, but some cases develop chronic infection with potentially serious sequelae; pregnant women and people with pre-existing valvular heart disease are at particular risk. 6 In addition to occupational exposure, human beings can become infected (rarely) from tick bites or by consuming unpasteurized milk. 1 Large human outbreaks such as those in Cheltenham, England 20 and The Netherlands 6 are attributed to windborne aerosol infection from livestock farm premises, especially by contaminated dust, bedding, and biological secretions associated with parturition.
There has been increased interest in Q fever worldwide following a large outbreak in The Netherlands, in which there have been more than 3,300 human cases since the start of the epidemic in mid-2007, with 2,236 of these being diagnosed in 2009.11,17 This outbreak has encouraged many countries to reassess their surveillance and diagnostic methods for Q fever.7,12
In veterinary laboratories, including the VLA, the veterinary diagnosis of Q fever usually relies mainly on modified Ziehl–Neelsen (MZN)-stained smears of placental material from aborted fetuses, supplemented by immunohistochemistry (IHC) where appropriate, although polymerase chain reaction (PCR) is increasingly being used for disease confirmation. 9 Serology, usually the complement fixation test (CFT), is used to examine for evidence of exposure in groups of animals including aborted dams. The CFT has inherent problems, particularly anti-complementary (AC) activity in a significant proportion of samples, which makes it difficult to obtain meaningful results. 18 An AC reaction comprises breakdown of complement by a variety of factors including immunoglobulins and enzymes such as trypsin 3 or bacterial contamination of the sample for analysis. 4 This reaction results in an inhibition of cell lysis in the CFT indicator system. The sensitivity and specificity of the CFT has also recently been questioned by the European Food Safety Authority (EFSA), who have recommended a standardized approach to diagnosis and case definitions for Q fever within the European Union through the adoption of ELISA and PCR technology. 7
The current study presents the findings from testing a panel of 548 samples from cattle, sheep, and goats for the presence of antibodies to C. burnetii using the CFT and 3 commercially available ELISAs. Results were evaluated statistically to select the ELISA that gave the best overall test performance.
Materials and methods
Sample panel
Serum samples used in the present study (n = 548) originated from sheep, goats, and cattle taken from suspected clinical cases of Q fever submitted by private veterinary surgeons to VLA regional laboratories for diagnosis, and sera from herds and flocks of known disease status based on MZN, IHC, or PCR (Table 1). Apart from the freeze-dried ELISA standards supplied by the French Food Safety Agency (AFSSA) and Laboratoire Service International (Lissieu, France) that were stored at 4°C, all sera were stored at −20°C for up to 1 year prior to the study.
Serum sample panel tested by serology, polymerase chain reaction, or immunohistochemistry for Coxiella burnetii.
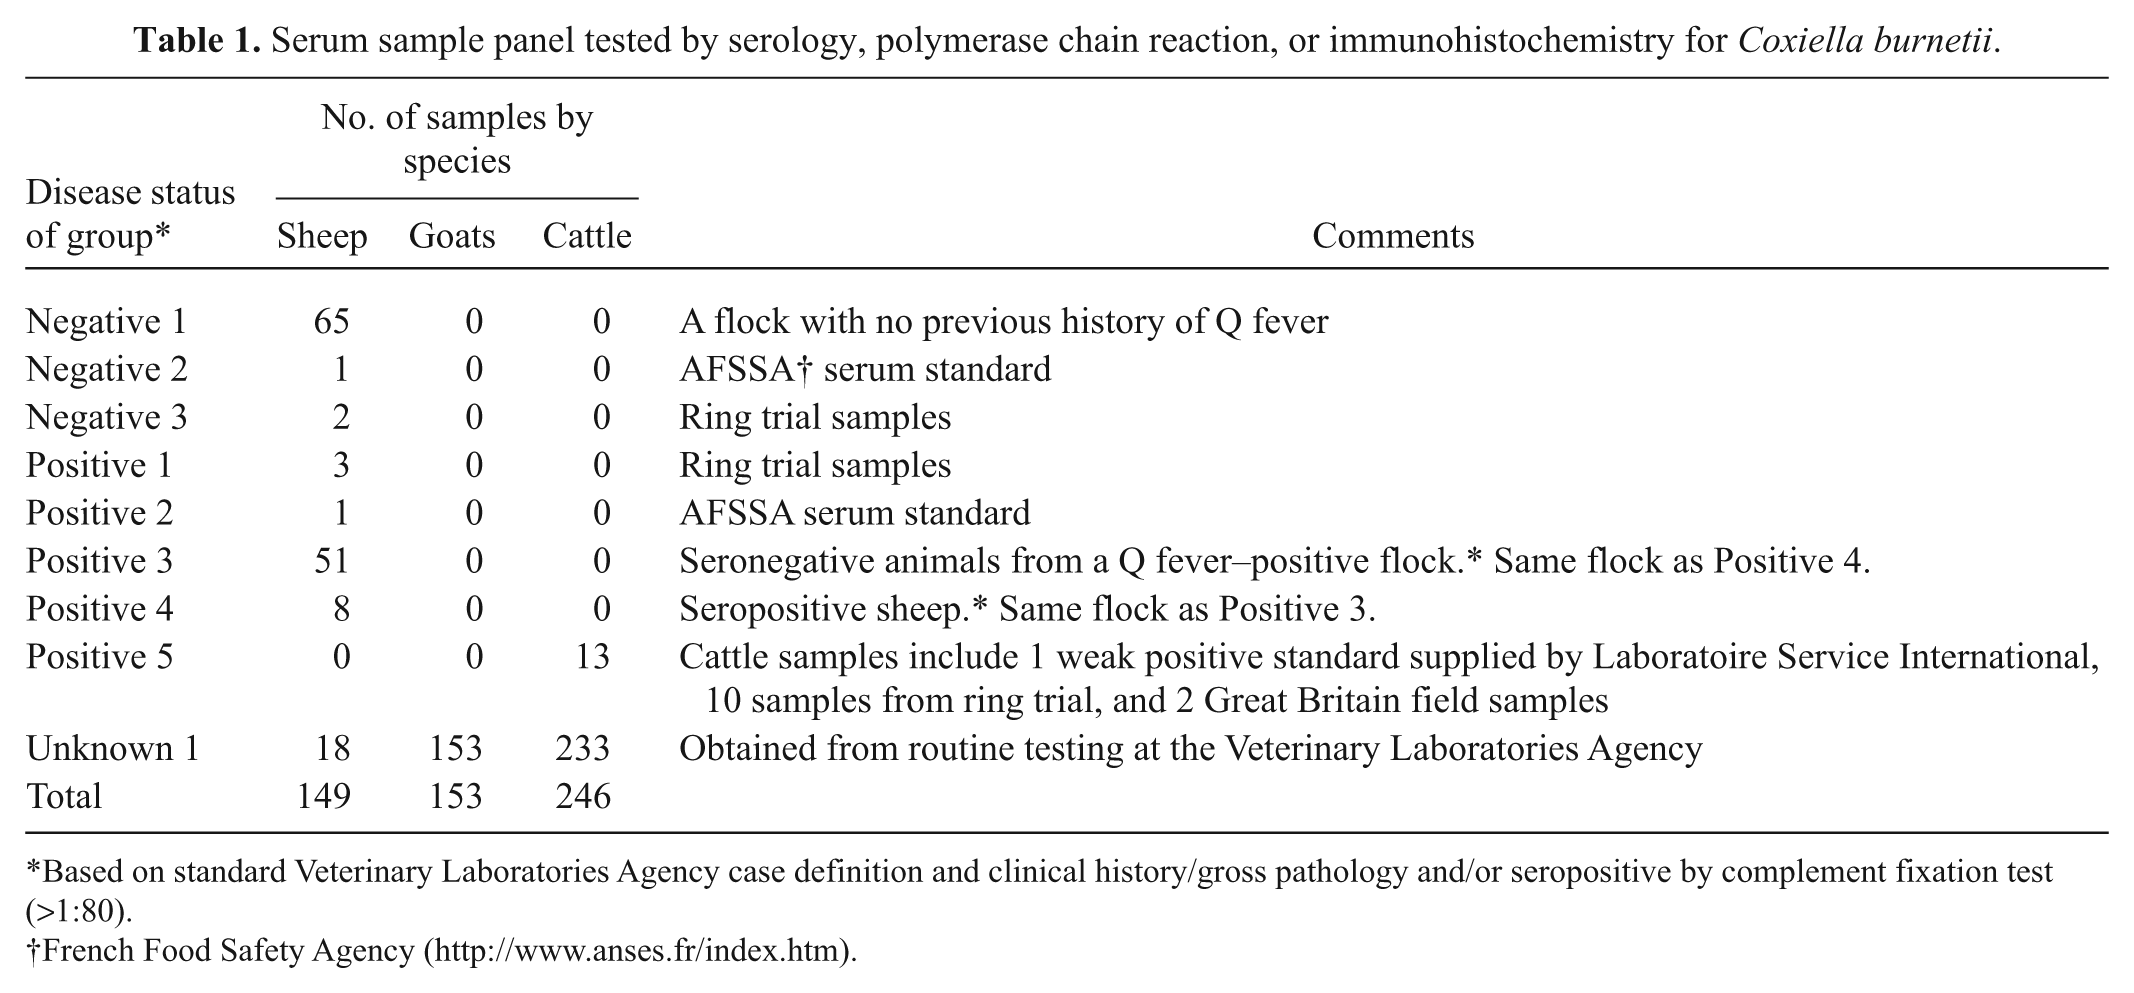
Based on standard Veterinary Laboratories Agency case definition and clinical history/gross pathology and/or seropositive by complement fixation test (>1:80).
French Food Safety Agency (http://www.anses.fr/index.htm).
Serological tests and methods
Complement fixation test
The CFT was based on the protocol described in the World Organization for Animal Health (OIE) Manual of Standards 21 and had been in routine use by the VLA for the past 20–30 years. The test used human antigen (supplied by Dade Behring, Marburg, Germany) produced in monkey kidney tissue culture. The CFT detects both phase I and phase II antibody. Antibody concentrations were expressed as titers of between 1:10 and >1:640 using doubling dilutions. The OIE guidelines 21 state that a titer of ≥1:80 is significant and indicates recent infection, 1:10 to1:40 represent latent infection and <1:10 is negative.
Enzyme-linked immunosorbent assay
Three indirect ELISAs (1–3) were used for the validation and were performed strictly according to the manufacturers’ instructions. ELISA 1 used an ovine-derived antigen; ELISA 2 used a tick-derived antigen (Nine Mile); and ELISA 3 was based on a bovine antigen. All used a conjugate that detected specific ruminant immunoglobulin G (IgG) antibody to provide evidence of exposure to C. burnetii infection. The results were based on optical density (OD) expressed as sample OD/positive control OD × 100 = sample-to-positive (S/P) ratio%. As detailed in the individual test kits, there were slight variations in the way S/P ratios were calculated between manufacturers to take into account the background OD of the sample or control (Table 2).
Manufacturers’ enzyme-linked immunosorbent assay (ELISA) result interpretation (cut-off criteria) by sample-to-positive ratio (%).*
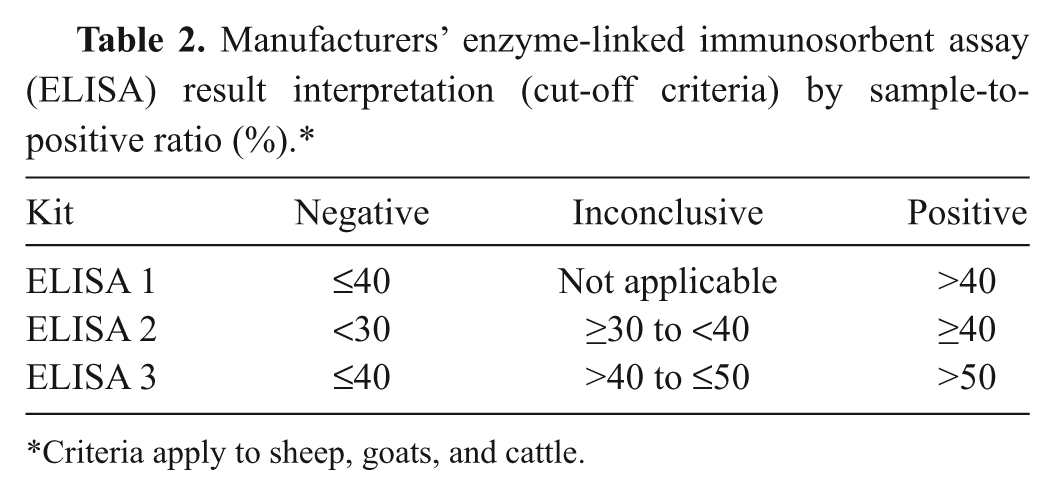
Criteria apply to sheep, goats, and cattle.
Analysis
All sera were tested by the CFT and ELISAs 1–3. The results were analyzed statistically as detailed below.
TAGS and ROC
Receiver operating characteristic 5 (ROC) analyses are normally performed on test results from samples derived from animals of known disease status. These are regarded as the gold standard and are used to compare the diagnostic performances of other tests. A ROC curve is obtained by plotting the observed sensitivity against (1 – specificity) as the test cut-off is varied. A summary measure of the test performance is given by the area under the curve (AUC), which equals the probability that a randomly chosen positive sample will give a test result of a higher value than a randomly chosen negative sample. A perfect test will have the AUC equal to 1.
In the current study, however, there were limited gold standard individual samples available and therefore ROC analyses were performed using the CFT as the gold standard to determine the extent to which the ELISA results agreed with those obtained by the CFT. A fixed cut-off was used for the CFT, with titers of <1:80 including AC results regarded as negative and ≥1:80 as positive. The ELISAs used the manufacturers’ cut-off criteria (Table 2) except that inconclusive results were omitted. The overall ELISA performance was measured by the AUC and the estimated sensitivity and specificity relative to the CFT.
Diagnostic test sensitivity and specificity of all 4 tests were also estimated statistically by maximum likelihood methods using TAGS (test accuracy in the absence of a gold standard) software 14 with the same cut-offs as described above. The estimation method assumes test independence conditional on the infection status of the individuals and constant test accuracy in each population. The validity of the TAGS estimate was assessed using a chi-square test that compares the observed test results with those predicted from the fitted model. A lower chi-square value is indicative of good agreement between the observed and predicted results.
The results of the TAGS, ROC, and other test performance indicators were analyzed separately for individual species as well as treating all species combined as a single group. The best performing ELISA was selected based on the comparative results for diagnostic sensitivity and specificity from statistical analyses and also from agreement with CFT results. Estimates for analytical sensitivity, analytical and diagnostic specificity, repeatability, and reproducibility were then determined for this best performing ELISA.
Other test performance indicators
The ELISA diagnostic test specificity was also assessed by comparing results with negative CFT sera (75 sheep, 122 goats, and 173 cattle). Analytical sensitivity was assessed by performing doubling dilutions of representative positive samples from the sample panel. The representative positive samples were comprised of 1 cow and 1 sheep serum from the known positive status group and 1 cow, 1 sheep, and 1 goat serum from the unknown status group. The end-point titration (the last dilution that obtained a positive result) was determined for both ELISA and CFT. The analytical specificity for the sheep tests was assessed by testing sera from 3 sheep that had been naturally infected and shown to have high CFT antibody titers to Chlamydophila abortus, which is the main abortifacient pathogen likely to be involved in the differential diagnosis of Q fever in Britain. These samples were not included in the main sample panel. Similar samples that could be used to test for analytical specificity for the other animal species were unavailable.
Assay repeatability (intraplate variation) was assessed by testing multiple replicates of samples selected from the sample panel. Seven samples from all species were selected that gave low, medium, and high S/P ratios when previously tested by ELISA. Repeatability data was assessed using the coefficients of variation (CV), expressed as percentages. Assay reproducibility was assessed by testing 6 sera in quadruplicate on 2 occasions by 2 operators at 2 different laboratories. The sera used comprised a single sheep confirmed negative, 3 sheep confirmed positives, and 1 goat and 2 cattle of unknown status.
The VLA also participated in the 2008 international Q fever ring trial using the CFT and the 2009 international ring trial, using only ELISA 1 (the VLA preferred test). In the 2009 ring trial, there were 74 participating laboratories (63 French, 8 other European laboratories, and 3 suppliers of ELISA test kits), 33 of which used ELISA 1 (AFSSA: 2009, InterLaboratory proficiency testing program for Q fever ELISA serology; EILA FQ: 2009, general report. AFSSA, Sophia Antipolis, France).
Results
TAGS and ROC
Treating sera from all species as a single population, the ROC analysis demonstrated agreement with the CFT for ELISAs 1 and 2 with similar AUC and sensitivity and specificity (Tables 3, 4), but a much lower sensitivity for ELISA 3. Treating sheep, goats, and cattle separately gave marginally higher AUC values for ELISA 1 than for ELISA 2 in all 3 species, but those for ELISA 3 were consistently lower.
Receiver operating characteristic (ROC) analysis on all enzyme-linked immunosorbent assays (ELISAs) by all species as 1 group and individual species.*
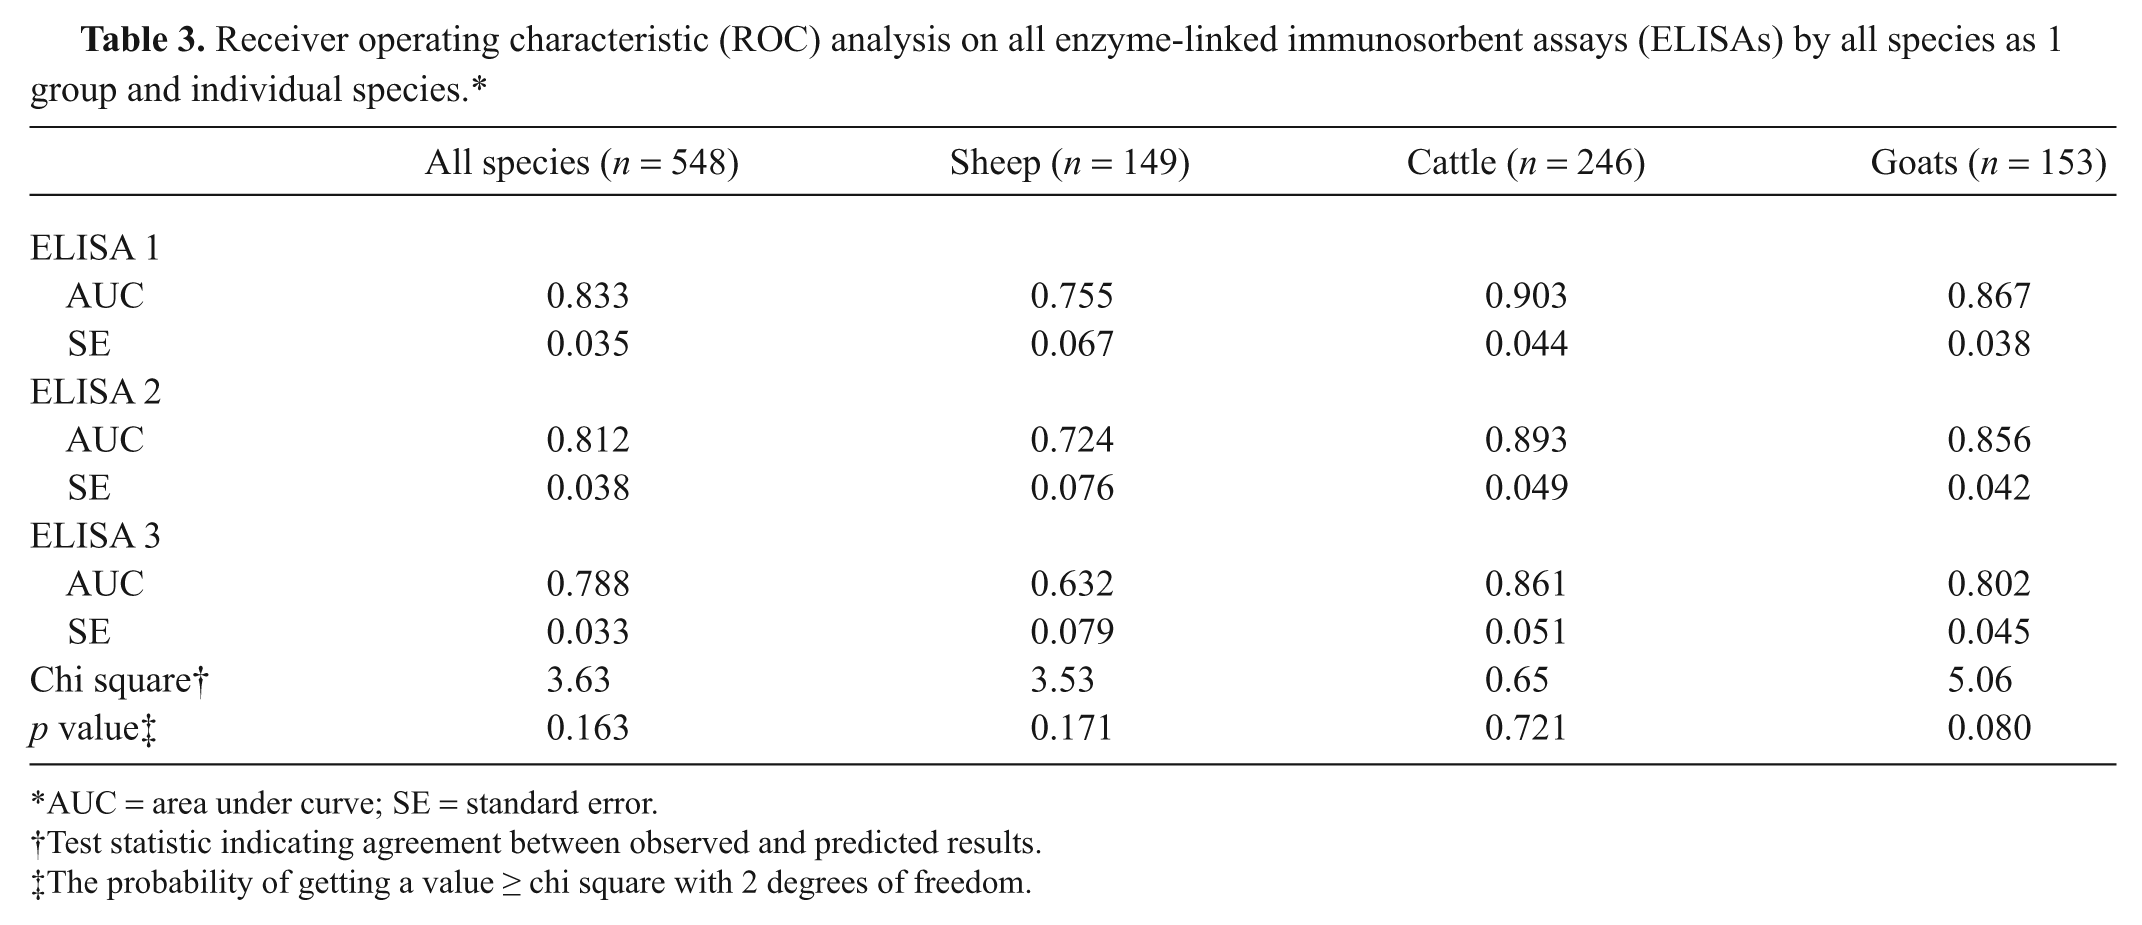
AUC = area under curve; SE = standard error.
Test statistic indicating agreement between observed and predicted results.
The probability of getting a value ≥ chi square with 2 degrees of freedom.
Sensitivity and specificity by species as determined by receiver operating characteristic analysis using a fixed cut-off.*
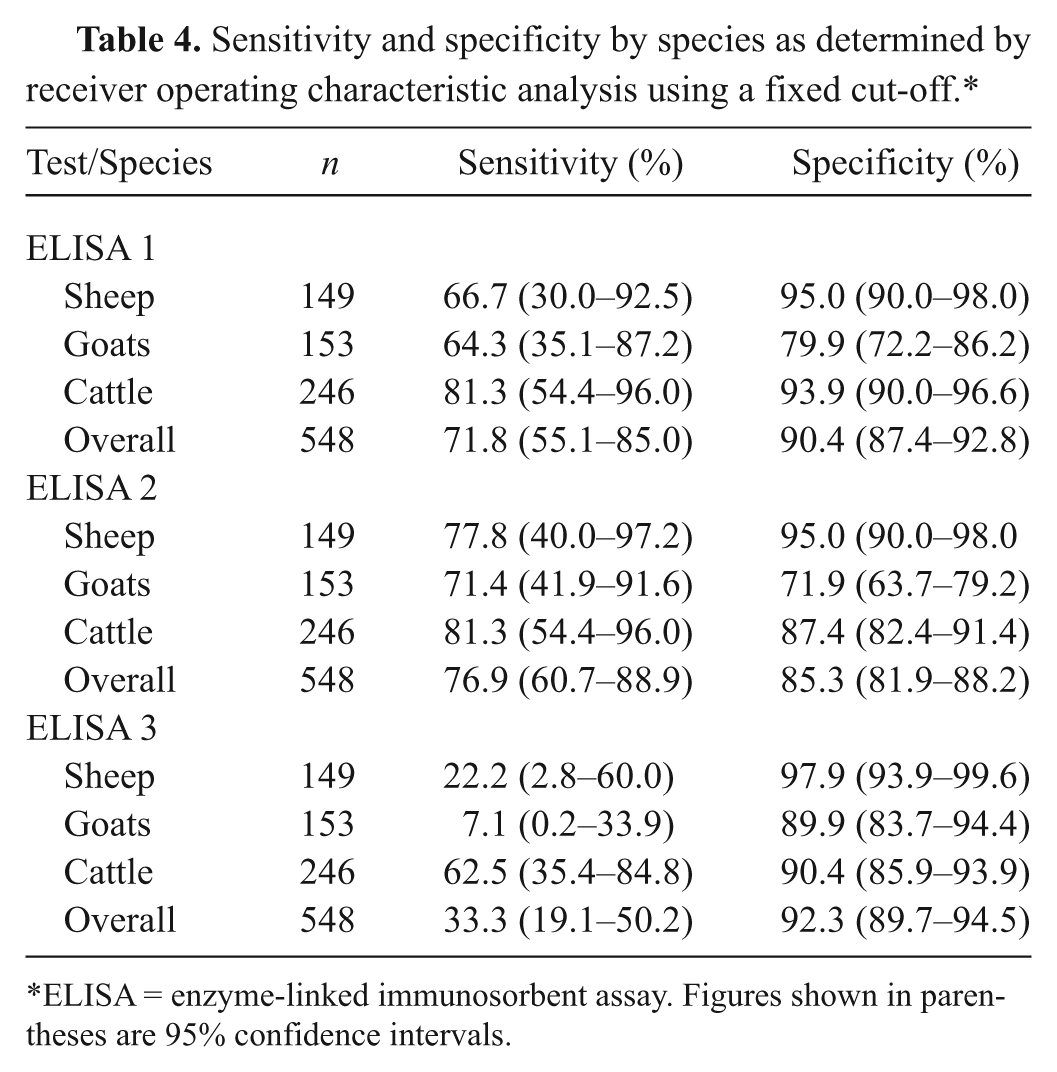
ELISA = enzyme-linked immunosorbent assay. Figures shown in parentheses are 95% confidence intervals.
When all samples were treated as a single population (Table 5), the TAGS analysis gave lower sensitivities for the CFT (36.2%) and ELISA 3 (55.7%). ELISA 2 had the highest sensitivity (98.6%) but the lowest specificity (97.1%). The TAGS analysis for individual species showed that ELISA 2 had the highest sensitivity and specificity when testing sheep samples, whereas the CFT and ELISA 3 gave much lower sensitivities. For goat samples, sensitivity was slightly higher for ELISA 2 (93.1%) than ELISA 1 (91.6%), but the specificity was lower at 91.2% compared to 98.9%; ELISA 3 and CFT again had much lower sensitivities. The model gave a poor fit (chi-square = 18.4, p = 0.005) to the cattle samples in the current study and therefore the sensitivity and specificity estimates may be unreliable.
Sensitivity and specificity results from all tests by all species as 1 group and individual species using TAGS (test accuracy in the absence of a gold standard) software analysis.*
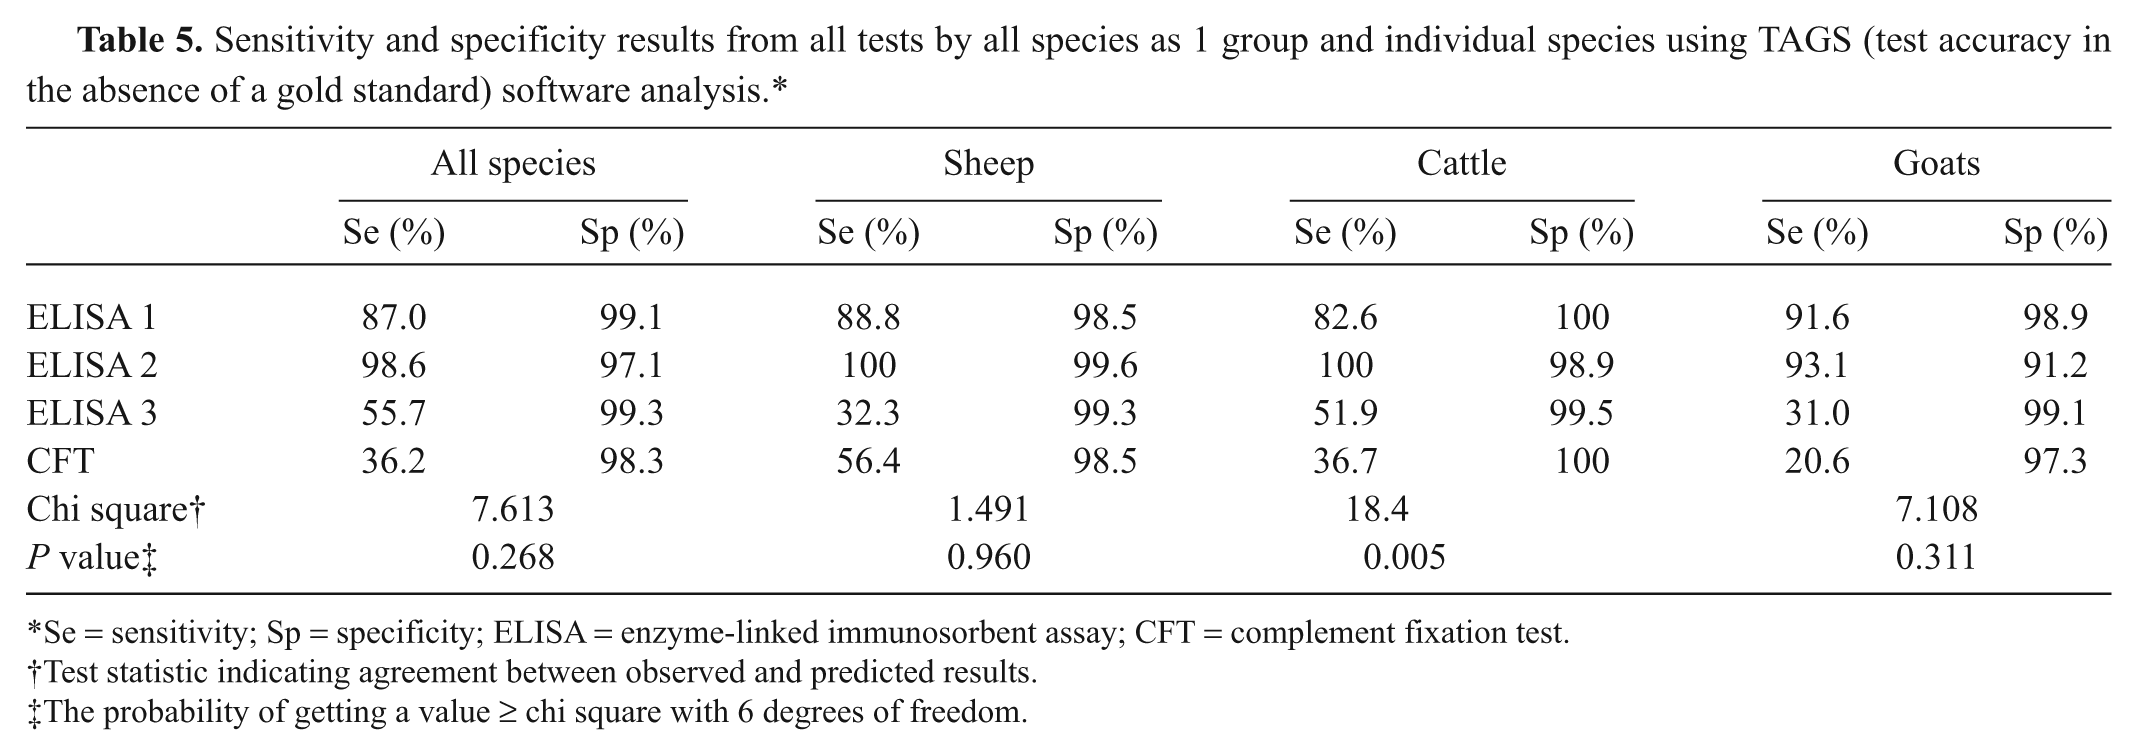
Se = sensitivity; Sp = specificity; ELISA = enzyme-linked immunosorbent assay; CFT = complement fixation test.
Test statistic indicating agreement between observed and predicted results.
The probability of getting a value ≥ chi square with 6 degrees of freedom.
Other test performance indicators
When testing samples from the negative and positive flocks (Table 1, disease status groups “Negative 1,” “Positive 3,” and “Positive 4”), the CFT results gave a similar distribution of titers for each flock (Table 6). It was not possible to make a clear distinction of disease status between the 2 flocks using the CFT. The CFT scored 2 out of 65 samples with a titer of ≥1:80 from the negative flock and 3 out of 59 samples with a titer of ≥1:80 from the positive flock. There were a total of 30 (24%) samples that gave AC results by CFT; 29 of these samples gave a negative result when tested by ELISA 1. All ELISAs demonstrated 100% specificity by correctly identifying all sample results as negative from the negative flock. ELISA 1 identified 8 positive samples from the positive flock, ELISA 2 identified 6, and ELISA 3 failed to detect any.
Distribution of complement fixation test (CFT) titers in sera from a negative and a positive sheep flock.
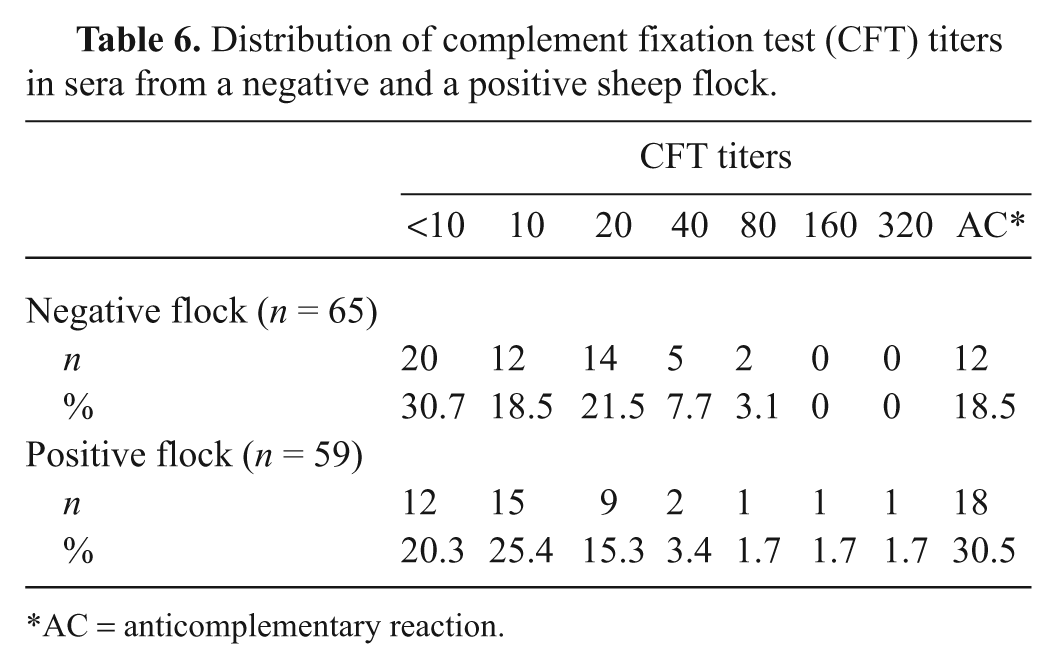
AC = anticomplementary reaction.
Further evaluation of ELISA 1
Based on the comparative results for diagnostic sensitivity and specificity of the statistical analyses, and agreement with CFT results, ELISA 1 had the best overall test performance, and therefore, it was evaluated further. When tested against sera with negative CFT titers (<1:10), ELISA 1 scored as negative 74 (98.7%) out of 75 sheep samples, 102 (83.6%) out of 122 goat samples, and 170 (98.26%) out of 173 cattle samples. When assessing analytical specificity, 100% correct results were obtained when testing sheep samples with no cross reactivity for samples containing antibodies to C. abortus (Table 7). Analytical sensitivity using samples from all 3 species demonstrated the final end-point titer of both ELISA 1 and CFT to be similar (Fig. 1). Assay repeatability was assessed using intraplate variation, which gave a range of CV from 6.9% to 12%. This range was considered within acceptable limits (Table 8). Satisfactory reproducibility data was demonstrated overall: both operators in laboratory 1 scored all results correctly, and in laboratory 2, operator C scored 47 out of 48 and operator D scored 46 out of 48 results correctly (Table 9). Further evidence supporting ELISA 1 was found from the 2008 and 2009 Q fever serology international ring trials in which the VLA participated. The 2009 trial included 33 laboratories that used ELISA 1, which gave 100% correct results for both trials and, where the CFT was included (2008 trial), demonstrated improved sensitivity and specificity compared with that of the CFT.
Results of analytical specificity testing using Veterinary Laboratories Agency (VLA) standards.*
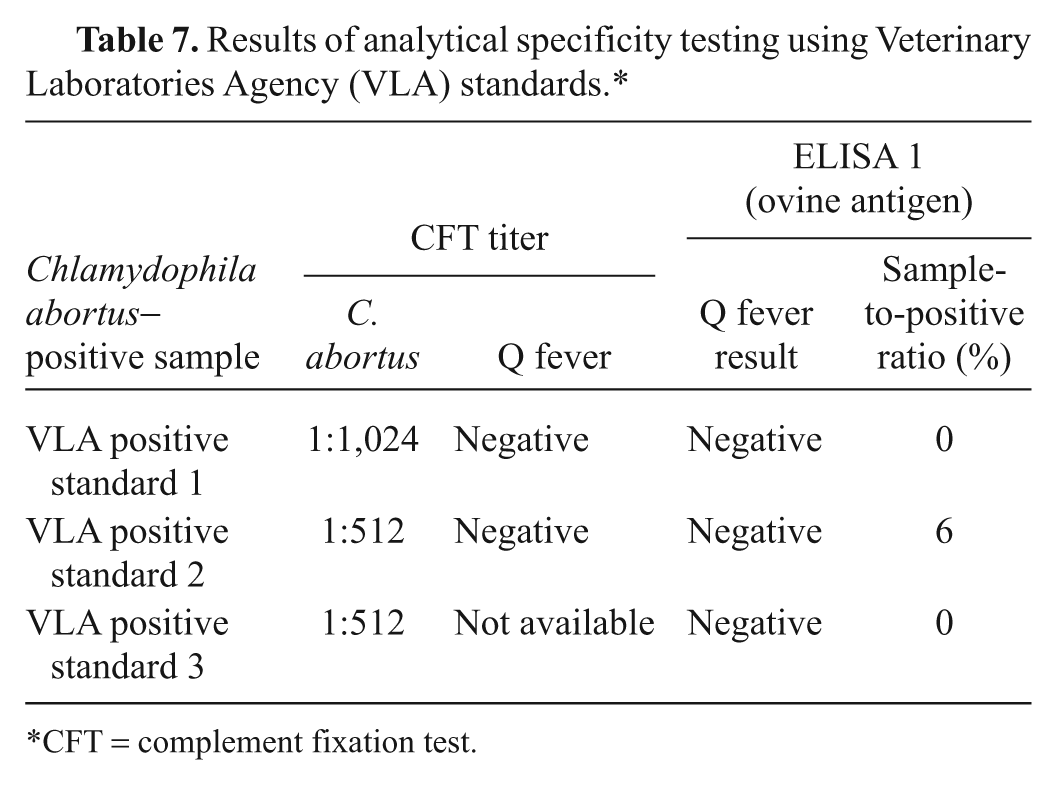
CFT = complement fixation test.
Repeatability—intraplate variation.*
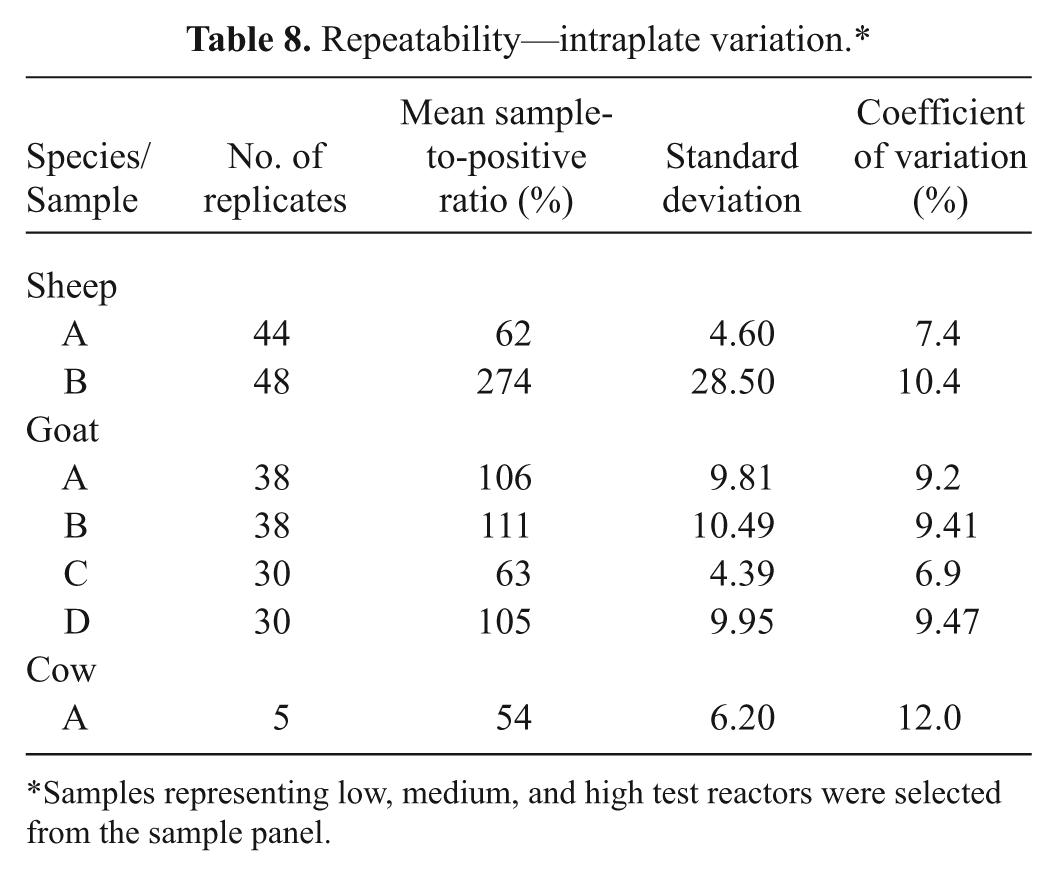
Samples representing low, medium, and high test reactors were selected from the sample panel.
Reproducibility—correct diagnoses obtained at 2 different laboratories.
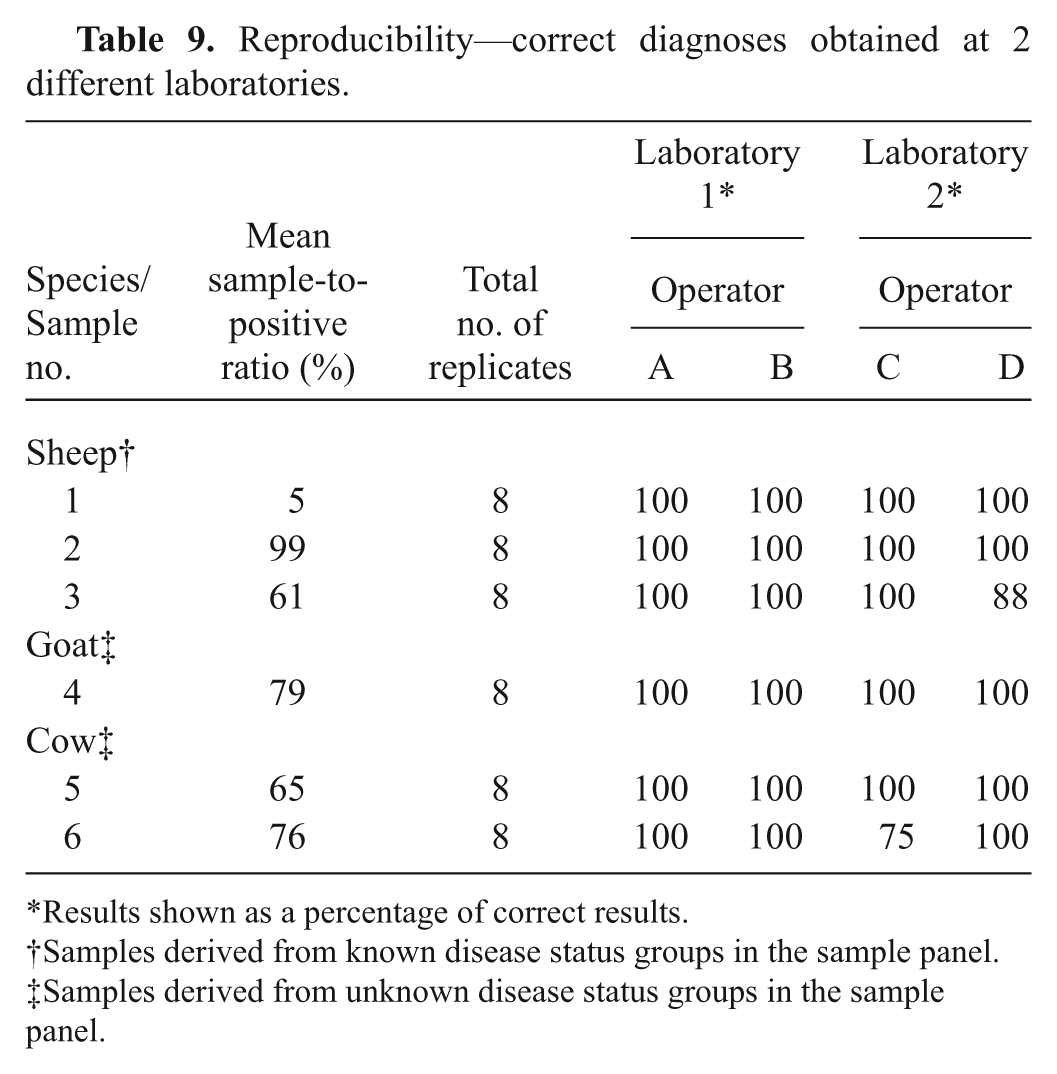
Results shown as a percentage of correct results.
Samples derived from known disease status groups in the sample panel.
Samples derived from unknown disease status groups in the sample panel.
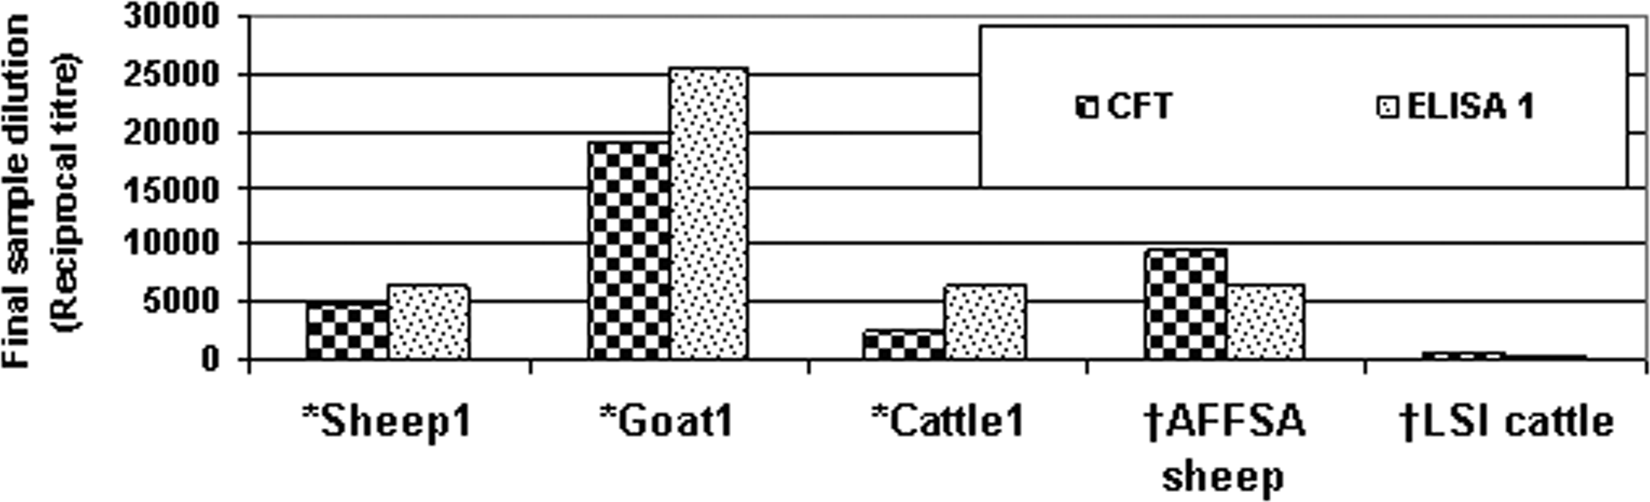
Graph to compare end-point titers of enzyme-linked immunosorbent assay (ELISA) 1 (ovine antigen) against complement fixation test (CFT) with representative field samples and recognized standards. *Samples were derived from the unknown disease status group in the sample panel; the samples had previously been tested positive by ELISA 1 (ovine antigen) before being titrated to establish the end point titer (the last dilution that had a positive result). †Samples were derived from the known positive status group in the sample panel; the samples had previously tested positive by ELISA 1 (ovine antigen). AFFSA = French Food Safety Agency; LSI = Laboratoire Service International.
Discussion
Despite its inherent problems, the CFT has been a mainstay of Q fever serological testing in veterinary and human diagnostic laboratories for many years. However, ELISA is increasingly being used for the testing of a wide range of animal species,8,19 is shown to be more sensitive and specific than the CFT,10,13,15 and has recently been recommended by EFSA for test harmonization. 7
Poor agreement was evident between the ELISAs and CFT10,16 using ROC analysis with a CFT cut-off titer of 1:10 but good agreement (0.8 AUC) when treating all species as 1 population using a CFT positive cut-off titer of ≥1:80. When test results of samples from individual species were analyzed separately, ELISAs 1 and 2 gave similar sensitivity and specificity, but ELISA 3 was less sensitive. When analyzing all species as 1 population, results from both the ROC and TAGS analyses confirmed that ELISAs 1 and 2 were the tests that performed best.
When testing sera from groups of known disease status (Table 1) by CFT, the distribution of titers was very similar for both the negative and positive flocks, and the CFT failed to discriminate between negative and positive sera or flocks. The CFT also produced a high proportion (24%) of sheep samples with an AC untestable sample result, which is a recognized problem with CFT.13,18 This high proportion of test failures adversely impacts test efficiency and significantly contributes to the cost of testing, since repeat sampling is required. Test failures were not encountered with ELISA, which is also less labor intensive and particularly useful for testing a large number of samples such as for surveys.
The ELISA results from testing sheep samples from negative and positive disease status flocks (Table 1, disease status groups “Negative 1,” “Positive 3,” and “Positive 4”) clearly demonstrated that ELISA 1 was the best performing test, correctly identifying all samples as negative from the negative flock and scoring the highest number of positive results (14%, 8/59) when testing samples from the positive flock. This rate of seroprevalence, which was also demonstrated by the TAGS analysis, is typical of that found in Q fever–positive flocks. 16 The results from testing individual animals from a group with a low seroprevalence of infection should be viewed with caution. It is suggested that serological tests should only be used for determining flock status, rather than individual animal status, which is the approach recommended by EFSA. 7 When focusing on all groups of sheep samples, the TAGS analysis showed that ELISA 2 was the best performing test. When treating all species as 1 population, the TAGS analysis gave ELISA 2 the overall highest sensitivity (98.6%) whereas ELISAs 1 and 3 gave the best specificity (99.1% and 99.3%, respectively). When test results of samples from individual species were analyzed separately, ELISA 2 gave the best sensitivity when testing sheep and goat sera, but ELISA 3 had better specificity than ELISA 2 for goat sera. The TAGS model gave a poor fit of test performance when testing cattle samples and, therefore, estimates of sensitivity and specificity in this species should be treated with caution.
Although ROC and TAGS analyses indicated similar sensitivity and specificity in ELISAs 1 and 2, the former correctly detected all known standards and positive control samples. However, it has been shown that the use of an ovine-derived antigen (ELISA 1) was more sensitive than that using tick-borne (Nine Mile)–derived antigen (ELISA 2; Rodolakis et al.: 2007, Is the Coxiella burnetii nine mile strain a suitable antigen for detection of CIF antibodies of ruminants by ELISA? In: Proceedings of the 13th International World Association of Veterinary Laboratory Diagnosticians Symposium, Nov. 11–14, Melbourne, Australia), which supported the findings in the current study with sheep sera from known disease status flocks.
ELISA 1 was selected as having the best overall test performance and was subjected to further evaluation using a negative panel group of negative CFT sera with CFT titers of <1:10 to assess diagnostic specificity. ELISA 1 showed 98.7% agreement with sheep sera, 98.2% with cattle, and 83.6% with goats. Furthermore, ELISA 1 did not cross-react with sera from sheep that were infected with C. abortus, which in practice is likely to present the main differential diagnosis. One possible drawback is that ELISA 1 does not differentiate between field infection and vaccination (manufacturer’s information sheet). However, Q fever vaccination is not currently practiced in the United Kingdom. Analytical sensitivity as measured by final end-point titers of known positive samples from all the animal species tested demonstrated that the detection limits were similar and comparable for both the ELISA 1 and CFT. Test reproducibility for ELISA 1 was also shown to be satisfactory. Final confirmation of the suitability of ELISA 1 came from the international ring trial results. In conclusion, the main advantages of ELISA over the CFT include better sensitivity and specificity, elimination of AC results, and improved testing efficiency by use of automation methods. The VLA concluded that ELISA 1 had the best performance of the 3 ELISAs under trial.
Footnotes
Acknowledgements
The authors would like to thank private veterinary surgeons for submitting sera to VLA regional laboratories for testing, and Guda Van der Burt and Paul Holmes for sampling negative and positive flocks. The CFT testing was performed by colleagues in the Laboratory Services Department at VLA Weybridge, UK.
The author(s) declared no potential conflicts of interest with respect to the research, authorship, and/or publication of this article.
This work was funded by Defra through VLA FZ2100 Non-Statutory Zoonoses surveillance project and was undertaken by the VLA Specialist Scientific Services Department, Weybridge, UK.