
Abstract
Diagnosis of prion disease is primarily through immunodetection of the infectious agent. Typically, 2 distinct procedures are recommended for a definitive diagnosis, with immunohistochemistry and Western blot providing the most information as to the specific isolate in question. In the past, these approaches required formalin-fixed, paraffin-embedded tissue and fresh or frozen tissue, respectively; however, methods have been developed that allow for use of fixed tissue for Western blot. The present study describes a method of enriching PrPSc in formalin-fixed, paraffin-embedded tissues prior to Western blot analysis for the detection of PrPSc. With this modified procedure, 5 times the previously reported sample size may be used for analysis, greatly enhancing the sensitivity of this procedure.
Keywords
Transmissible spongiform encephalopathies (TSE) or prion diseases result from a conformational change in the host-encoded normal cellular form of the prion protein (PrPC) to a disease-associated form termed PrPSc. PrPSc is widely accepted to be the causative agent of TSE. 4 There are no pathognomonic clinical signs of a TSE, and specific immune responses have not been detected in TSE-infected organisms, therefore, serological tests for the presence of PrPSc are not available. Due to the fact that the infectious agent is a protein, nucleic acid–based detection methods are similarly unavailable. Currently, diagnosis of TSE is primarily conducted via immunodetection, including immunohistochemistry, Western blot (WB), and enzyme-linked immunosorbent assay (ELISA)-based approaches. 5,6
Western blot analysis of PrPSc is important not only as a confirmatory test for the ELISA rapid tests but also as a primary means to discriminate TSE isolates based upon the specific molecular weight of the resultant PrPSc bands on the blot. While typical WB procedures employ fresh or frozen tissues, recent advances allow WB analysis of PrPSc from tissues that had been fixed in formalin expanding the opportunity to analyze TSE isolates for which no fresh or frozen tissues were available. 1,3 Using this approach, formalin-fixed, paraffin-embedded tissues have been used in WB-based molecular profiling differentiating TSE strains. 2 The method presented in the current study enhances the sensitivity of these methods using centrifugation to pellet all detectable PrPSc, allowing substantially more tissue to be analyzed by WB. This allows analysis of samples containing either too little tissue or too little PrPSc to otherwise be used for formalin-fixed, paraffin-embedded tissue WB.
The present study utilizes paraffin-embedded tissue samples of brainstem (obex region) from sheep euthanized as part of scrapie research conducted at the National Animal Disease Center–U.S. Department of Agriculture–Agricultural Research Service (Ames, Iowa). The brainstem samples were collected in 10% buffered formalin prior to processing in paraffin blocks, with time in formalin ranging from 7 days to 1 year. Studies of formalin-fixed tissues report a marked sensitivity decrease for tissues left in formalin for 2 or more years. 3
The method described herein is an extension of previously published methods for WB of formalin-fixed samples for the purposes of detecting the disease-associated form of the prion protein. 1,3 From each paraffin block, 4 tissue sections (each 5-µm thick) were collected into 1.5-ml microfuge tubes. To each tube, 150 µl of a tissue resuspension buffer (50 mM Tris, 1 mM ethylenediamine tetra-acetic acid, 0.5% Tween 20 [pH 7.5]) was added. The tube was then placed in a 100°C heat block for 10 min then immediately placed on dry ice. The process was repeated once and then followed by an additional 10 min at 100°C. Upon conclusion of the 100°C incubation, the samples were immediately centrifuged at 16,000 × g for 10 min to allow separation of paraffin from the buffer and tissue suspension. Removal of paraffin is essential to downstream WB, and if the separation was incomplete at this step, an additional 10 min at 100°C incubation followed by centrifugation was included. Tissue and buffer were transferred to a new microfuge tube using a 16-gauge needle. Typical sample volumes at this step are approximately 100 µl. The tissue was further disrupted at this point by mechanical sheering with the needle tip. The tubes containing the samples were then placed in a bath sonicator on ice for 10 cycles of 1 min using a constant duty setting and 90% amplitude with a 30-sec pause between cycles. The samples were then stored overnight at –20°C. At the start of the next day, the samples were sonicated as above for 1 cycle prior to digestion with proteinase K a using a final enzyme concentration of 5 U/ml (100 µg/ml) at 37°C for 1 hr. Proteolytic digestion was stopped by addition of Pefabloc b to a final concentration of 0.1 mg/ml. At this point, 20 µl was removed and placed on ice for WB analysis (Fig. 1). This unenriched sample is equivalent to samples previously used in analysis of formalin-fixed, paraffin-embedded tissue by WB. 1,2 The remaining approximately 80 µl of sample was spun at 186,000 × g for 55 min. The supernatant was removed, 20 µl was kept on ice for WB, while the remainder was discarded. The pellet was resuspended in 20 µl of tissue resuspension buffer (see above). To each 20 µl of sample, 8 µl of sodium dodecyl sulfate–polyacrylamide gel electrophoresis (SDS-PAGE) sample buffer and 1.8 µl of 2-mercaptoethanol was added. The sample was then heated to 99°C for 30 min, allowed to cool, and loaded on a commercially prepared 12% SDS-PAGE gel. c The gel was then blotted to a polyvinylidene difluoride membrane d and blocked with 3% bovine serum albumin. e Detection of PrPSc by WB was conducted by using mouse anti-PrP monoclonal antibody P4 f at a 1:10,000 dilution (0.1 µg/ml) as the primary antibody. A biotinylated sheep anti-mouse secondary antibodyd at 0.05 µg/ml and a streptavidin–horseradish peroxidase conjugate d were used with a commercial detection system d and were visualized using either chemiluminescence or chemifluorescence.
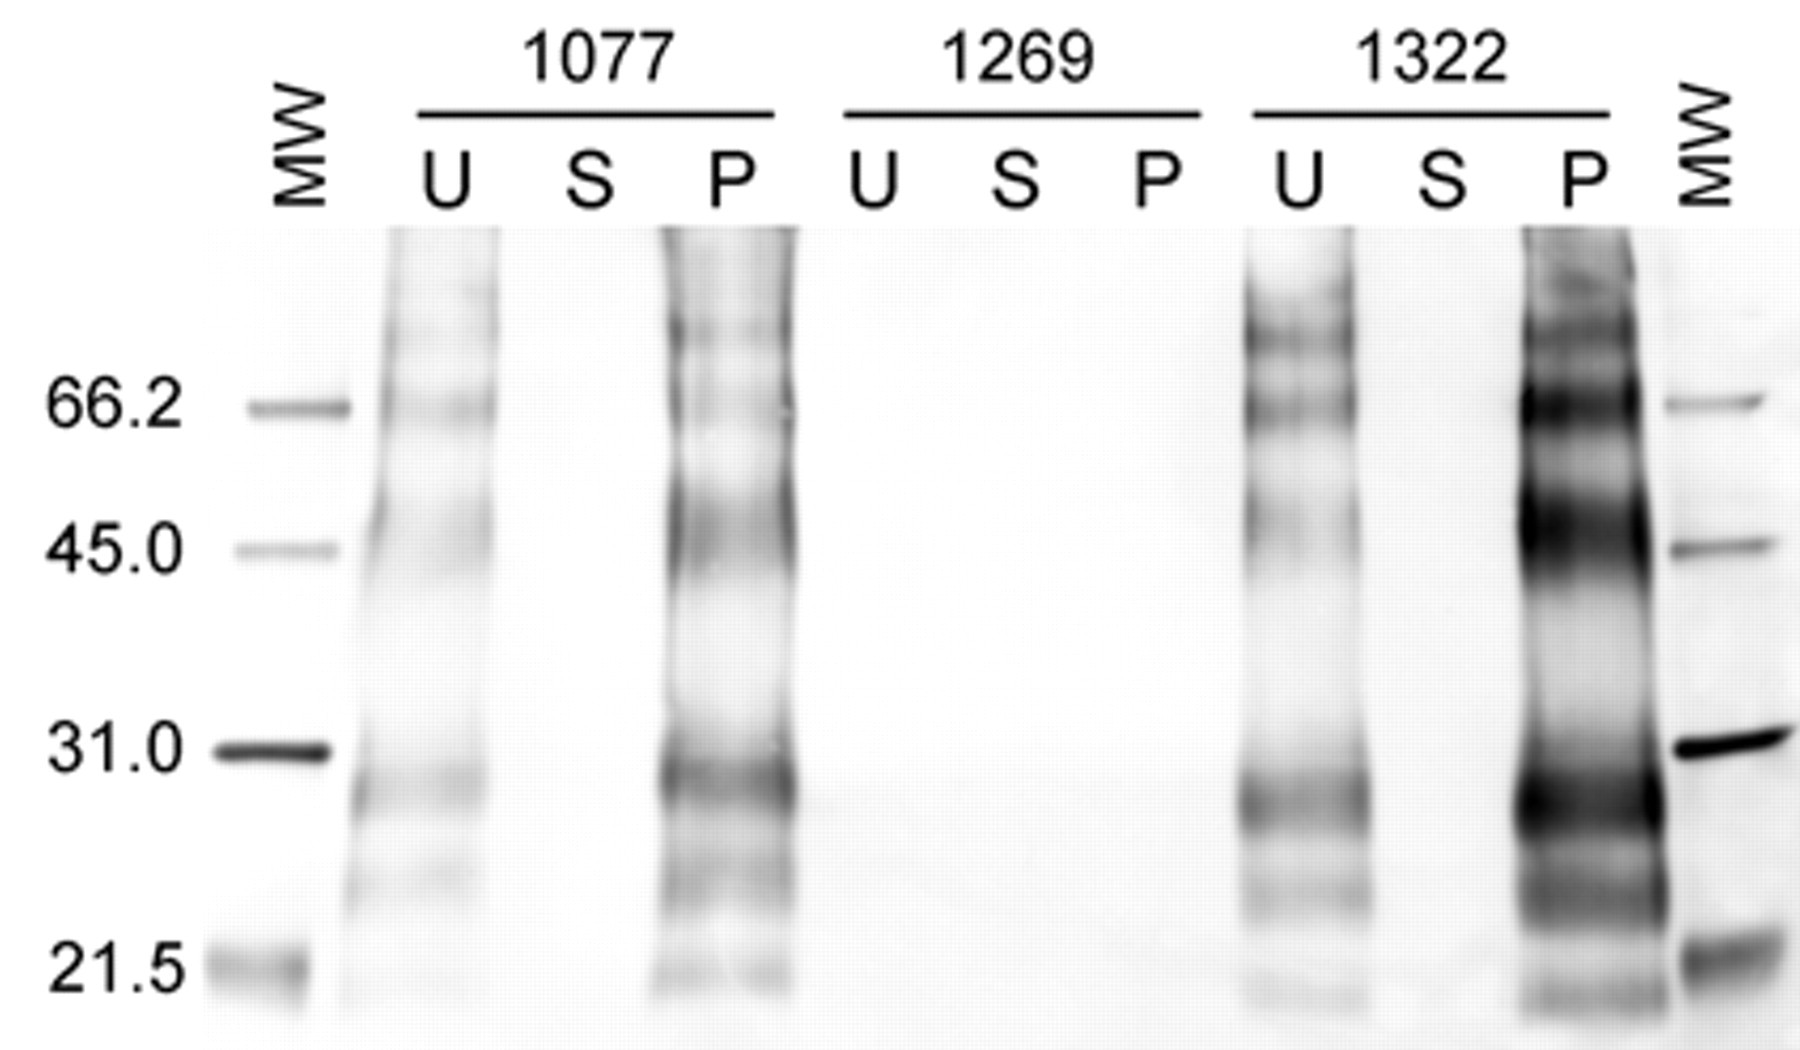
Representative Western blot of paraffin-embedded tissues. Molecular weight markers on left and right sides of the blot are identical, with the weight (in kD) labeled to the left of the blot. Animal numbers are shown for each group of lanes with the unenriched lane (U), supernatant (S), and pellet (P) labeled for each animal. The 2 inoculated animals, 1077 and 1322, exhibit PrPSc in both the U and P lanes, with the P lanes showing markedly high amounts in both cases while the S lanes exhibit no detectable PrPSc. Animal 1269 is a noninoculated control animal, and no PrPSc is observed in the U, S, or P lanes.
Using the method as described, approximately 4 times the amount of tissue previously used for WB analysis of formalin-fixed, paraffin-embedded tissue 1 can be readily loaded into a single well of an SDS-PAGE, greatly enhancing the sensitivity. This allowed for one-fifth of the total sample to be kept for comparison purposes. If the entire sample was pelleted and loaded, the increase in loading would be 5 times what was previously possible.
A representative WB is shown in Figure 1. The 3 bands corresponding to un-, mono-, and di-glycosylated PrPSc between 20 and 30 kD were clearly present in the enriched (pellet) fraction. The nonenriched portion of the sample is clearly lower in intensity for all bands than the enriched portion. The supernatant from the enrichment centrifugation step has no detectable PrPSc, indicating that all the detectable PrPSc is in the pellet following the centrifugation at 186,000 × g for 55 min. Band intensity analysis was not applied; however, assuming 100% recovery during the centrifugation step and linear detection range, a 5-fold enhancement of sensitivity would be obtained. To address the recovery from the centrifugation step and avoid concerns about linearity of detection, 2 samples corresponding to one-fifth of the total sample were loaded (Fig. 2). The first sample is one-fifth the total sample (20 µl) prior to enrichment loaded as indicated above. The second is from the remaining four-fifth of the sample (80 µl) enriched by centrifugation, and the pellet dissolved in a total volume of 80 µl. Of this 80 µl, 20 µl is loaded as described for the unenriched sample. Assuming full recovery of the sample, these 2 should contain equivalent amounts of PrPSc. By visual inspection, the enriched pellet and unenriched samples do show equivalent levels of PrPSc.
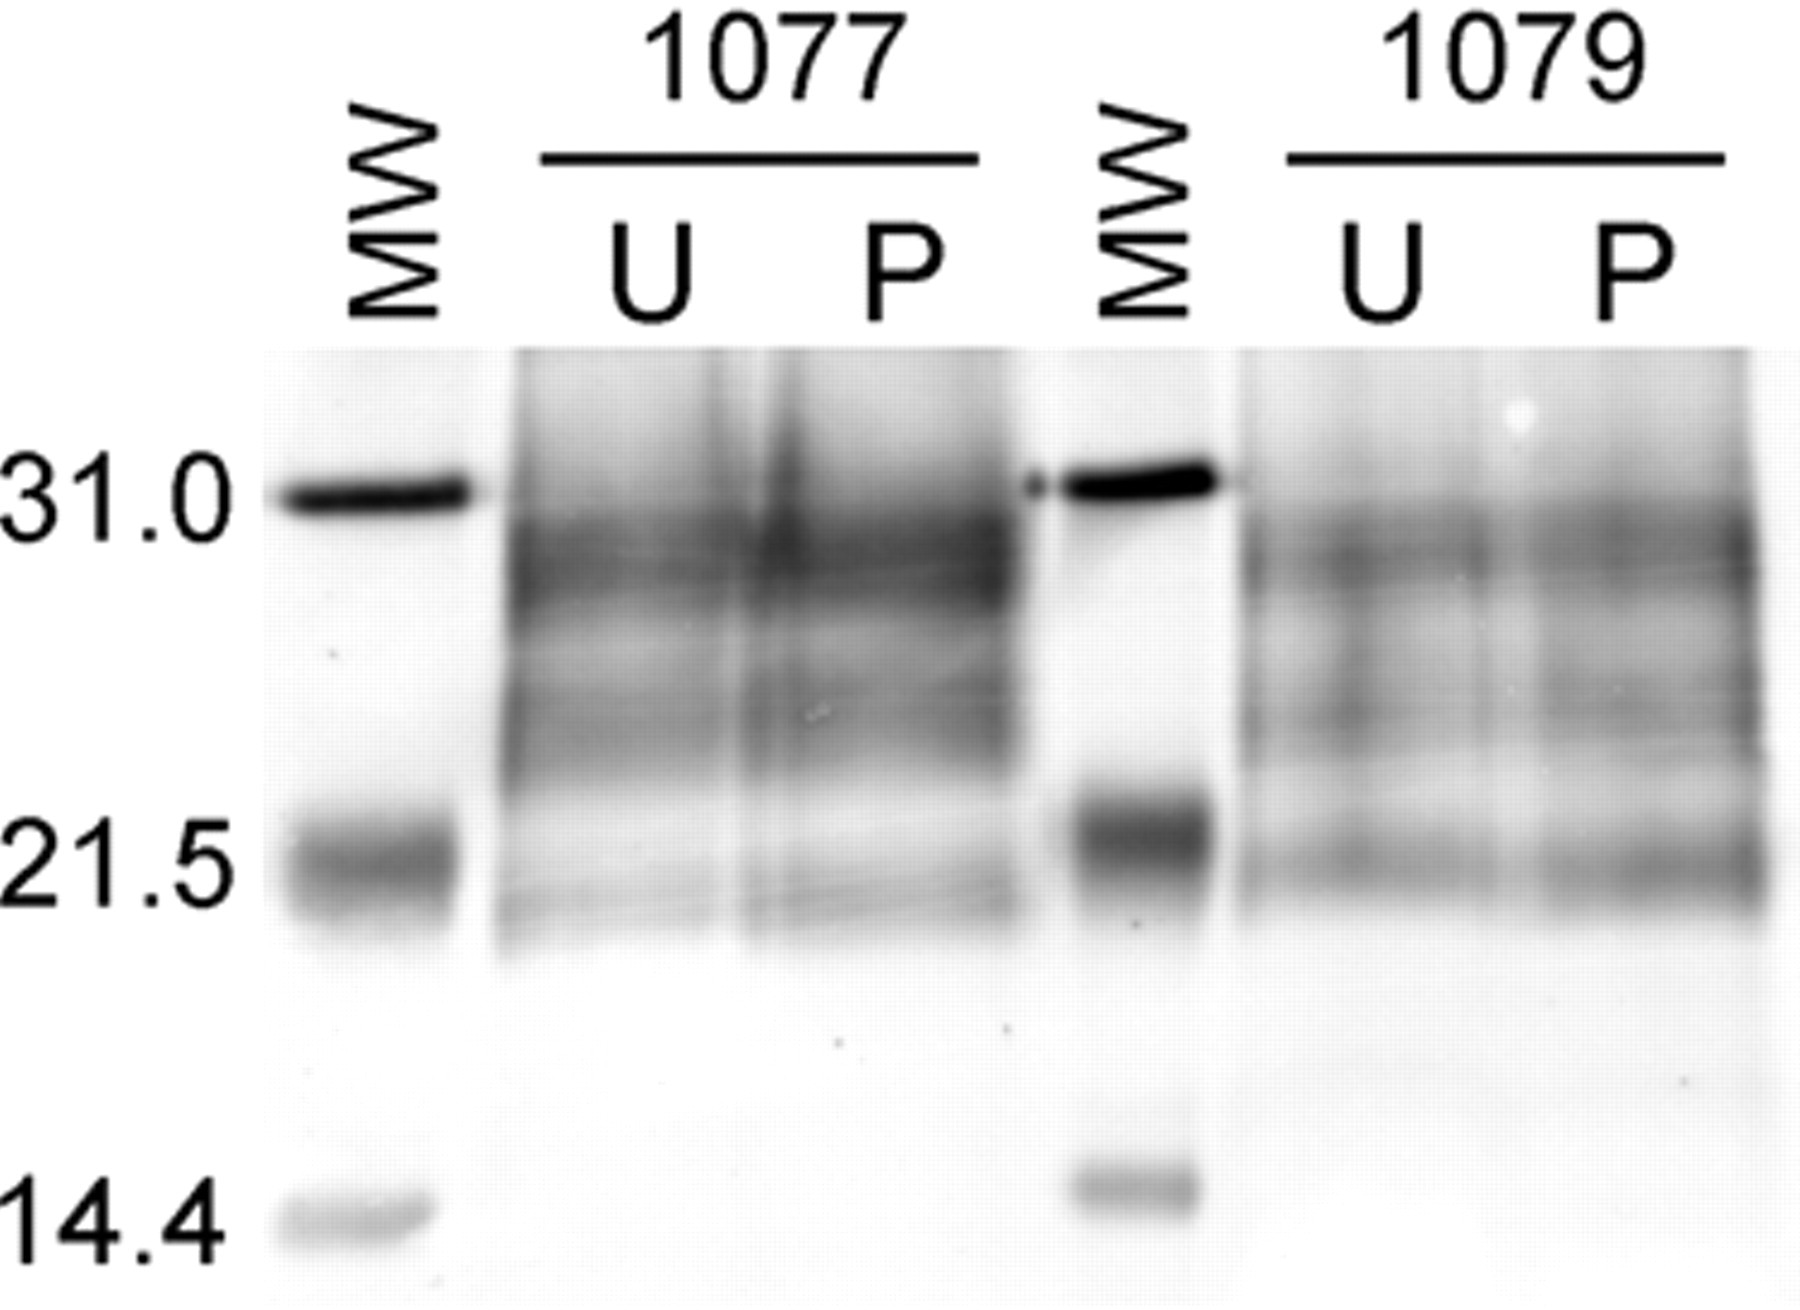
Formalin-fixed, paraffin-embedded tissue samples each corresponding to one-fifth the total tissue found in 4 sections (each 5-µm thick). Molecular weight markers to the left of each pair of samples are identical, with the weight (in kD) labeled to the left of the blot. The animal numbers are as indicated, and the lane labels correspond to unenriched (U) and one-fourth of the available pellet (P). Equivalent amounts of detectable PrPSc are found in the U and P lanes indicating essentially full recovery of PrPSc as would be expected based upon the absence of PrPSc found in the supernatant (see Fig. 1).
As previously reported, there are numerous higher molecular weight species present for PrPSc-containing samples. 1,3 These higher weight species are most likely PrPSc irreversibly cross-linked in the formalin fixation process. Estimates of the amount of PrPSc present, as higher order species vary from sample to sample, can approach 50%. 3 The presence of PrPSc as multiple higher weight bands results in a corresponding reduction in the amount of PrPSc that would otherwise be observed in the 20–30 kD range. The method reported herein allows for up to 5 times the amount of material to be loaded, decreasing the likelihood that the reduction in band intensity in the 20–30 kD range will prevent analysis of the molecular weight profile of those bands. Centrifugation for less than 1 hr at 186,000 × g can readily be incorporated into any diagnostic or research protocol utilizing formalin-fixed, paraffin-embedded tissues for detection of PrPSc, thus greatly enhancing the sensitivity of the approach.
Footnotes
Acknowledgements
The author thanks Trudy Tatum and Martha Church for technical assistance and Drs. Tracy Nicholson and Marcus Kehrli for critical evaluation of the manuscript. Disclaimer: Mention of trade names or commercial products in this article is solely for the purpose of providing specific information and does not imply recommendation or endorsement by the U.S. Department of Agriculture.
a.
USB Corp., Cleveland, OH.
b.
Roche Diagnostics Corp., Indianapolis, IN.
c.
Invitrogen Corp., Carlsbad, CA.
d.
GE Healthcare Technologies, Piscataway, NJ.
e.
Sigma-Aldrich, St. Louis, MO.
f.
R-Biopharm AG, Southmarshall, MI.
The author(s) declared no potential conflicts of interest with respect to the research, authorship, and/or publication of this article.
This research was funded in its entirety by the U.S. Department of Agriculture, Agriculture Research Service.