
Abstract
Measurement of cytokine concentrations within body fluids is a means of recognizing subclinical and/or unresolved, infectious and inflammatory states in patients. In the urinary tract, such information may be useful for identifying patients with pyelonephritis, asymptomatic bacteriuria, recurrent infections, and cystitis. One such cytokine, interleukin-6 (IL-6), is recognized as a primary cytokine that is produced following exposure of the urothelium to bacterial virulence factors. Complicating reliable testing for this and other cytokines is the nature of urine itself. Urine varies widely in its composition as indicated by the range of pH and urine specific gravity (USG) observed in healthy patients. An additional variable is the protein and carbohydrate matrix capable of hindering immunologic testing modalities, such as enzyme-linked immunosorbent assays (ELISAs). The purpose of the current study was to examine the role of urine pH, USG, and matrix while optimizing a canine-specific chemiluminescent ELISA for the measurement of IL-6 in the urine of dogs. Urine spiked with IL-6 obtained maximal IL-6 quantitative recoveries of only 55 ± 10% (mean ± 1 standard deviation) when an ELISA optimized for cell culture supernatants was used. The urine matrix and variations in USG were determined to by contributing to this poor IL-6 recovery. Using specific matrix inhibitors and optimal dilutions improved the IL-6 quantitative recovery to 91 ± 5%. Urine pH (5.5–9.5) had no effect. The current work underscores the importance of critically optimizing testing modalities for biomarkers, particularly if they are immunologic in origin.
Identifying biomarkers capable of indicating the presence or severity of disease is a blossoming area of research in veterinary medicine. In the past, the lack of reagents had been a major impediment to undertaking immunologic studies in dogs. With completion of the canine genome project, there has been an increased availability of canine-specific immune components, and with that, the rapid development and application of research-based assays for clinical medicine. Unfortunately, the variable nature of clinical samples (blood, urine, effusions) makes assay translation from a controlled cell-supernatant platform challenging. Such challenge is especially true when considering urine, which can readily change in composition regardless of the health status of the patient.
Successful immunologic assays require an optimal pH and ionic strength that promotes specific antibody-antigen complexes while reducing the nonspecific binding of proteins that may increase assay interference. As such, minimizing the variability within assay components, including patient samples, is vital. Within urine, 2 components, pH and urine specific gravity (USG), vary substantially from sample to sample. In dogs, urine pH ranges from 5.5 to 7.5, but higher and lower values can be detected in certain diseases. 12 Urine specific gravity also varies within dogs spanning a range of 1.001 to >1.030. 9 Both factors may contribute to assay failure.
Urine specific gravity is a measure of the density of the urine as compared with water. Solutes within the urine increase USG, with solute concentration, molecular weight, and molecular size, all contributing to the total USG. The most common solutes include urea and ions. Proteins and carbohydrates are also present and play an important role because they create a matrix capable of hindering testing by immunologic assays. The confounding nature of these solutes, proteins, and carbohydrates prevents the simple translation of a cell culture supernatant assay for urine.
The purpose of the current study was to optimize a canine-specific enzyme-linked immunosorbent assay (ELISA) for accurate measurement of interleukin-6 (IL-6) concentrations in urine. Interleukin-6 was chosen as a target antigen because this cytokine is known to increase in concentration within the urine minutes to hours following exposure of urothelium to Gram-negative bacterial products. 2,6 In human medicine, IL-6 concentrations have been shown to be an important predictor of pancreatic inflammation and pyelonephritis. 1,10 Translating these data to veterinary medicine may demonstrate that urine IL-6 is a potentially useful diagnostic marker of pyelonephritis, asymptomatic bacteriuria, and recurrent urinary tract infections; however, a similar assay for the measurement of IL-6 or any other cytokine in the urine of dogs has not been described in the literature.
Urine samples were obtained from a colony of purpose-bred Beagle dogs housed at the College of Veterinary Medicine at North Carolina State University (Raleigh, North Carolina) and from canine-patient urine samples from the Clinical Pathology Laboratory at the Veterinary Teaching Hospital of North Carolina State University. All patient and control urine samples had a chemical examination a performed, as well as refractometer b measurement of USG. Urine samples were centrifuged at 400 × g for 10 min to remove gross sediment before freezing at —80°C in 500–1,000-μl aliquots. Because IL-6 concentrations within the urine samples could provide a confounding variable to not only the optimization of the ELISA but also after the ELISA protocol was developed, samples were tested for baseline concentrations of IL-6, and any samples with measurable cytokine concentrations were removed from the statistical assessment of the optimization. Urine collection was approved by the North Carolina State University Institutional Animal Care and Use Committee.
An indirect chemiluminescent-sandwich ELISA c was optimized for detecting IL-6 concentrations within the urine of dogs. Various goat anti—canine polyclonal IL-6 capture-antibody c concentrations were tested in a range of 200–1,000 ng/ml in 200-ng increments using 3 different coating buffers: 10× phosphate buffered saline (PBS: 1,370 mM sodium chloride, 27 mM potassium chloride, 119 mM potassium dihydrogen phosphate/disodium hydrogen phosphate), d diluted 1:10 in ultrafiltrated water to create 1× PBS (pH 7.4); carbonate-bicarbonate buffer (CBC: pH 8.6; 15 mM sodium carbonate, 35 mM sodium bicarbonate); and CBC (pH 9.5). Two blocking reagents were assessed, including CBC (pH 9.5), containing 3% (wt/vol) instant nonfat dry milk, e and 0.1% (vol/vol) Kathon f ; and CBC (pH 9.5), containing 2% (wt/vol) milk with 1% (wt/vol) bovine serum albumin g (BSA). Biotinylated goat anti—canine IL-6 detection-antibody c concentrations were tested in 2-fold dilutions of 100–12.5 ng/ml. Two reagent diluents were also assessed, including 1 × PBS (pH 7.4), containing 1% (wt/vol) BSA; and 1 × PBS (pH 7.4), containing 1% (wt/vol) BSA and 0.5% (vol/vol) Tween 20 h
Optimal plate coating used 100 μl per well of 800 ng/ml of capture-antibody diluted in CBC (pH 9.5), incubated for 12 hr at 4°C in 96-well plates. i Blocking was performed for 2 hr at room temperature with 205 μl per well of CBC (pH 9.5), containing 3% (wt/vol) instant nonfat dry milk d and 0.1% (vol/vol) Kathon. Background was reduced by incubating 100 μl of 25 ng/ml of detection antibody in the 1 × PBS (pH 7.4), containing 1% (wt/vol) BSA and 0.05% (vol/vol) Tween 20 for 2 hr at room temperature. Previous assay development at the authors' laboratory found that horseradish peroxidase—conjugated streptavidin c (strep-HRP) is optimally used at a 1:200 dilution in chemiluminescent ELISAs (data not shown); therefore, the 1:200 strep-HRP solution was diluted with reagent diluent and incubated for 20 min. Manual washes between each step were performed using a wash solution consisting of 1 × PBS (pH 7.4) with 0.05% (vol/vol) Tween 20. After the addition of 100 μl of luminal/peroxide solutions j in a 1:1 ratio per the manufacturer's recommendations, chemiluminescence was measured using a plate reader k after 1 min and 5 min (Fig. 1). Results were analyzed using commercially available software l to perform a curve fit analysis.
Multiple aliquots of urine from a single urine collection or proprietary sample diluents m (SD1 or SD2) were spiked with 1,000 pg/ml of canine recombinant IL-6 c with 2-fold dilutions to 15.6 pg/ml. One hundred microliters of each sample titration was then added to an equal volume of proprietary assay diluents n (AD1 or AD3) within the ELISA plate. The resultant standard curves and urine curves were compared with each other using quantitative IL-6 recoveries from samples. The 2 diluent combinations with the greatest recoveries, SD1/AD1 and SD2/AD3, were critically compared for optimal IL-6 measurement (n = 4). Standard and sample incubations were performed at 37°C for 2 hr.
Urine pH was measured using pH 5.0–10.0 indicator strips. o Urine from a single collection was divided into 5 aliquots. Urine pH was adjusted by adding 1 N hydrochloric acid or 1 N sodium hydroxide to establish a pH range of 5.5–9.5, increasing in increments of 1 pH unit. Resultant samples were spiked with 4,000 pg/ml of canine recombinant IL-6, and, using 2-fold dilutions, a curve was created to compare the effects of urine pH on the ELISA (n = 2).
Urine specific gravity was measured by refractometry at room temperature. Unique urine samples from different dogs were divided into the following USG ranges: <1.012, 1.014–1.016, 1.017–1.024, 1.027–1.029, and >1.034 (n = 4 for each group). To determine the effects of USG on the ELISA, each of the samples from the 5 groups were spiked with 4,000 pg/ml of canine recombinant IL-6. Two-fold dilutions were performed in AD2/SD3, and curves were compared with a standard curve to calculate quantitative recoveries. All values are reported using the ratio of IL-6 chemiluminescence to nonspecific, background chemiluminescence (n = number of samples used within the comparison). All statistics are reported as the mean ± 1 standard deviation.
Using the canine recombinant IL-6 in reagent diluent, standard curves were established within the range of 4,000 pg/ml decreasing in 2-fold dilutions to 3.91 pg/ml. The limit of IL-6 detection in the assay was between 31.2 and 15.6 pg/ml. Standard curves run in triplicate within a single plate had an intra-assay coefficient of variation average of 2.9 ± 1.8 (n = 3). Identical standard curves compared across plates had an interassay coefficient of variation of 7.7 ± 4.0 (n = 3). In contrast, unique urine samples from multiple dogs spiked with 4,000 pg/ml of canine recombinant IL-6 decreasing in 2-fold dilutions created curves with the coefficient of variation between the urine samples reaching 19.6 ± 3.7 (n = 5). The quantitative recovery of urine IL-6 compared with the standard curve was only 28.6 ± 7% (n = 5) for neat, undiluted samples. Dilutions of the sample to 1:8 with reagent diluent improved the recovery of IL-6 to 54.6 ± 10% (n = 5).
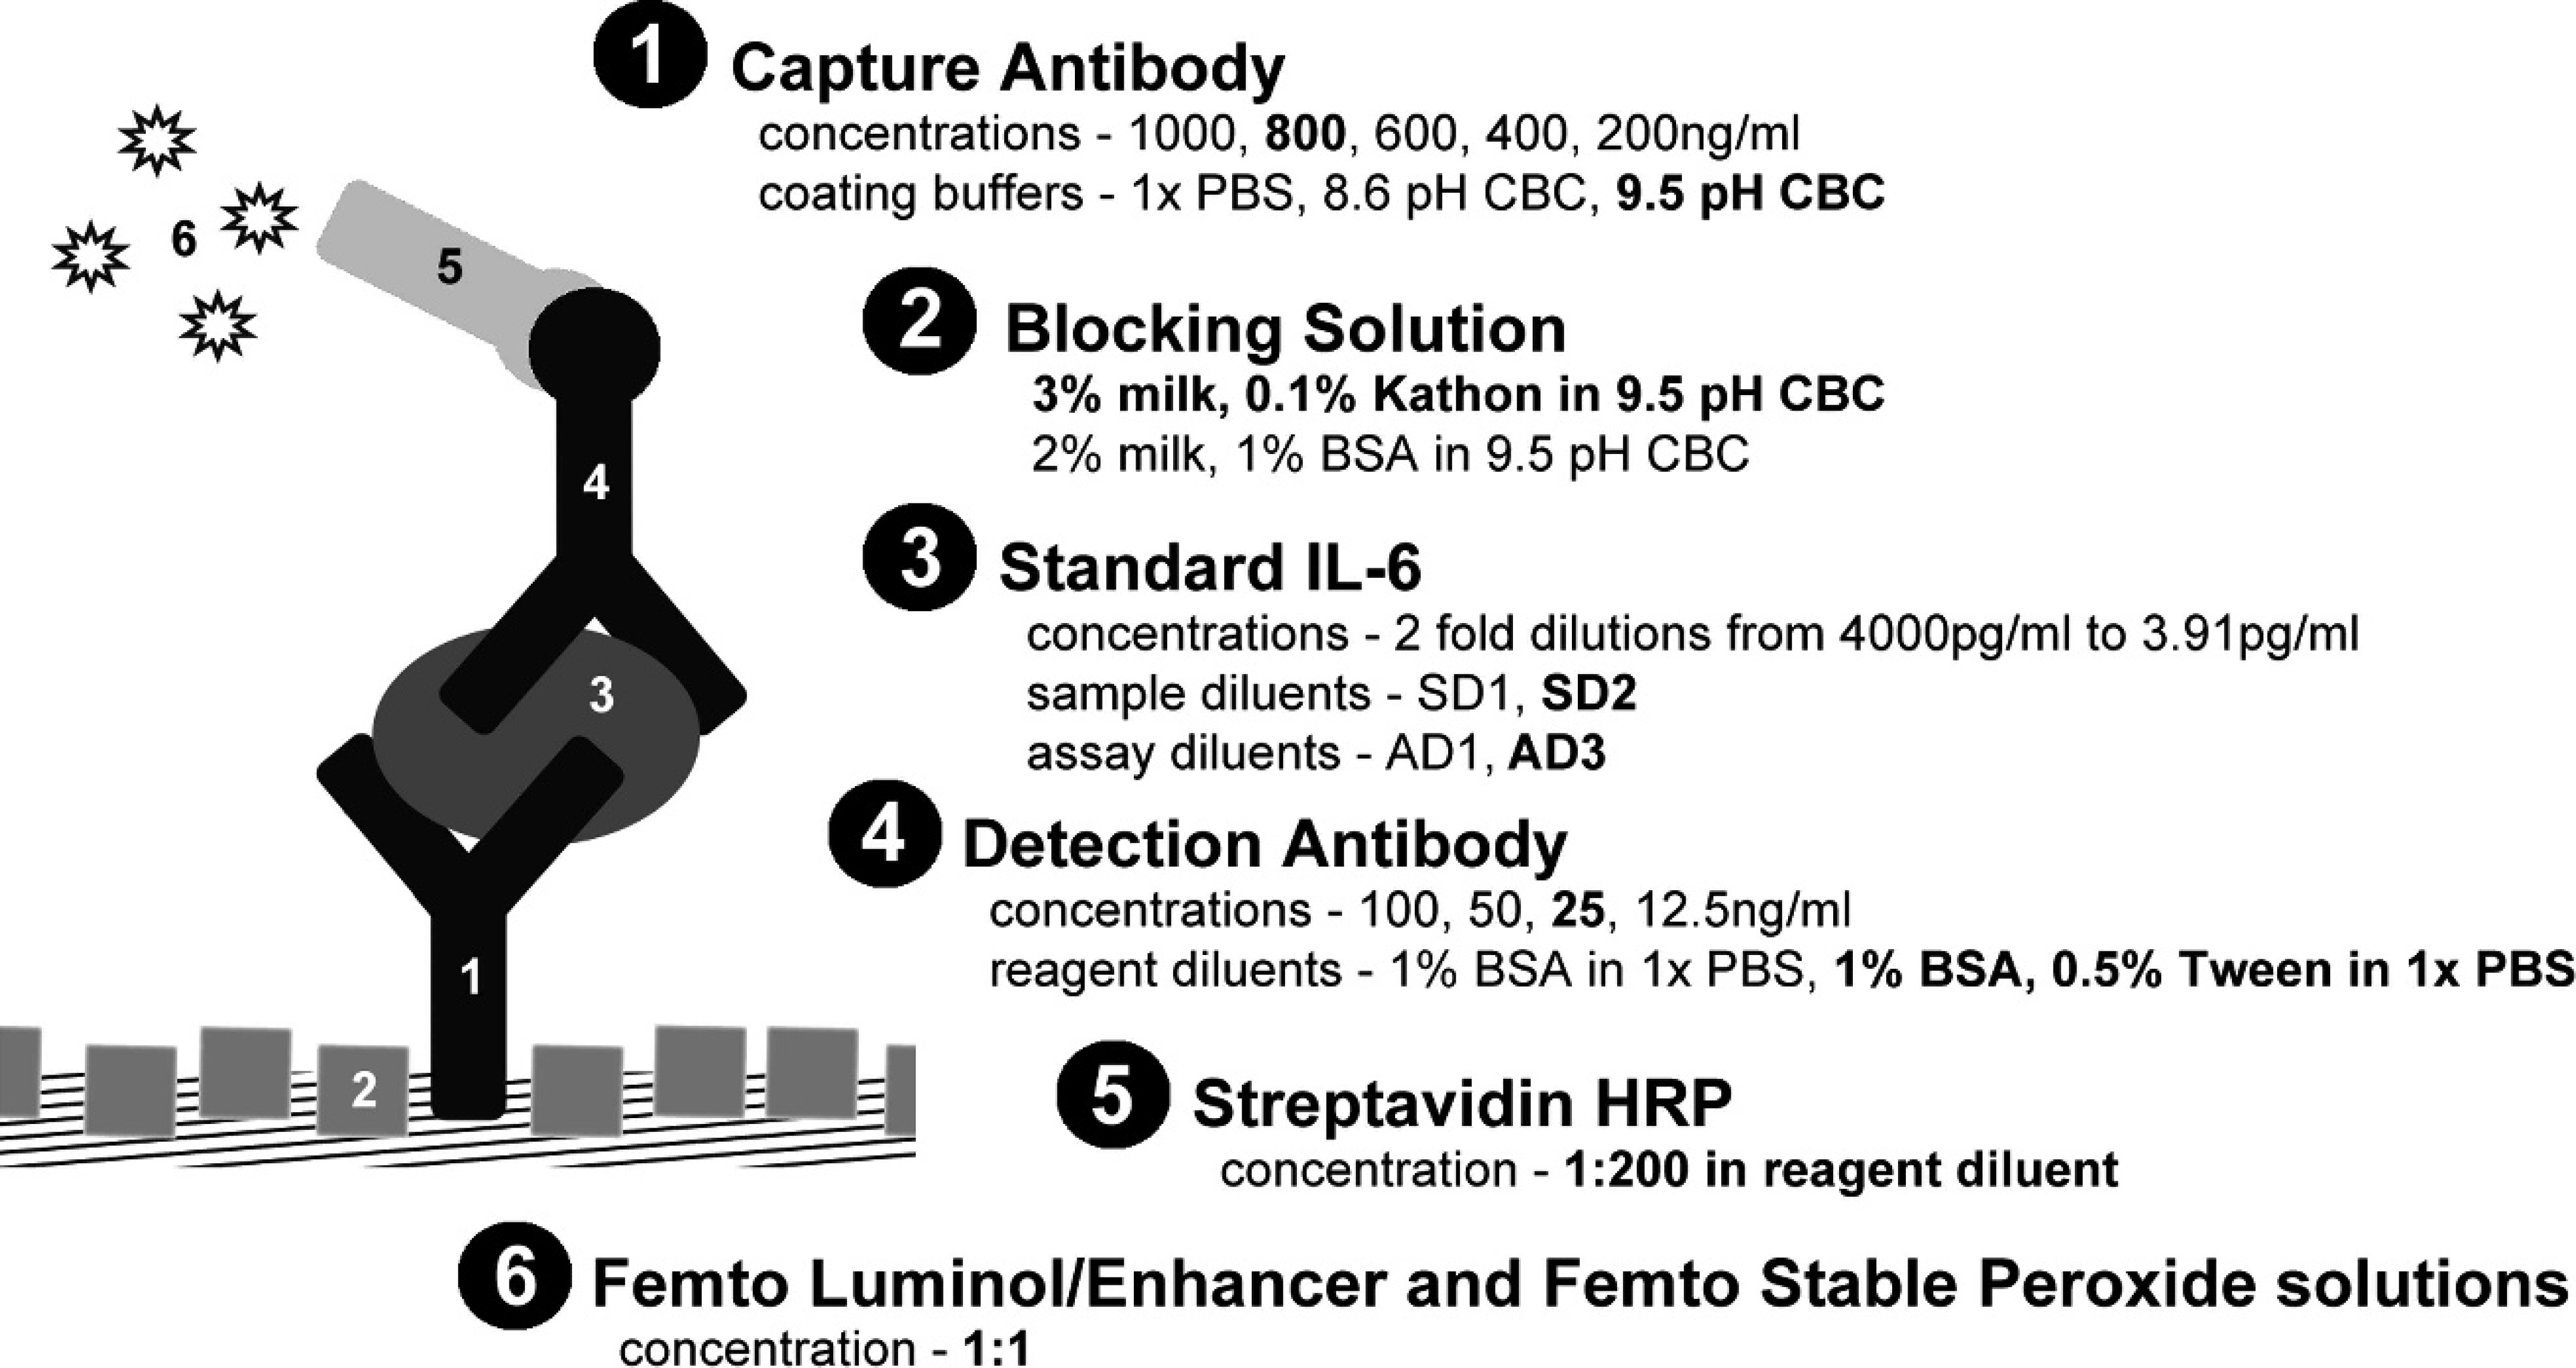
The urine interleukin-6 (IL-6) enzyme-linked immunosorbent assay (ELISA) was optimized by adjusting components of the immunoassay. Conditions that expanded the dynamic range of the ELISA and/or improved quantitative recovery are listed in bold type and were ultimately used in the final optimization.
Accordingly, to neutralize the effects of urine carbohydrates and proteins on antibody—antigen binding within the ELISA, proprietary sample (SD) and assay (AD) diluents were used. The combination of diluents AD3 and SD2 provided the best quantitative recovery. Recovery of IL-6 from spiked unique urine samples increased to 67.8 ± 10% in undiluted samples and reached 90.7 ± 5% at a dilution of 1:8 (n = 7) when compared with the standard curve. Although neutralizing the matrix effects did improve the accuracy of IL-6 detection, an identified compromise was an increase in the limit of detection of IL-6 from 15.6–31.2 pg/ml to 62.5–125.0 pg/ml. Despite the change in the limit of detection of the ELISA, the assay's dynamic range still bracketed the reported concentrations of IL-6 found in the urine of children with urinary tract infection. 5
The large coefficient of variation for measured IL-6 in unique urine samples was an indication that a component of urine that was different from sample to sample was also interfering with the ELISA performance. Variation in urine pH provided a plausible explanation. Examining recovery of IL-6 across a range of urine pH values from 5.5 to 9.5, the measured IL-6 concentrations yielded a coefficient of variation of only 6.8 ± 3.4 across the standard curve (n = 2). These data indicate that changes in urine pH are unlikely to explain large variation in quantitative recoveries of IL-6 between different urine samples.
An alternate explanation is variation in USG. Using unique urine samples, 5 USG groups spanning the range of USGs were constructed: <1.012, 1.014–1.016, 1.017–1.024, 1.027–1.029, and>1.034 (n = 4 per group). Interestingly, as USG increased, the recovery of IL-6 by the ELISA improved. At a USG of <1.012, the quantitative recovery of IL-6 in neat urine was 59.1 ± 3% and increased to 88.6 ± 5% after a 1:8 dilution. In contrast, urine with a specific gravity of>1.030 had a neat quantitative recovery of 71.6 ± 9% and increased to 92.2 ± 5% after a 1:8 dilution. The other USG groups had 1:8 dilution recoveries of 1.014–1.016 (85.9 ± 11%), 1.017–1.024 (89.8 ± 2%), and 1.027–1.029 (91.3 ± 5%). These data support that the large ELISA coefficient of variability is a product of the wide range of USG found among urine samples.
If the variation among urine samples for a given specific gravity was predictable, a correction factor could be used to calculate an approximate IL-6 concentration across a range of USG. To assess the feasibility of establishing a correction factor, urine samples with a USG of 1.015 (n = 4) and 1.028 (n = 4) were spiked with 4,000 pg/ml of IL-6. Variation in recoveries was assessed for neat, 2 ×, 4 ×, and 8 × dilutions. Urine samples with the same specific gravity had an average variation in recovery of 12.9 ± 4 for a USG of 1.015 and 8.8 ± 1 for a USG of 1.028. These data indicate that even for a defined USG, there is enough variation in recovery among samples that a correction factor would remain an estimate. An alternative way to minimize the effect of USG and to improve the coefficient of variation within the assay was to dilute the samples. After diluting the urine 1:8 and comparing all urine samples across the range of USG (<1.012 to >1.034), the coefficient of variation was 6.3 ± 4 (n = 20).
In the current study, the use of proprietary sample and assay diluents increased the quantitative recovery of IL-6 in neat urine samples by more than 100%. These proprietary diluents are designed to reduce nonspecific binding of the matrix and to promote an ionic strength and pH optimal for antigen—antibody interactions. Although no attempt was made to identify the specific protein(s) or carbohydrate responsible for the matrix effect, the urine protein Tamm—Horsfall mucoprotein (THP) has been shown to bind cytokines 11 and plastics in the presence of an extracellular matrix. 8 It is hypothesized that THP or another urine protein may nonspecifically bind IL-6, preventing its binding to the capture antibody. This trapped IL-6 would then be removed from the plate during wash cycles, reducing the detection of IL-6 in the sandwich ELISA below what was actually present in the sample. The use of diluents did have the deleterious effect of increasing nonspecific chemiluminescence. The increased background would contribute to the generation of false-negative diagnostic results in samples with low IL-6 concentrations, particularly after 1:8 dilutions. However, in children with urinary tract infection, IL-6 measured using ELISA had a median concentration of 397 pg/ml, 5 which is above this assay's threshold.
A second factor identified as affecting the urine IL-6 ELISA performance was the variability in USG. This unpredictability was expected because measurement of USG is affected by total solute concentration as well as the molecular size and weight of the various solutes. Hence, urine samples with the same USG will have variable numbers of solutes to interfere with the ELISA. Puzzling was the observation that, as USG increased, IL-6 recovery improved. This observation suggests that, unlike matrix proteins and carbohydrates, the predominant USG solutes (urea, sodium, potassium, and ammonium salts) appear to have a protective effect on IL-6 yield. These solutes present in high USG samples may promote an ionic balance or carrier effect that reduces IL-6 binding to storage and dilution vessel plastics and facilitates an IL-6—antibody interaction that is lacking in more dilute urine samples.
Unfortunately, the unpredictability of the urine solute composition and concentration makes creating an accurate correction factor to account for differences in USG difficult. Published human studies have used an IL-6:creatinine ratio to normalize the variable nature of urine. 7 Such correction may be inappropriate. Creatinine is an estimate of the glomerular filtration rate (GFR), and estimates how GFR is affecting the concentration of filtered urinary solutes. However, urinary concentrations of IL-6 are produced by renal epithelial cells and the cells of the urothelium. 2 Systemic disease processes have little effect on urinary concentrations of IL-6. 4 In addition, the secretion of IL-6 by the urothelium during disease states is not constant. Interleukin-6 is released in a series of peaks during the first 48 hr after infection. 3 Because the rate of IL-6 secretion is variable and independent of the GFR, using the IL-6:creatinine ratio as a correction factor would do little to correct for the effects of urine solutes on the ELISA.
In the present assay, the variability of USG was circumvented by diluting the urine samples 1:8 with SD2. This step decreased variation and increased the accuracy of IL-6 measurements. Given that performing such a dilution may decrease concentrations of IL-6 below the limit of detection of the ELISA, this assay is best used first on undiluted urine samples to establish the presence or absence of IL-6 and then at a dilution of 1:8 to determine a specific urine IL-6 concentration.
Application of the ELISA described in the present report will be useful in determining the utility of IL-6 as a biomarker of pyelonephritis, asymptomatic bacteriuria, and recurrent urinary tract infections. The current study also underscores the importance of identifying and optimizing variables within different body fluids when developing or validating any immunologic assay. This is particularly true for urine, where numerous characteristics, such as the protein matrix, pH, and urine solutes interplay.
Acknowledgements.
Michael Wood is supported by the Ruth L. Kirschstein National Research Service Award T32 RR024394 as part of North Carolina State University's Comparative Medicine and Translational Research Training Program.
Footnotes
a.
Multistix reagent strips, Bayer, Shawnee Mission, KS.
b.
Schuco clinical refractometer, Erma Inc., Tokyo, Japan.
c.
Canine IL-6 DuoSet, R&D Systems, Minneapolis, MN.
d.
10 × Phosphate buffered saline, Fisher Scientific Co., Pittsburgh, PA.
e.
Carnation® nonfat dry milk, Nestlé USA Inc., Glendale, CA.
f.
Kathon, Supelco Inc., Bellefonte, PA.
g.
Bovine serum albumin, Equitech-Bio Inc., Kerrville, TX.
h.
Tween 20, Thermo Fisher Scientific Inc., Waltham, MA.
i.
Chromalux™ 96-well HB plates, DYNEX Technologies Inc., Chantilly, VA.
j.
SuperSignal® ELISA Femto Luminol/Enhancer, SuperSignal® ELISA Femto stable peroxide solutions, Pierce Biotechnology Inc., Rockford, IL.
k.
Wallac Victor![]() -104063871102300219" href="#bibr3-104063871102300219" id="a-41">
3
reader, PerkinElmer Inc., Waltham, MA.
-104063871102300219" href="#bibr3-104063871102300219" id="a-41">
3
reader, PerkinElmer Inc., Waltham, MA.
l.
Prism 4 software, GraphPad Software Inc., La Jolla, CA.
m.
Sample diluents SD1, SD2, SD3, ImmunoChemistry Technologies LLC, Bloomington, MN.
n.
Assay diluents AD1, AD2, AD3, AD4, ImmunoChemistry Technologies LLC, Bloomington, MN.
o.
colorpHast® pH 5.0–10.0 pH indicator strips, EMD Chemicals Inc., Gibbstown, NJ.