
Abstract
The effectiveness of molecular methods for the detection of species of Giardia and Cryptosporidium in fecal samples is often reduced by low or intermittent cyst and oocyst shedding, and/or the presence of polymerase chain reaction (PCR) inhibitors. The present study investigates the use of immunomagnetic separation (IMS) as an additional concentration step before PCR in the detection of these common protozoan parasites in dairy cattle. The IMS-PCR assays were optimized for amplifying fragments of the 16S ribosomal RNA (rRNA), β-giardin, and glutamate dehydrogenase (GDH) genes of Giardia duodenalis, as well as fragments of the 18S rRNA, heat shock protein (HSP)-70, and Cryptosporidium oocyst wall protein (COWP) genes of Cryptosporidium spp. In all cases, IMS-PCR was more sensitive than PCR alone. A significantly greater number of Giardia–positive samples were identified using IMS-PCR of the 16S rRNA gene (P < 0.01) and of the GDH gene (P < 0.01), as compared with PCR without any additional concentration step. In the case of Cryptosporidium, IMS-PCR of the COWP gene (P = 0.02) resulted in a significantly greater number of positives than did PCR without the IMS concentration step. The greatest number of positives, however, was obtained using IMS-PCR to amplify a portion of the 16S rRNA gene of Giardia and a portion of the HSP-70 gene of Cryptosporidium. A further comparison of the optimized IMS-PCR assays to immunofluorescence microscopy suggested that the IMS-PCR assays were considerably more sensitive than microscopy was in the detection of Giardia cysts and Cryptosporidium oocysts in fecal samples.
Introduction
Detection of the protozoan parasites Giardia and Cryptosporidium in clinical samples is often based on an initial fecal flotation to concentrate cysts and oocysts, followed by microscopic examination of a direct fecal smear, or by acid-fast staining (cryptosporidiosis) or Lugol iodine staining (giardiasis). Immunofluorescence microscopy, which uses labeled monoclonal antibodies, is generally more sensitive than conventional microscopy, but because of higher costs, it is often limited to research laboratories. One major disadvantage of these microscopic methods is the limit of detection of cysts and oocysts per gram of feces, largely because the cysts and oocysts are not shed with the feces on a consistent basis, and their numbers can vary from day to day. 24 Relatively low numbers of cysts and oocysts are a particular problem in adult cattle because of the dilution effect of the large volumes of manure produced by these animals. Furthermore, neither Giardia nor Cryptosporidium can be enriched or easily cultured. 7,27,32
More recently, many studies have used molecular methods for the detection of Giardia and Cryptosporidium in fecal samples. In particular, polymerase chain reaction (PCR) has been used to amplify fragments of various genes to enable the detection of parasite DNA. Like microscopy, PCR may have limited sensitivity in samples containing small numbers of cysts or oocysts, largely because of the presence of PCR inhibitors. The increasing interest in rapid diagnostic testing for these parasites has necessitated the development or optimization of methods that are acceptable in terms of sensitivity and specificity. The use of additional concentration steps for Giardia cysts and Cryptosporidium oocysts is one approach to this optimization. Although immunomagnetic separation (IMS) has been used for some time as a secondary concentration step in processing water samples for Giardia and Cryptosporidium testing, it has only rarely been used in clinical sample analyses. 11,19,33 For example, IMS was used in the recovery of Cryptosporidium in seeded feces from cattle using both microscopy and PCR. 34 Immunomagnetic separation not only concentrates cysts and oocysts but also removes inhibitors that can interfere with detection methods, particularly PCR. 10,12,13,15 A 2000 study 16 reported that IMS enhanced the sensitivity of a PCR assay for Cryptosporidium in water samples by reducing PCR inhibition.
The objective of the current study was to optimize IMS-PCR assays and to evaluate the effectiveness of IMS as an additional concentration step in the detection of Giardia and Cryptosporidium in clinical samples. In particular, dairy cattle fecal samples collected from a farm near Brockville, Ontario, Canada, as well as from Kemptville College, in Kemptville, Ontario, Canada, were tested for the presence of Giardia duodenalis and Cryptosporidium spp. Fragments of the 16S ribosomal RNA (rRNA), β-giardin, and glutamate dehydrogenase (GDH) genes of G duodenalis, as well as fragments of the 18S rRNA, heat shock protein (HSP)-70, and Cryptosporidium oocyst wall protein (COWP) genes of Cryptosporidium spp., were amplified by PCR from fecal samples to determine the optimal genes for PCR detection. A further comparison of the optimized IMS-PCR assays to immunofluorescence microscopy was also performed to determine the relative sensitivity of these methods in the detection of Giardia and Cryptosporidium.
Materials and methods
Source and collection of specimens
Feces were collected from 84 Holstein cattle, including 46 adult cows, 6 heifers (12–24 months old), and 32 calves (females and males, 2–6 months old) at a dairy farm in Brockville, Ontario, Canada, and from 59 male Holstein calves (11–92 days of age) from Kemptville College in Kemptville, Ontario, Canada (total 143 fecal samples). The farm in Brockville was sampled once in May 2005, whereas Kemptville College animals were sampled in 2 groups: 1 group of 29 animals in May 2005, and 1 group of 30 animals in July 2005. At the farm in Brockville, animals were confined to large pens with cement floors fully covered by a roof, whereas the Kemptville College calves were individually housed in hutches.
Feces were collected directly from the rectum of each animal and transferred into a plastic cup. Cups were capped, labeled with the animal's ear tag number, and immediately placed into an insulated container packed with ice or cold packs. Specimens were kept refrigerated and were processed within 1–3 days of collection.
Sucrose flotation of cysts and oocysts
Cysts and oocysts were concentrated from fecal samples using a previously described sucrose flotation technique with the following modifications. 25 To 5 g of feces from calves, or to 20 g of feces from adults, 10 ml (35 ml for adult samples) of phosphate buffered saline (PBS) was added, followed by thorough mixing on a vortex. The suspension was passed through 4 layers of gauze, and layered over 5 ml (15 ml for samples from adults) of 1 M sucrose solution (specific gravity 1.13) in a clean tube. The samples were centrifuged at 800 × g for 5 min. Following centrifugation, and using a disposable pipette, the interface and the upper layer of the liquid was transferred to a clean tube and recentrifuged at 800 × g for 5 min. The supernatant was decanted, leaving a final pellet volume of 1 ml.
To keep the cyst and oocyst concentrations as similar as possible among adult and calf samples, the volumes of fecal material were adjusted. Because adults produce a larger amount of feces than do calves and, therefore, the concentration of cysts and oocysts may be lower, the amount of fecal material used from adults for the first step in concentrating both Giardia and Cryptosporidium was increased proportionally.
Immunofluorescence microscopy
After cyst and oocyst isolation and concentration, a 20-μl sample of the concentrate was spotted onto a microscope slide a and air-dried. Giardia-specific and Cryptosporidium–specific fluorescein isothiocyanate–labeled monoclonal antibody solutions b (20 μl each) were applied to the slide, which was then incubated in a humidified air chamber at room temperature for 45 min. After incubation, the slide was briefly rinsed with PBS and sealed with a glass coverslip. Giardia cysts and Cryptosporidium oocysts were examined and enumerated under an epifluorescence microscope c at 200 × magnification. The number of cysts and oocysts per gram of feces was calculated using the following modification of a previously described 25 formula:

where N is the number of cysts or oocysts per gram feces, s is number of cysts or oocysts counted on the slide, pv is the pellet volume (1 ml), vol is the volume of sample examined (0.02 ml), and wt is the weight of the fecal sample.
Immunomagnetic separation and DNA extraction
A magnetic bead separation kit d was used for all IMS reactions, using the manufacturer's protocol, with the following modifications. Each IMS reaction (1 ml) was composed of 200 μl of concentrated sample, 100 μl of 10 × SL-Buffer A, 100 μl of 10 × SL-Buffer B, 50 μl each of anti-Giardia and anti-Cryptosporidium magnetic beads, and 500 μl of double-distilled water. Flat-top, 1.5-ml micro-centrifuge tubes containing the IMS components were then affixed to a rotating mixer d and were rotated at 19 rpm for 1 hr at room temperature. After rotation, tubes were placed in the magnetic particle concentrator d and gently rocked by tilting the cap end and the base end of the tube up and down in turn for 2 min. The cap was then removed, and all the supernatant from the tube held in the particle concentrator was decanted. Tubes were then removed from the particle concentrator, and samples were resuspended in 1 ml of 1 × SL-Buffer A, mixed gently and again placed into the particle concentrator and gently rocked for 1 min. This wash step was then repeated twice. The dissociation of cysts/oocysts was performed by removing the tubes from the particle concentrator and adding 50 μl of 0.1 N hydrochloric acid to the microcentrifuge tube, followed by vortexing thoroughly for 10 sec. Tubes were then placed in the particle concentrator without the magnet for 10 min at room temperature and then vortexed again for 10 sec (before the magnetic strip was replaced), allowing the now dissociated beads to be removed from suspension. The supernatants were aspirated by using plugged Pasteur pipettes and were transferred into clean 1.5-ml microcentrifuge tubes containing 5 μl of 1 N sodium hydroxide to neutralize the suspension (resulting in a final volume of 55 μl). Total DNA was extracted from each sucrose flotation-concentrated sample, as well as from each IMS-concentrated sample, using a commercial kit e with a slightly modified protocol as previously described. 5
Primers, polymerase chain reaction (PCR) mixes, and conditions used for the detection of Giardia duodenalis and Cryptosporidium species in dairy-cattle fecal samples.*
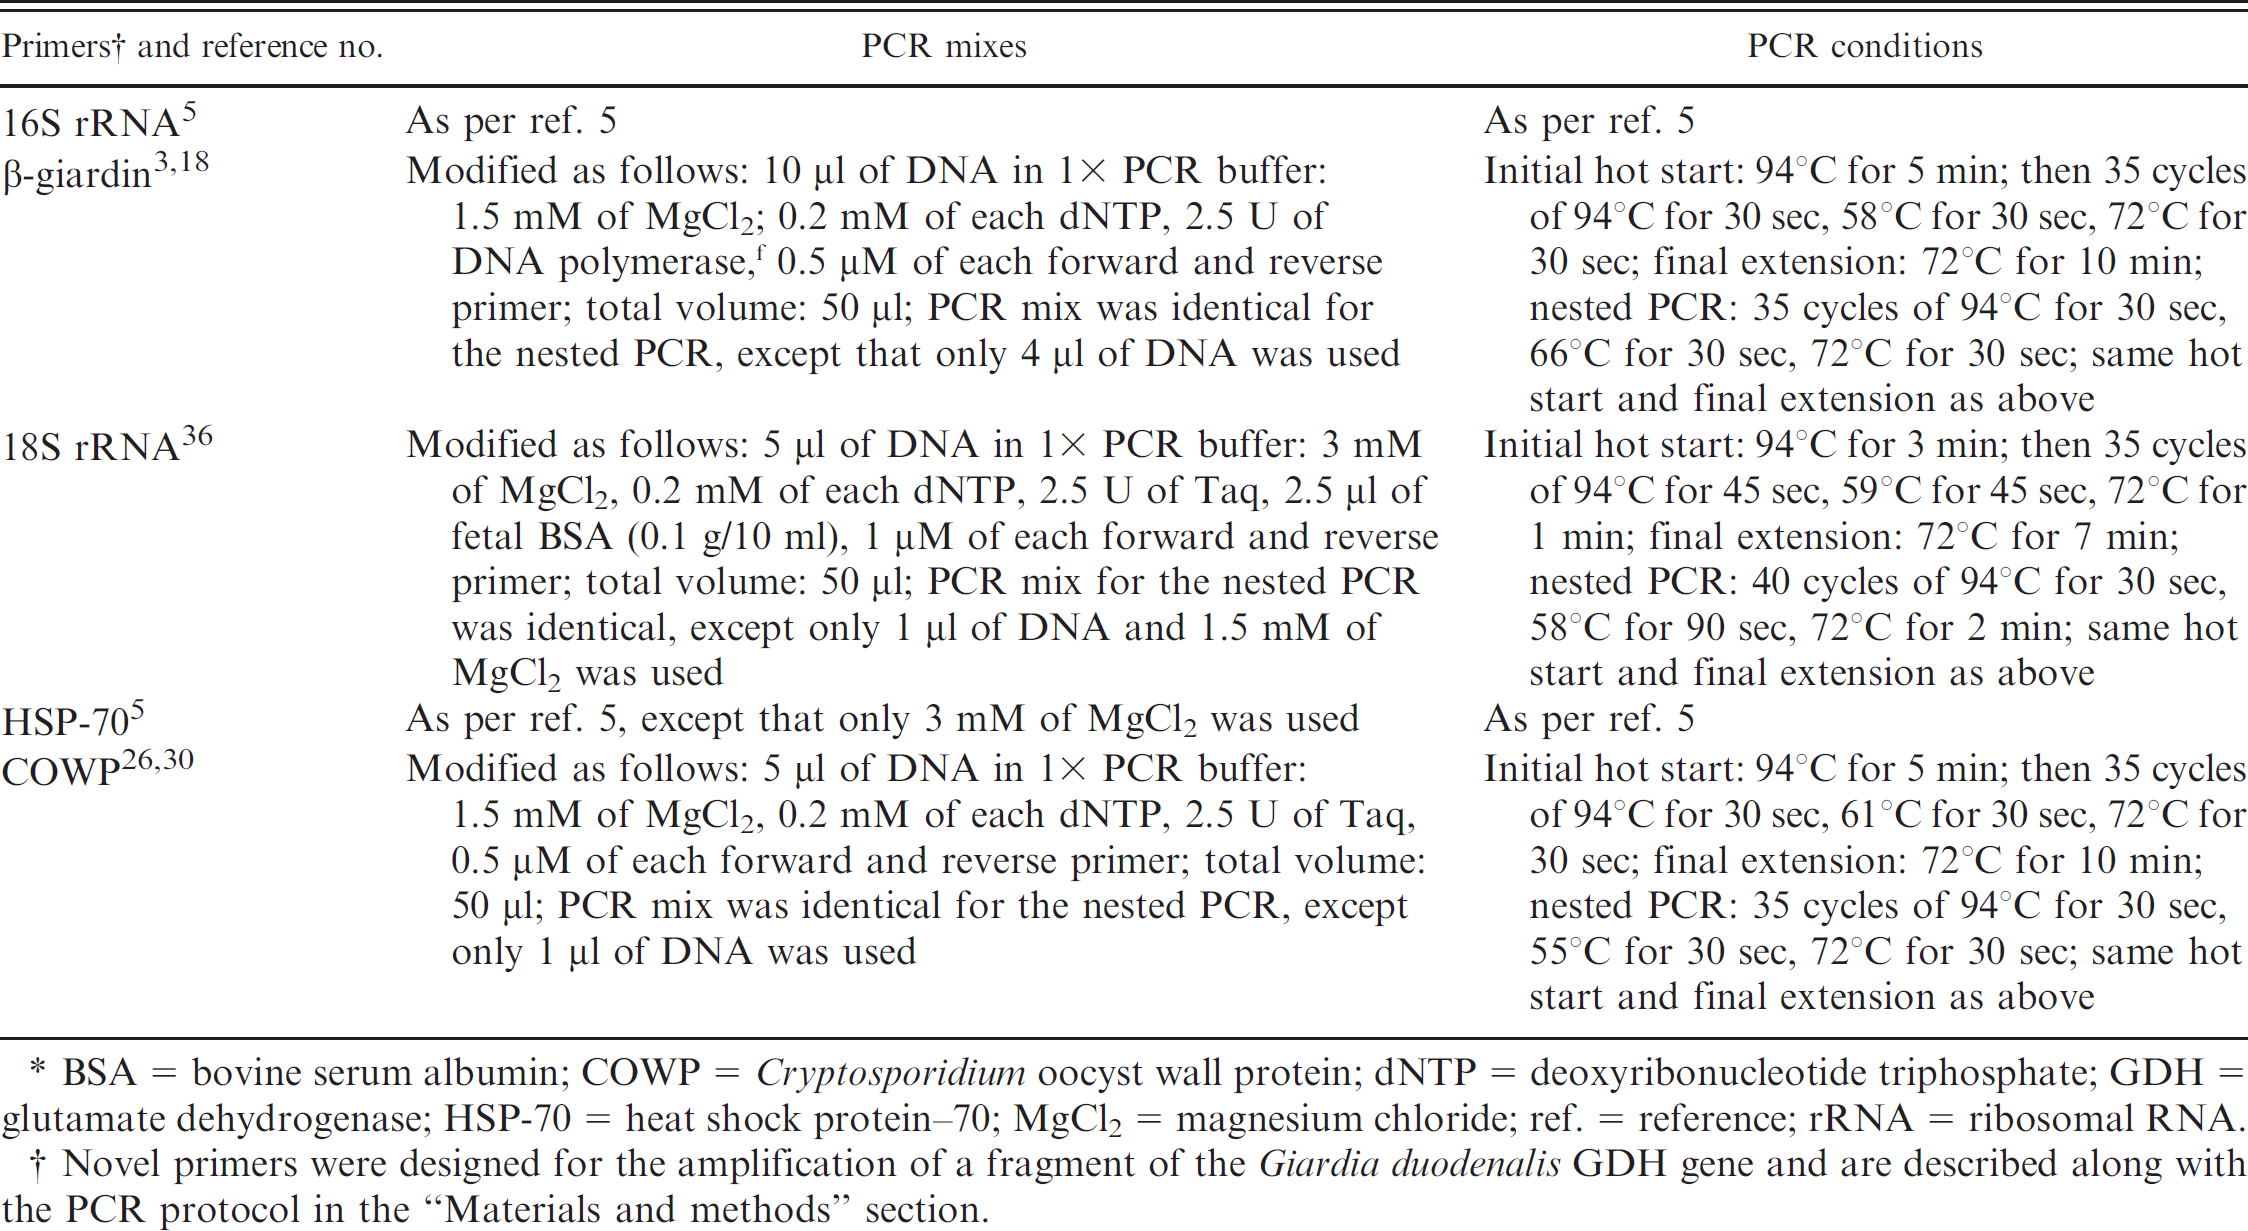
BSA = bovine serum albumin; COWP = Cryptosporidium oocyst wall protein; dNTP = deoxyribonucleotide triphosphate; GDH = glutamate dehydrogenase; HSP-70 = heat shock protein–70; MgCl2 = magnesium chloride; ref. = reference; rRNA = ribosomal RNA.
Novel primers were designed for the amplification of a fragment of the Giardia duodenalis GDH gene and are described along with the PCR protocol in the “Materials and methods” section.
Polymerase chain reaction
Two-step nested PCR protocols were used to amplify portions of the 16S rRNA and β-giardin genes of Giardia. References for these protocols and the modifications incorporated are shown in Table 1. Novel primers were designed for the amplification of a fragment of the Giardia GDH gene. From the National Center for Biotechnology Information database, sequence information was obtained for a representative isolate of each of the assemblages (GenBank accessions L40509 [AI], L40510 [AII], AF069059 [BIII], L40508 [BIV], U60984 [C], U60986 [D], and U47632 [E]). 8,20–22 Using ClustalW software, 31 the sequences were aligned and analyzed for similar regions across all assemblages. New primers were designed using genome and sequence analysis software. g To yield a 389-base pair (bp) fragment of the GDH gene, the forward primer GiaTCF (5′-CGCTTCCACCCCTCTGTC-3′) and the reverse primer GiaTCR (5′-TCCTTGCACATCTCCTC-3′) were used. The PCR amplification was performed in 50-μl volumes with 10 μl of DNA in 1 × PCR buffer (1.5 mM MgCl2), 0.2 mM each deoxyribonucleotide triphosphate, 2.5 U of DNA polymerase, f and 1 μM of each forward and reverse primer. A total of 35 cycles, each consisting of 95°C for 30 sec, 65°C for 30 sec, and 72°C for 30 sec, were performed with an initial hot start at 95°C for 5 min and a final extension step at 72°C for 10 min. The PCR mix and temperature conditions for the nested PCR were the same as above, except only 4 μl of DNA was used.
For Cryptosporidium, 2-step nested PCR protocols were used to amplify portions of the 18S rRNA, HSP-70, and COWP genes. References for these protocols and the modifications incorporated are shown in Table 1. In all cases, PCR products were analyzed on 1% (wt/vol) agarose gels and visualized by ethidium bromide staining.
In the present study, PCR testing was done only once on most of the samples because of the relatively large number of samples collected and the need to extract and analyze samples when they were as fresh as possible. The only samples that were repeated numerous times were the positive control samples. Approximately 20 samples were used as positive controls on numerous runs, and the repeatability of the results was always high.
Determination of the sensitivity and specificity of the PCR methods
To determine the sensitivity of the PCR methods used to detect Giardia cysts and Cryptosporidium oocysts in the present study, bovine feces were obtained from a calf found to be negative for giardiasis and cryptosporidiosis. Fourteen replicate 5-g fecal specimens were each spiked with cysts of G. duodenalis and oocysts of C. parvum at the rate of 1, 10, 100, 1,000, 10,000, or 100,000 cysts and oocysts per gram and were subjected to the same methods of concentration and molecular detection as described above. To determine the specificity of the PCR method using the novel designed primers for the Giardia GDH gene, the DNA of Cryptosporidium, Cyclospora, Shigella, and Aeromonas species were tested, and only Giardia species were detected with the novel primers.
Statistical analysis
All analyses were performed using a statistical software package. h A McNemar test was performed to test marginal homogeneity of the number of positive samples obtained by PCR, with and without IMS, for each gene tested. When the sum of the discordant counts were ≤ 10, an exact test based on the binomial distribution with P = 0.5 was performed.
Results
For both Giardia and Cryptosporidium, and with all genes tested, IMS-PCR was more sensitive than was PCR alone (Table 2). The IMS-PCR assay identified significantly more Giardia-positive samples than PCR alone did for both the 16S rRNA (P < 0.01) and the GDH (P < 0.01) genes. The use of IMS resulted in 64 positive samples (44.8%) when using primers directed against 16S rRNA, whereas only 32 samples (22.4%) were identified as positive by the same PCR without IMS. The 16S rRNA primers were the most sensitive in the PCR assay because the β-giardin IMS-PCR assay resulted in only 12 (8.4%) and 11 (7.7%) positive results when using PCR alone. The third gene used in testing for Giardia, GDH, also resulted in significantly more positive results (27; 18.9%) in the IMS-PCR assay than it did in the PCR assay without IMS, which resulted in only 9 (6.3%) positive results (Table 2).
In the case of Cryptosporidium, IMS-PCR and PCR alone resulted in 43 (30.1%) and 42 (29.4%) positive results, respectively, when using primers directed against the 18S rRNA gene (Table 2). Although the greatest number of positive results, 60 (42.0%), was obtained when using primers directed against the HSP-70 gene following IMS, PCR alone resulted in 58 (40.6%) positive samples. The COWP gene was almost as sensitive, with 56 (39.2%) and 45 (31.5%) positive results in the IMS-PCR assay and PCR alone, respectively (Table 2). When the McNemar test was performed on the Cryptosporidium results, IMS-PCR was significantly more sensitive than was PCR alone for the COWP gene only (P = 0.02).
The incidence of Giardia cysts and Cryptosporidium oocysts in cattle fecal samples as determined by amplifying fragments of different genes using both immunomagnetic separation (IMS) and polymerase chain reaction (PCR) and PCR alone.*
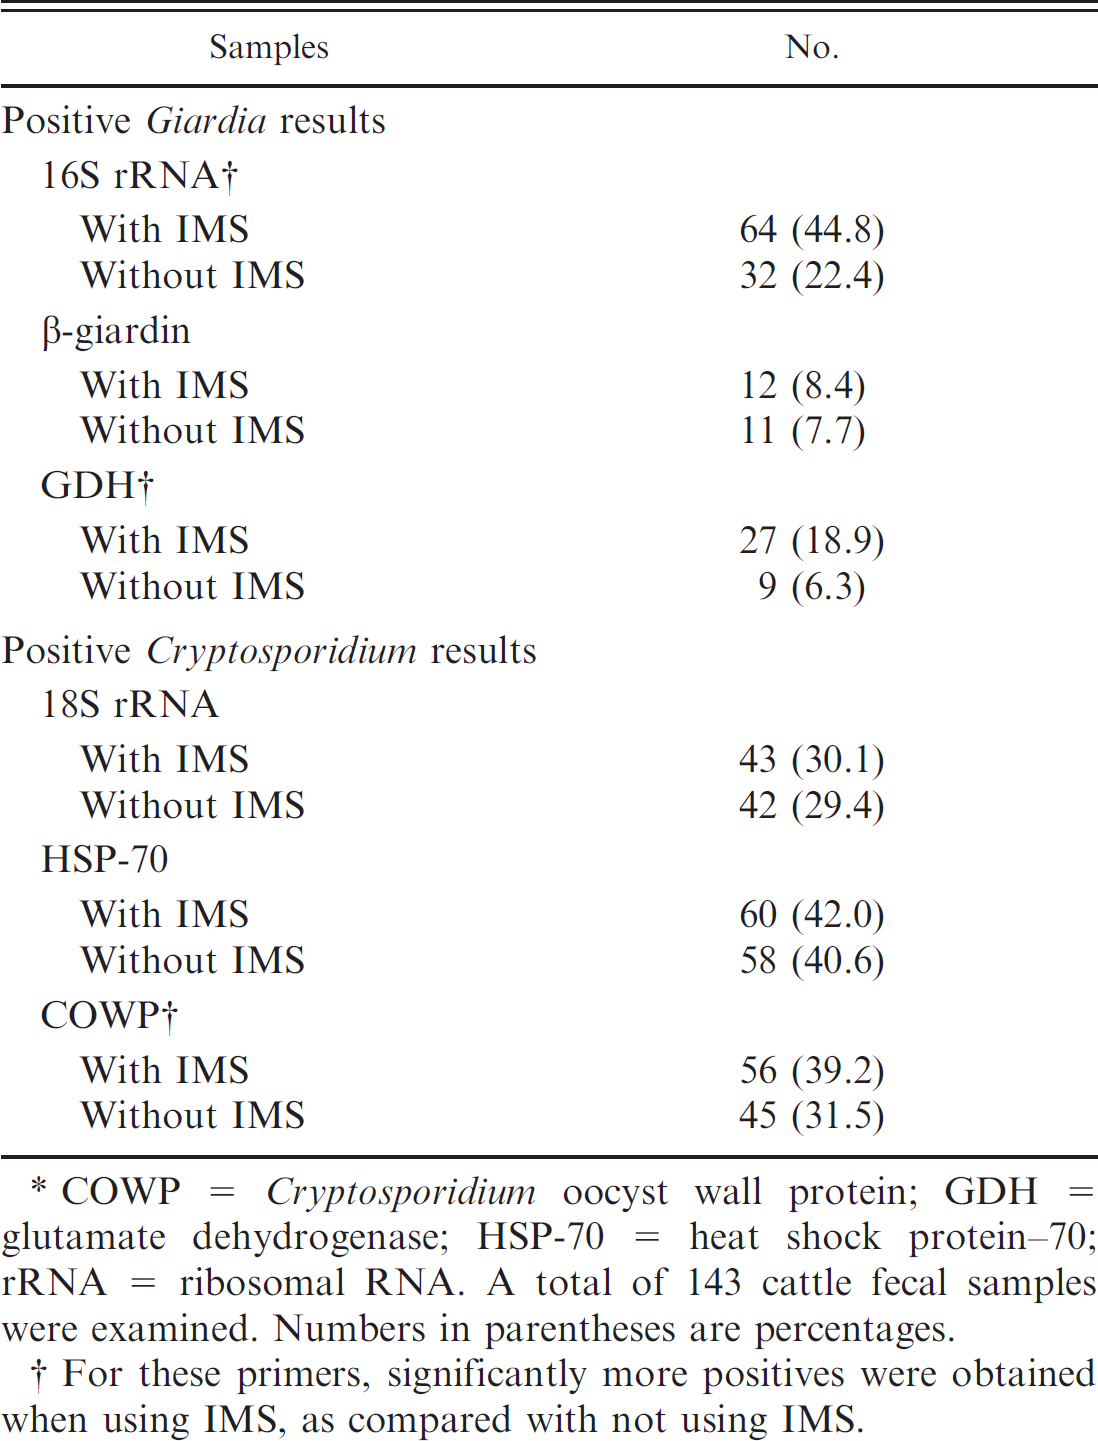
COWP = Cryptosporidium oocyst wall protein; GDH = glutamate dehydrogenase; HSP-70 = heat shock protein–70: rRNA = ribosomal RNA. A total of 143 cattle fecal samples were examined. Numbers in parentheses are percentages.
For these primers, significantly more positives were obtained when using IMS, as compared with not using IMS.
There was good correlation among the different gene loci used in the present study on which samples were positive, although less-sensitive genes (e.g., GDH) occasionally picked up positive samples that tested negative by the more sensitive genes, justifying the use of multiple genes in surveillance studies for Giardia and Cryptosporidium. For Giardia, there were 11 samples that were positive by the IMS-PCR assay for the GDH gene, which is a species-specific marker, but which was missed by the other 2 genes. For Cryptosporidium, there were also samples that were positive by the less-sensitive genes and that were missed by the most-sensitive (COWP) test. For HSP-70 sinthe IMS, PC samples were positive, whereas the same samples tested negative by COWP IMS. When HSP-70 was used without IMS, 10 samples tested positive, whereas they were all negative by COWP without IMS. For the 18S rRNA gene with IMS, 4 samples, which tested positive, were negative by COWP IMS, whereas for 18S rRNA without IMS, 1 sample tested positive, whereas the same sample was negative by COWP without IMS. In addition, most of the fecal samples mentioned above that were from adult cattle (6 samples for HSP-70 with IMS, 5 for HSP-70 without IMS, and 2 for 18S rRNA with IMS) were identified as positive for Cryptosporidium by the less-sensitive genes, whereas in calves there was a 100% correlation among the less-sensitive and the most-sensitive genes.
Out of 52 adults, including 46 adults and 6 heifers, 19 (13.3%) and 8 (5.6%) samples tested positive for Giardia 16S rRNA with and without IMS, respectively. For the GDH gene with and without IMS, results were 7 (4.9%) and 1 (0.7%), respectively. For the β-giardin gene with and without IMS, results were 3 (2.1%) and 1 (0.7%), respectively. For Cryptosporidium, results among adult cattle were very similar. For the 18S rRNA gene with and without IMS, results were 4 (2.8%) and 1 (0.7%), respectively. For the HSP-70 with and without IMS, results were 8 (5.6%) and 6 (4.2%), respectively, whereas for the COWP with and without IMS, results were 11 (7.7%) and 2 (1.4%), respectively.
In calves, the Giardia prevalence rates were as follows. For the 16S rRNA gene with and without IMS, results were 45 (31.5%) and 24 (16.8%), respectively; for the GDH gene with and with IMS, 20 (14%) and 8 (5.6%), respectively; and for β-giardin with and without IMS, 9 (6.3%) and 10 (7%), respectively. For Cryptosporidium, results for the 18S rRNA gene with and without IMS, results were 39 (27.3%) and 41 (28.7%), respectively; for the HSP-70 with and without IMS, 52 (36.4%) and 52 (36.4%), respectively; and for the COWP with and without IMS, 45 (31.5%) and 43 (30.1%), respectively. Out of 60 animals that tested positive for Cryptosporidium by HSP-70 with IMS in the present study, 52 (86.7%) positive results were from calves.
From the spiking experiments, the detection limits of the IMS-PCR methods were found to be 100 Giardia cysts or 100 Cryptosporidium oocysts per gram of feces for the small subunit rRNA genes, whereas the detection limits for all other genes were between 1,000 and 10,000 per gram. Without IMS concentration, the detection limits of the PCR methods were 100,000 cysts or oocysts per gram, or greater, for all loci.
The number of fecal samples that had positive findings for Giardia and Cryptosporidium was considerably lower by microscopy than it was by IMS-PCR using the optimal loci. Of the 143 cattle fecal samples examined by immunofluorescence microscopy, only 36 (25.2%) and 30 (21.0%) were positive for Giardia cysts and Cryptosporidium oocysts, respectively (Table 3). Giardia cysts appeared as bright-green, oval-shaped bodies, easily detectable, even in concentrated fecal debris. Cryptosporidium oocysts were visible as bright-green, round bodies, but their smaller size, as compared with the Giardia cysts, made them more difficult to identify.
The incidence of Giardia cysts and Cryptosporidium oocysts in cattle fecal samples found by using immunofluorescence microscopy, as compared with those found by immunomagnetic separation polymerase chain reaction (IMS-PCR).*
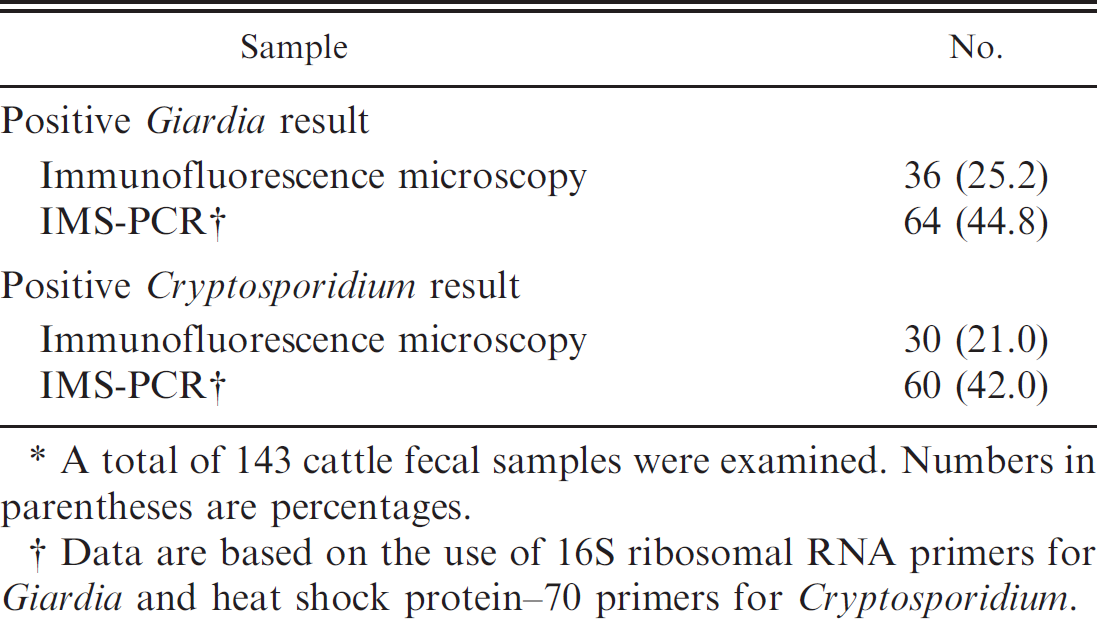
A total of 143 cattle fecal samples were examined. Numbers in parentheses are percentages.
Data are based on the use of 16S ribosomal RNA primers for Giardia and heat shock protein–70 primers for Cryptosporidium.
Discussion
Preliminary work in the authors' laboratory suggested that to maximize the sensitivity of a PCR assay, a second concentration step, after flotation, may be necessary because of the relatively low numbers of Giardia cysts and Cryptosporidium oocysts shed by adult cattle or because of the intermittent shedding of cysts and oocysts in cattle feces. In addition to concentrating cysts and oocysts, and thus allowing for more target DNA to be extracted, IMS is also effective in removing PCR inhibitors, such as bilirubin, bile salts, and complex polysaccharides, from fecal debris. 23,35 Together, the concentration and “cleaning” capabilities of IMS are likely responsible for the overall improvement seen in the present study in the sensitivity of PCR assay in detecting Giardia and Cryptosporidium. Overall, the difference between IMS-PCR and PCR alone was particularly pronounced in the detection of Giardia, where the number of positive samples was significantly higher with IMS-PCR than it was with PCR alone for both 16S rRNA and GDH genes. For Cryptosporidium, a significant improvement in PCR detection using IMS was seen with the COWP gene.
Polymerase chain reaction amplification of fragments of 3 different genes was tested in the present study for the detection of both Giardia and Cryptosporidium in cattle fecal samples. In addition to highly conserved target genes, such as small subunit rRNA and HSP-70, which have been widely used as diagnostic markers, genes that were unique to Giardia (β-giardin) and Cryptosporidium (COWP) were selected, and novel primers for the amplification of the Giardia GDH gene were designed. As genetic markers differ in their information content, highly conserved coding regions should be analyzed to detect genera and species, whereas the identification of genotypes and subtypes often requires more discriminatory fingerprinting techniques. 4 This may help to explain why some primers directed against certain gene loci are more sensitive than others in the detection of Giardia and Cryptosporidium. For example, the use of the IMS-PCR assay with primers directed against the HSP-70 gene was more sensitive than the IMS-PCR assay with the other primers used for Cryptosporidium detection, although the COWP gene resulted in almost as many positive samples. For Giardia, the IMS-PCR assay using primers directed against the 16S rRNA gene was considerably more sensitive than were the assays using other genes. The HSP-70 PCR for Cryptosporidium and the 16S rRNA PCR assays for Giardia detected more positive samples because they are both highly conserved genetic markers. The PCR assays that targeted the variable genetic markers included COWP, β-giardin, and GDH, all of which are species-specific markers. The current study demonstrates that the use of multiple genetic markers, both conserved and variable, increases the chances of detecting Giardia and Cryptosporidium in cattle fecal samples.
Interestingly, most of the samples from adult cattle that tested positive in the present study were identified through the amplification of genes that were less sensitive overall. This may suggest that such genes may be preferable when studies on adult cattle are conducted. On the other hand, there was a complete correlation among the less-sensitive and the most-sensitive genes in detecting Cryptosporidium in calves.
Overall, most animals found to be harboring Cryptosporidium in the present study were young. Out of 60 animals in the present study that tested positive for Cryptosporidium by HSP-70 with IMS, 52 (86.7%) positive results were from calves. The presence of Cryptosporidium oocysts in calf feces is very common, and the oocysts are often present in high numbers. 1,2,6,9,11,14,17,28,29 This is likely the reason why the PCR method alone was effective for Cryptosporidium, and why, compared with Giardia, there was a smaller difference between the number of positives obtained by the IMS-PCR assay versus PCR assay alone. In fact, in the present study, the actual number of cattle infected with both Giardia and Cryptosporidium was most likely underestimated because the animals were sampled only once. It is known that both Giardia and Cryptosporidium are shed intermittently in feces, and, in some instances, it is necessary to examine more than 1 fecal sample to demonstrate infection.
The percentage of adults that tested positive was significantly lower than the percentage of calves that tested positive for both pathogens. The reasons for this most likely include the developed immunity in adults and the greater volume of fecal material and the intermittent shedding of cysts and oocysts by adults.
Immunofluorescence microscopy, using fluorescein-labeled anti-Giardia and anti-Cryptosporidium antibodies provides an improvement in the sensitivity of the detection of cysts and oocysts among fecal debris over conventional microscopy. However, this method is still time-consuming and of limited sensitivity, especially if the concentration of cysts and oocysts is low. With microscopy, in addition to the processing of the samples and the preparation of the slides, there can be considerable time spent examining the sample by microscopy, especially when a sample has a low concentration of cysts or oocysts. Sometimes numerous slides must be examined to try to confirm a PCR-positive sample by microscopy. The other important considerations with microscopy that do not apply to PCR are the level of expertise of the microscopist and the fatigue factor, which may result in false-negatives or false-positives. On the other hand, PCR allows for more consistent and reliable results because the level of expertise and fatigue are not major factors. Polymerase chain reaction is also rapid and effective and allows for the analysis of many more samples in a day than does microscopy. In the present study, a direct comparison of methods for the detection of Giardia and Cryptosporidium demonstrated that the IMS-PCR assay was much more sensitive than was immunofluorescence microscopy. Overall, however, whenever a large number of cysts and oocysts were present, they were not difficult to detect, regardless of which method was used.
When IMS is used in diagnoses or surveillance studies, the added cost, the longer processing time involved, and the increased potential for human error are all important considerations. The additional processing time, however, is minimal, and when results that are more accurate are required, such as in surveillance studies, the extra time and expense may be justified. In addition, if microscopy is used for confirmation of PCR results, which is often the case, the additional processing time of IMS may, in fact, be made up by detecting positive samples more easily and quicker, because fewer slides may need to be examined.
The differences in detection with and without IMS may not have any real clinical relevance because of the intermittent shedding of Giardia cysts and Cryptosporidium oocysts. There are considerable data 25,29 suggesting that higher concentrations of cysts and oocysts are shed in animals that are symptomatic. As a result, asymptomatic animals may be more difficult to diagnose and, in such a situation, PCR testing may be optimized by adding a prior IMS step.
Although IMS-PCR may have limited value in clinical diagnostics because of the high cost of the IMS beads, it provides a higher sensitivity of detection for both Giardia and Cryptosporidium, which is of particular value when low or intermittent shedding of cysts and oocysts occurs. The IMS-PCR technique may be particularly useful in accurately determining the prevalence of infection in surveillance studies.
Acknowledgements
The authors would like to thank Dennis McKnight and Cindy Todd (Kemptville College, University of Guelph) and Cindy Roth (Brockville, Ontario), for providing access to cattle. Special thanks to Žarko Coklin for his assistance in the collection of samples.
Footnotes
a.
Fisher Scientific Co., Pittsburgh, PA.
b.
Giardi-a-Glo and Crypt-a-Glo, Waterborne Inc., New Orleans, LA.
c.
Nikon Eclipse E600 equipped with epifluorescence optics, Nikon Instruments Inc., Melville, NY.
d.
Dynabeads® GC-Combo kit, Dynal®-MX1, Dynal® MPC-S: Invitrogen Dynal AS, Oslo, Norway.
e.
DNeasy Tissue Kit, Qiagen Inc., Mississauga, Ontario, Canada.
f.
ExTaq DNA polymerase, Takara Bio Inc., Otsu, Shiga, Japan.
g.
KODON Total Genome and Sequence Analysis Software, Applied Maths Inc., Austin, TX.
h.
Splus6.2, Insightful Corp., Seattle, WA.