
Abstract
The objective of the current study was to evaluate various RNA extraction and polymerase chain reaction (PCR) protocols for the detection of Porcine reproductive and respiratory syndrome virus (PRRSV) in porcine oral fluids. Extraction protocols were selected based on ease of use and compatibility with high-throughput, automated systems. The results showed marked differences among extraction protocols, PCR protocols, and combinations thereof in detecting PRRSV in the oral fluid matrix. An important finding was that PCR reactions were partially inhibited by unknown factors in the oral fluid matrix and that inhibition was reduced by use of a higher concentration of PCR enzymes. The results suggest that further optimization of PCR assays for porcine oral fluids is needed and that laboratories should not assume that methods optimized for detection of virus in serum will perform equally with porcine oral fluids.
Introduction
Oral fluid is the liquid in the buccal cavity collected by use of an absorptive device. 2 The fluid is composed of saliva produced by the salivary glands and transudate that originates from the circulatory system. The diagnostic value of oral fluid reflects the presence of pathogens and/or antibodies produced locally or derived from the circulatory system. In human diagnostic medicine, both polymerase chain reaction (PCR)-based and antibody-based assays have been modified and optimized for testing oral fluids for a wide variety of pathogens. 11 The low cost of oral fluid samplings in combination with the availability of assays optimized for testing oral fluid specimens has made it possible to conduct large surveys for infections of public health importance (e.g., HIV in Africa and measles in Europe). 4 , 5 , 12
Veterinary medicine has been slow to adopt this sampling method, but testing of pen-based oral fluid samples has been shown to be effective for monitoring the circulation of Porcine reproductive and respiratory syndrome virus (PRRSV; order Nidovirales, family Arteriviridae, genus Arterivirus) and other infectious agents in populations of pigs, such as Porcine circovirus-2. 9 , 10 To date, the work has shown that, as in the case of human diseases, oral fluid sampling offers an efficient, cost-effective approach for the detection of economically important infectious diseases of pigs. 11 For porcine diagnostics, however, the process of optimizing assays for the oral fluid matrix and assessing their diagnostic performance has only been undertaken recently. Therefore, the objective of the present study was to evaluate nucleic acid extraction procedures and PCR protocols to identify the optimum combination for detection of PRRSV in oral fluid samples.
Materials and methods
Experimental design
The diagnostic performances of 5 extraction protocols and 2 reverse transcription (RT)-PCR protocols for PRRSV were evaluated using oral fluid samples from pigs of known PRRSV exposure status. Extraction protocols were selected based on the researchers' familiarity with the procedures and compatibility with high-throughput, semi-automated systems.
The oral fluid samples used in the present study were derived from PRRSV-inoculated pens collected up to 4 weeks after inoculation. 10 Pigs were randomly assigned to treatment groups and then intramuscularly inoculated on day 0 with 2 ml of a preparation containing 1 × 101.7 50% tissue culture infective dose (TCID50) of PRRSV per milliliter. Serum samples collected 8 days before the start of the experiment and at day 0 were assayed and determined to be negative by enzyme-linked immunosorbent assay (ELISA). Serum samples collected at day 10 were ELISA positive, confirming the presence of PRRSV infection. 10 Oral fluid samples were collected as described elsewhere. 10 A subset of oral fluid samples (n = 106), including 43 samples from negative control pens and 63 samples from inoculated pens, was selected to evaluate extraction and real-time RT-PCR protocols in the present study. The 63 samples from inoculated pens ranged from sampling dates between 1 and 4 weeks after inoculation and were selected to represent a range of likely PRRSV nucleic acid concentration.
Comparison of nucleic acid extraction protocols.
To reduce testing bias and variation, 1) oral fluid samples were completely randomized and blinded prior to testing; 2) extraction protocols were performed in random order; 3) within each protocol, extractions on the 106 samples and extraction controls were performed start-to-finish in the same day; and 4) the 5 RNA extracts from each sample (1 for each extraction protocol) were rearrayed to a single PCR plate to control for potential plate-to-plate variation in PCR master mix or real-time RT-PCR analysis settings between plates. Each sample was assayed 1 time by each combination of extraction and real-time RT-PCR procedure. Results were statistically analyzed to determine which procedures provided the best diagnostic performance.
Nucleic acid extraction protocols
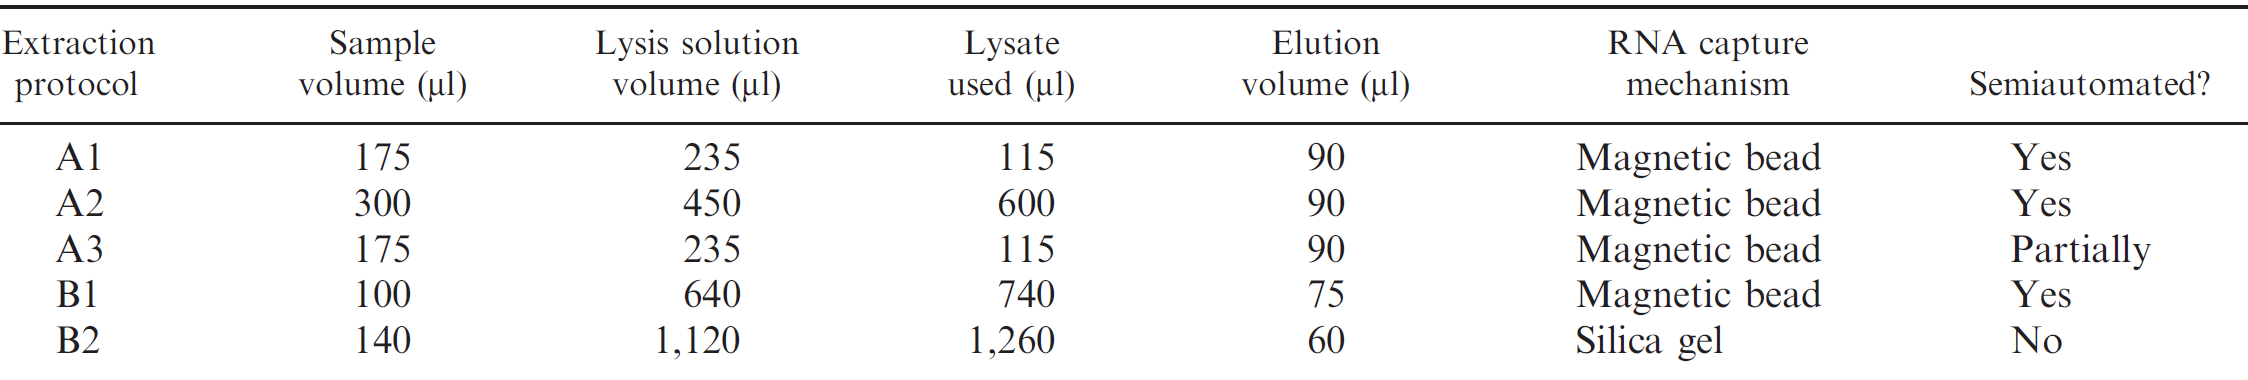
Five different nucleic acid extraction protocols were evaluated. Protocols differed in starting sample volume, the volume of lysate used in the extraction, final elution volume, and the method of RNA capture (Table 1).
Nucleic acid extraction protocol A1. Protocol A1 was based on a commercial kit a and was performed according to the manufacturer's instructions, with the exception of the preparation of the lysis/binding solution and the lysis step. For the lysis/binding solution, 40 ml of lysis/binding solution was combined with 623 μl of carrier RNA (without the addition of isopropanol), mixed thoroughly, and stored at room temperature until use. All other reagents were prepared according to the kit insert. For the lysis step, 175 μl of oral fluid sample was added to 235 μl of the lysis/binding solution in a deep-well plate. b Plates were covered with a seal, c mixed at 1,000 rpm on an orbital plate shaker d for 5 min, and then centrifuged at 2,500 × g for 6 min. A volume of 115 μl of lysate was then added to each well of a new deep-well plate to which 65 μl of isopropanol e and 20 μl of magnetic bead mix had already been added. The plate was loaded onto a semiautomated nucleic acid purification system f along with 2 plates of 150 μl of wash solution 1, 2 plates of 150 μl of wash solution 2, and a final plate of 90 μl of elution buffer, as per kit instructions. Extraction was then completed on the semiautomated system by using program AM_1836_DW50_v2. g Thereafter, the elution plate was sealed using a plate sealer c and frozen at −80°C until it was assayed by real-time RT-PCR.
Nucleic acid extraction protocol A2. Protocol A2 was based on a commercial kit a and was performed according to the manufacturer's instructions, with the following exceptions. Lysis/binding buffer was prepared as described in protocol A1. All other reagents were prepared according to the kit insert. For the lysis step, 300 μl of sample was added to 450 μl of prepared lysis/binding solution in a deep-well plate. b Plates were covered with a seal c and mixed at 1,000 rpm on an orbital plate shaker d for 5 min, and then were centrifuged at 2,500 × g for 5 min. A volume of 600 μl of lysate was then added to each well of a new deep-well plate to which 350 μl of isopropanol e and 20 μl of bead mix had already been added. The plate was loaded onto a semiautomated nucleic acid purification system f along with 2 plates of 300 μl of wash solution 1 and 2 plates of 450 μl of wash solution 2, and a final plate of 90 μl of elution buffer. Extraction was then completed on the semiautomated system by using program AM_1836_DW50_v2. g Thereafter, the elution plate was sealed using a plate sealer c and frozen at −80°C until it was assayed by real-time RT-PCR.
Nucleic acid extraction protocol A3. Protocol A3 was based on a commercial kit h and was performed according to the manufacturer's instructions, with the protocol for “Disruption of Liquid Samples.” All reagents were prepared according to the kit insert. In brief, 175 μl of oral fluid sample was added to 235 μl of lysis/binding solution in a tube containing zirconia beads for sample disruption. Bead beating was carried out using a high-speed shaker i for 15 min followed by centrifugation to pellet the beads. A volume of 115 μl of lysate was transferred to a plate containing 65 μl of isopropanol e and 20 μl of magnetic bead mix. The plate was loaded onto a semiautomated nucleic acid purification system f along with 2 plates of 150 μl of wash solution 1, 2 plates of 150 μl of wash solution 2, and a final plate containing 90 μl of elution buffer. Extraction was then completed on the semiautomated system by using program AM_1840_DW_v2. g Thereafter, the elution plate was sealed using a plate sealer c and frozen at −80°C until it was assayed by real-time RT-PCR.
Nucleic acid extraction protocol B1. Protocol B1 was based on a commercial kit j and was performed according to the manufacturer's instructions using the protocol for “Cell-Free Body Fluids.” In brief, 100 μl of oral fluid sample was added to 40 μl of proteinase K j in a deep-well plate, b followed by addition of 600 μl of buffer, isopropanol, and magnetic bead solution (buffer RLT j ). The plate was loaded onto a semiautomated nucleic acid purification system f along with 2 wash plates containing 500 μl of buffer RPE, j 1 plate containing buffer AW1, j and a final plate containing 75 μl of elution buffer, j per kit instructions. Extraction was then completed on the semiautomated system by using program KF96 Vet 100. k Thereafter, the elution plate was sealed using a plate sealer c and frozen at −80°C until it was assayed by real-time RT-PCR.
Nucleic acid extraction protocol B2. Protocol B2 was based on a commercial kit l and was performed according to the manufacturer's instructions. In brief, 140 μl of oral fluid sample was added to 560 μl of lysis buffer in a 1.5-ml centrifuge tube, mixed for 15 sec by pulse vortexing, and incubated at room temperature (25°C) for 10 min. Thereafter, 560 μl of ethanol m was added to the sample and mixed for 15 sec by pulse vortexing. The solution was transferred to a spin column l and was centrifuged at 6,000 × g. The process was repeated once, with filtrate being discarded. Columns were then washed with 500 μl of buffer AW1, 1 centrifuged at 6,000 × g, and the filtrate and collection tube were discarded. A total of 500 μl of AW2 l buffer was then added to each spin column, centrifuged at 20,000 × g, and the filtrate and collection tube were discarded. Last, a new collection tube was attached, and 60 μl of room temperature elution buffer l was added to each spin column. Columns were centrifuged at 6,000 × g for 1 min, after which collection tubes were closed and frozen at −80°C until they were assayed by real-time RT-PCR.
Nucleic acid extraction quality control. Quality control of the extraction process included 1 negative control (nuclease-free water) and 2 positive controls on each extraction plate or run. Positive controls consisted of a PRRSV field isolate (ISU-P) diluted in Eagle minimum essential media n to 2 levels: a “low positive” control (1 × 101.0 TCID50 per milliliter) and a “high positive” control (1 × 102.2 TCID50 per milliliter).
PRRSV RNA amplification and detection via realtime PCR. Real-time RT-PCR was performed with commercially available reagent sets, o in which North American and/or European PRRSV RNAs were reverse transcribed into complementary DNA and amplified by Taq DNA polymerase in a single-tube, one-step differential real-time RT-PCR reaction. Detection of amplified target was accomplished by hydrolysis probe chemistry. The master mix also contained primers and probes targeting an internal positive control RNA sequence. p The internal control RNA p was spiked into the real-time RT-PCR master mix at a concentration of 100 copies per microliter to monitor PCR amplification and allow for detection of failed PCR reactions. The following master mixes were evaluated.
1× master mix.—The 1× master mix was prepared according to the manufacturers' instructions g with the following component volumes per well: 12.5 μl of 2× RT-PCR buffer, 2.5 μl of 10 × PRRSV primer probe mix, 1.25 μl of 20× multiplex RT-PCR enzyme mix, 0.35 μl of a solution containing 100 copies per microliter of internal control RNA, and 0.4 μl of nuclease-free water.
2× master mix.—The 2× master mix was from the same manufacturer g but was prepared with the following component volumes per well: 12.5 μl of 2× RT-PCR buffer, 2.5 μl of 10× PRRSV primer probe mix, 2.5 μl of 20 × multiplex RT-PCR enzyme mix (double the amount in 1× master mix), and 0.35 μl of a solution containing 100 copies per microliter of internal control RNA.
Thereafter, the following conditions were the same for both experiments: 17 μl of final master mix and 8 μl of RNA extract were placed in each well of a 96-well PCR plate. q Real-time RT-PCR was then performed using a 96-well real-time thermal cycler r using the following cycling conditions: 1 cycle at 45°C for 10 min, 1 cycle at 95°C for 10 min, and 40 cycles of 97°C for 2 sec, 60°C for 40 sec. Quality control for the PCR reaction included nuclease-free water as negative amplification control in addition to a positive amplification control provided by the manufacturer. p
Analysis of real-time amplification curves was performed using commercial thermal cycler system software. r “Auto Baseline” was used to determine fluorescence baselines, and a “Manual Ct” threshold was set for each run, adjusted such that the threshold was within the linear portion of the amplification curve from positive amplification controls. p The threshold for internal controls was set in the same fashion using amplification curves from wells that contained negative amplification controls. Samples with threshold cycles (Cts) of <40 cycles were considered positive, and those with Cts ≥40 were considered negative.
Statistical analysis
Analysis of the real-time RT-PCR results was performed using statistical software. s The Cochran Q test was used to detect significant differences in the proportion of PRRSV PCR positives among the 10 protocols (5 extraction protocols × 2 master mixes) evaluated. The protocol with the highest proportion of positives in oral fluid samples from PRRSV-inoculated pens of pigs was then compared pairwisely with the other 9 protocols using the McNemar test. Analysis of the internal control data was performed by the McNemar test for the qualitative (positive/negative) results; differences in quantitative results (Ct values) were analyzed using both the signed rank test on Ct differences between experiments and a likelihood ratio test for homogeneity of variances.
Results
Positive and negative extraction and amplification controls were valid for all extraction protocols and PCR plates. Overall, 45 (71%) of 63 samples from pens of PRRSV-challenged pigs tested positive on at least 1 protocol. Among oral fluid samples from negative control pens, 7 of 430 tests (43 samples × 5 extractions × 2 RT-PCR assays) produced positive results (Table 2), for a false-positive rate of 1.6% (specificity = 98.4%).
Comparison of extraction and polymerase chain reaction protocols on Porcine reproductive and respiratory syndrome virus (PRRSV) real-time reverse transcription polymerase chain reaction-positive reactions in oral fluid samples.
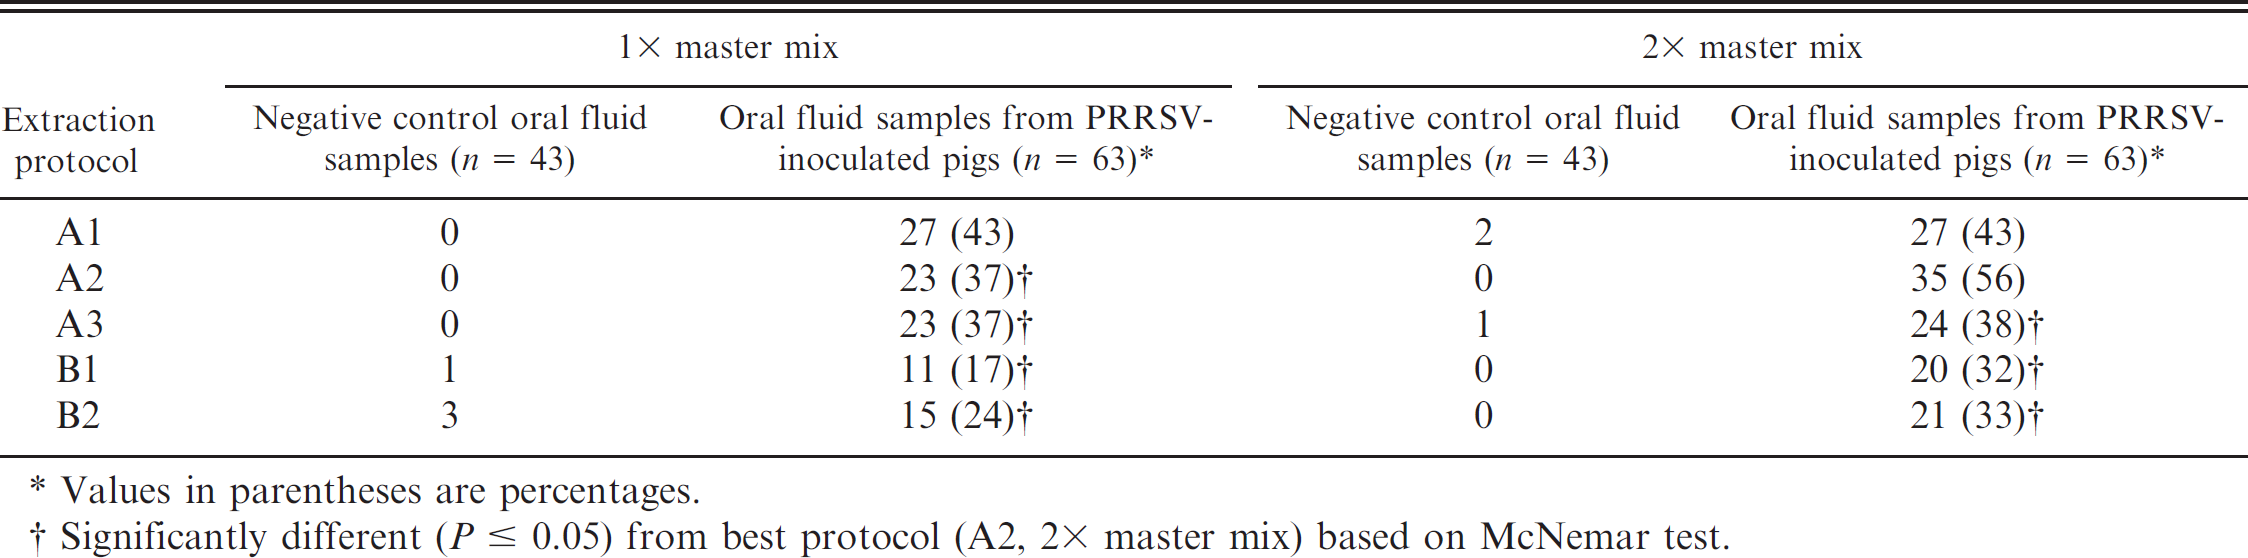
Values in parentheses are percentages.
Significantly different (P ≤ 0.05) from best protocol (A2, 2× master mix) based on McNemar test.
Results and statistical comparisons for all combinations of extraction and PCR protocols are listed in Table 2. An overall assessment of the results indicated significant differences in detection level among protocols (Cochran Q statistic = 41.873; P < 0.0001). The combination of extraction A2 and the 2× master mix produced zero false-positive reactions in negative control oral fluid samples and the most positive res in oral fluids from PRRSV-inoculated pens. This protocol was significantly better (P ≤ 0.05) than 7 of the 9 other protocol combinations when the results from the PRRSV-inoculated pens were compared in a pairwise fashion using the McNemar test.
Using the 1 × master mix in the PCR reaction, 4 of the 5 extraction methods had 2 or more negative control oral fluid samples in which the internal control was not detected (Table 3). The 2× master mix, containing twice the enzyme of the 1 × master mix, eliminated failed internal controls in 3 of the affected protocols and reduced the number of failed internal controls in the fourth. The McNemar test calculated on the basis of a total of 11 and 4 failed internal control reactions in the 1× and 2× master mixes, respectively, found that the difference in proportions was statistically significant (P = 0.0082).
Count of failed internal control* reactions in negative control oral fluid samples (n = 43).
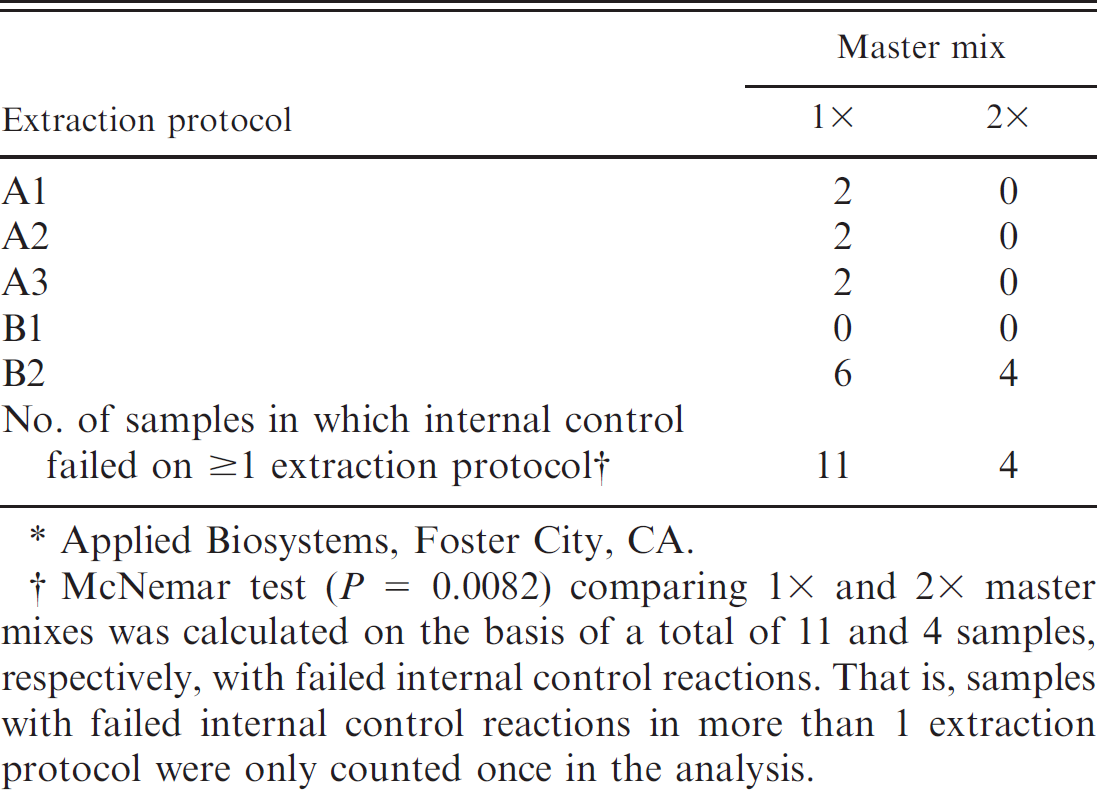
Applied Biosystems, Foster City, CA.
McNemar test (P = 0.0082) comparing 1× and 2× master mixes was calculated on the basis of a total of 11 and 4 samples, respectively, with failed internal control reactions. That is, samples with failed internal control reactions in more than 1 extraction protocol were only counted once in the analysis.
A box-and-whisker plot of Ct values for the internal control RNA in negative control oral fluids (n = 43) is shown inFigure 1 for every combination of extraction and PCR protocol. The mean Ct value for the 1× master mix was 34.41 (95% confidence interval [CI]: 34.09, 34.72), and it was 34.79 for the 2× master mix (95% CI: 34.69, 34.89), and they were not significantly different at P ≤ 0.05. To assess differences in dispersion of internal control Ct values, a likelihood ratio test for homogeneity of variances was performed on Ct values of internal controls and showed that the 2× master mix significantly reduced variation (P ≤ 0.05) for every extraction protocol.
Discussion
The objective of the current study was to evaluate RNA extraction and PCR protocols for the detection of PRRSV in porcine oral fluids. Although a relatively small number of procedures were tested, the results showed marked differences among extraction protocols, PCR protocols, and combinations thereof in the oral fluid matrix. Nucleic acid extractions were conducted as recommended by the manufacturers, but sample volumes, reagent volumes, and other factors varied among protocols (Table 1). This nonuniformity precluded the possibility of a detailed analysis of all protocol variables that could potentially impact assay performance.
The use of an internal positive control in the PCR assay made it possible to determine when the reaction failed and to identify false-negative results. Each of the 5 extraction methods produced the same or fewer failed internal control reactions when the concentration of PCR enzymes in the master mix was doubled. Simultaneously, the 2× master mix resulted in a statistically significant reduction in Ct variation in the internal control reactions, and the same or higher rates of positivity in samples from PRRSV-challenged pens. Cumulatively, these results suggested that the PCR reaction was partially inhibited by factors in the oral fluid matrix and that inhibition was reduced by use of the 2× enzyme mix, but important questions remain unresolved. For example, oral fluid volumes for nucleic acid extraction protocols A1, A2, and A3 were 175, 300, and 175 μl, respectively, but detection of PRRSV using the 1× master mix was equivalent. In contrast, the detection level for protocol A2 greatly improved with the 2× master mix, but detection for protocols A1 and A3 did not. One possible explanation for this result is that the larger initial sample volume in protocol A2 (300 μl) eluted both more RNA and more endogenous inhibitors. Following this logic, doubling the concentration of PCR enzymes may have compensated for the greater concentration of inhibitors and allowed for improved RNA detection.
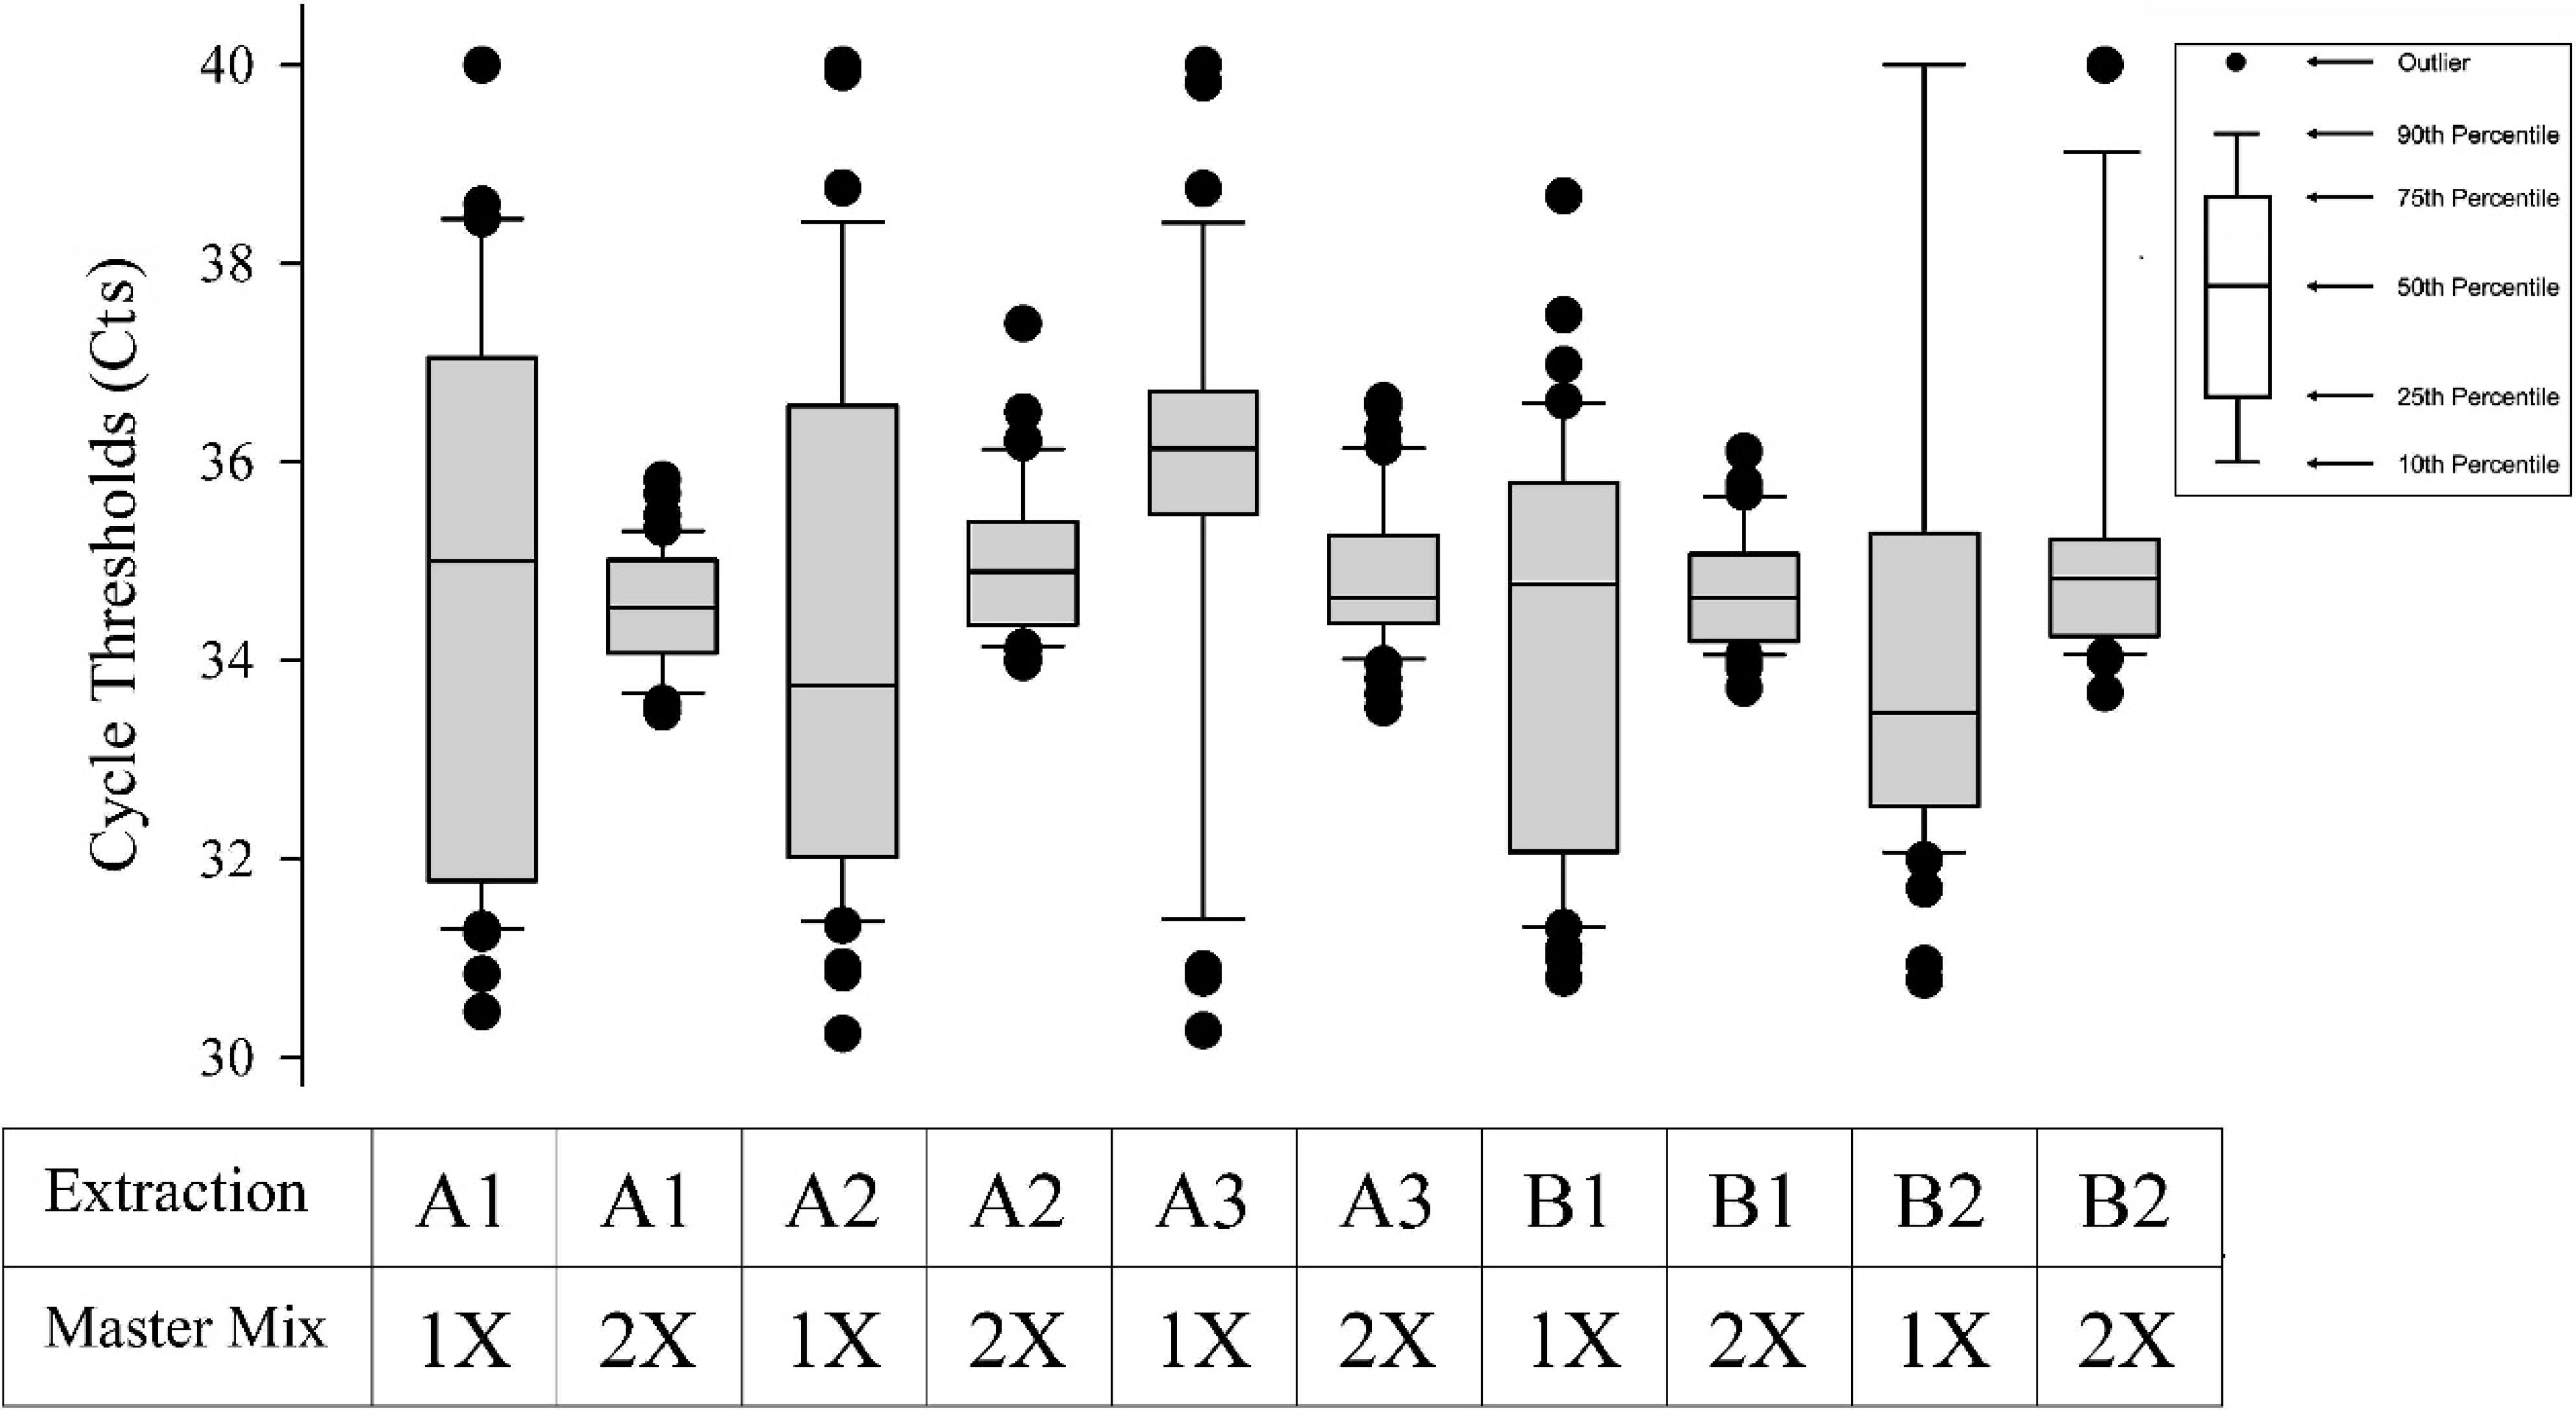
Internal control threshold cycle values by extraction protocol.
Polymerase chain reaction inhibition can manifest as complete reaction failure (false-negative) or as reduced analytical sensitivity. 13 Three mechanisms of inhibition proposed include failure of lysis, nucleic acid degradation and capture, and polymerase inhibition. 13 Inhibition of polymerase activity is the most common type of PCR inhibition. 3 The presence of PCR inhibitors was previously reported in human oral fluids, 1 , 7 , 8 and feces are known to have a similar effect. 6 Because porcine oral fluid samples often contain some level of fecal matter and other environmental contaminants, inhibitors of this sample type are of particular concern. The identity and mechanism(s) of endogenous PCR inhibitors in swine oral fluid remain unknown. In human oral fluids, polysaccharides were believed to inhibit PCR; this inhibition was overcome with the use of a chelating resin. t , 8 Other approaches to overcome PCR inhibition in other specimen types have been described, including dilution of template prior to PCR, addition of bovine serum albumin during amplification, and use of PCR enzymes designed for improved resistance to inhibition. 13 Further work is necessary to determine which of these strategies would be most effective.
Testing of porcine oral fluid samples by real-time RT-PCR has been increasingly adopted by swine producers and veterinarians as a technique for monitoring the circulation of PRRSV. 11 The growing use of oral fluid diagnostic specimens justified comparison of nucleic acid extraction and real-time RT-PCR protocols for the oral fluid matrix. The results of the current study clearly showed improvements in PRRSV PCR assay protocols for swine oral fluid, but also suggest that further assay optimization is needed.
Acknowledgements
The authors thank Amanda Manolis (Applied Biosystems, Foster City, CA) for providing extraction kits and PRRSV PCR reagents, as well as Paul Pearson (Qiagen Inc., Valencia, CA), who provided extraction kits. The study was supported in part by Pork Checkoff funds distributed through the National Pork Board (PO Box 9114, Des Moines, IA 50306) and the PRRS CAP, U.S. Department of Agriculture NIFA award 2008–55620–1932. Finally, the authors thank the faculty and staff of the Iowa State University Veterinary Diagnostic Laboratory for advice and technical support.
Footnotes
a.
MagMAX™-96 Viral RNA Isolation Kit, Applied Biosystems, Foster City, CA.
b.
Polypropylene Microtiter® Microplates, Thermo Fisher Scientific Inc., Waltham, MA.
c.
AluminaSeal™, Diversified Biotech, Dedham, MA.
d.
Titer plate shaker, Thermo Fisher Scientific Inc., Waltham, MA.
e.
100% ACS-grade isopropanol, Fisher Scientific Co., Pittsburgh, PA.
f.
KingFisher® 96 magnetic particle processor, Thermo Fisher Scientific Inc., Waltham, MA.
g.
Applied Biosystems, Foster City, CA.
h.
MagMAX™ Total Nucleic Acid Isolation Kit, Applied Biosystems, Foster City, CA.
i.
TissueLyserII, Qiagen Inc., Valencia, CA.
j.
BioSprint® 96 One-For-All Vet Kit, Qiagen Inc., Valencia. CA.
k.
Qiagen Inc., Valencia, CA.
l.
QIAamp® Viral RNA Mini Kit, Qiagen Inc., Valencia, CA.
m.
100% ethanol ACS grade, Sigma-Aldrich, St. Louis, MO.
n.
Eagle's Minimum Essential Media (MEM), Sigma-Aldrich, St. Louis, MO.
o.
TaqMan® NA and EU PRRSV Reagents, Applied Biosystems, Foster City, CA.
p.
TaqMan® NA and EU PRRSV and Xeno™ RNA Controls, Applied Biosystems, Foster City, CA.
q.
96-well Fast PCR plates, Applied Biosystems, Foster City. CA.
r.
7500 Fast Real-Time PCR System, Applied Biosystems, Foster City, CA.
s.
SAS® Version 9.2, SAS Institute Inc., Cary, NC.
t.
Chelex® 100, Bio-Rad Laboratories, Hercules, CA.