
Abstract
Diagnostic laboratories frequently select a subjective cutoff value for real-time amplification assays, above which a threshold cycle (Ct) value is deemed false. Commonly, higher Ct values are interpreted as amplification or fluorescence artifacts, or cross contaminations. Although the implementation of Ct cutoff might be reasonable, its justification and selection should be based on evidence. The current article reviewed evidence-based strategies to select Ct cutoffs grouped in analytical and epidemiologic approaches. Analytical strategies use criteria gathered during the assay development and include fluorescence threshold, reaction end-cycle, limit of detection, and artifact investigation. Variability in amplification efficacy across test runs may induce some instability in an intended Ct cutoff and requires some standardization or normalization procedures. Epidemiologic strategies use criteria based on either the probability or the cost of a false test result associated with a specified cutoff. Cutoffs, depending on the intended purpose of the test, can be selected graphically to minimize the probability of either false-positive or false-negative results by using two-graph receiver operating characteristics curves. The assay's diagnostic sensitivity and specificity may vary with the tested population, thus, the estimated two-graph receiver operating characteristics curve is population dependent and should be established for the targeted population. Although the selection of a cutoff based on misclassification cost depends on infection prevalence, the selection based on predictive values does not. To optimize the test average diagnostic performance, the Ct cutoff should be selected when diagnostic odds ratio is maximal. Epidemiologic approaches were illustrated by selecting Ct cutoffs for a real-time assay for Infectious salmon anemia virus.
Introduction
In the past decade, polymerase chain reaction (PCR) assay has become a standard method for the detection of a wide range of pathogens and biomarkers in veterinary diagnostics. Lately, laboratories are progressively shifting from conventional PCR toward a method referred to as kinetic, real-time, or quantitative PCR (qPCR), which allows monitoring of the progression of the amplification during the cyclic reaction. Compared with standard PCR, this method provides substantial benefits to laboratorians, including the following: 1) reduced time of analysis, 2) increased analytical sensitivity, 3) increased reproducibility, and 4) decreased cross contamination. 13 Although the cost of equipment and reagents restricted the utilization of this method in the past, 13 it is now more affordable and available in many diagnostic laboratories.
Real-time outcome
The qPCR outcome is continuous, whereas conventional PCR is binary (i.e., absence or presence of an expected gel band). Referred to as the threshold cycle (Ct) or crossing point value, the qPCR outcome reflects the cycle at which the florescence signal exceeded a defined background threshold (Fig. 1). The fluorescence signal is measured at the end of each amplification cycle, and the obtained Ct value results from the interpolation of the 2 signal measurements between which the threshold was crossed. Threshold cycle values, therefore, are positive and continuous up to the last cycle of the reaction. Real-time PCR results differ from conventional continuous outcome of other diagnostic assays (e.g., enzyme-linked immunosorbent assay) in that negative specimens do not yield Ct values because the fluorescent signal stays below the specified threshold. The distributions of Ct values are generally non-normal, heteroscedastic, and truncated. 7 In addition, the quantitative Ct value is negatively associated with the (log) concentration of nucleic acids detected (i.e., high Ct value reflects a low target concentration and vice versa). 24
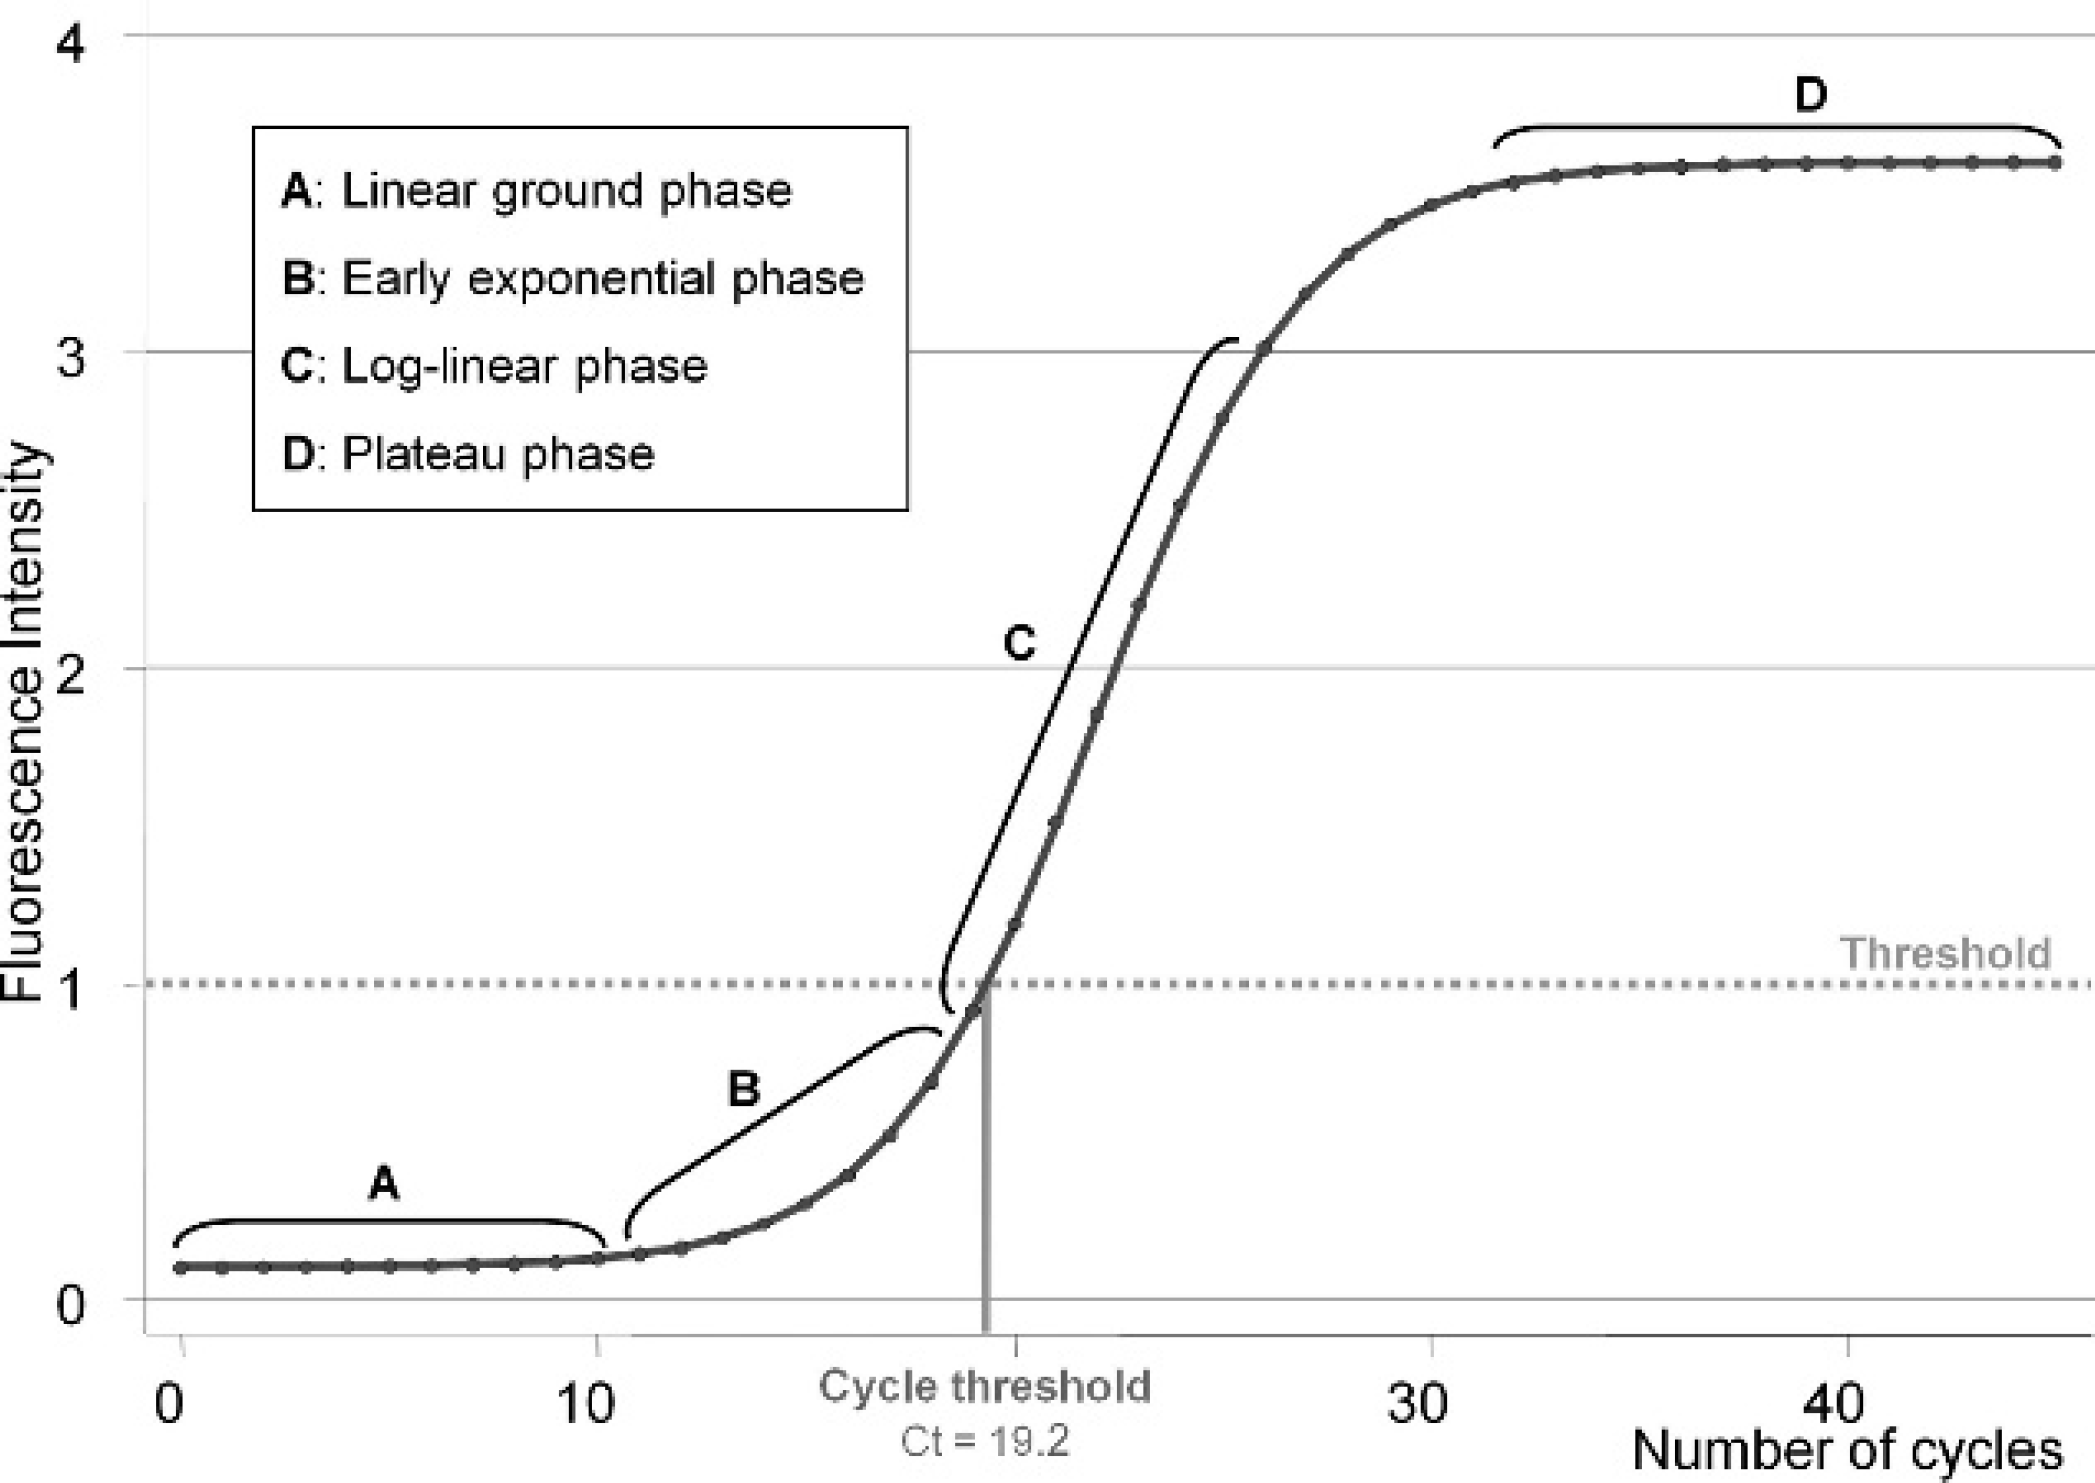
Schematic sigmoid profile of fluorescence accumulation across cycles during a
real-time amplification. The amplification curve experiences 4 different
phases: linear ground (
Generally, when a Ct value is obtained, the specimen tested is deemed to be positive. Recently, however, there is an increasing tendency among laboratory operators to consider as negative (i.e., false-positive) any Ct values above an arbitrary cutoff value. It is assumed that the high Ct value is generated by degradation of the probe-based fluorophore by cross contamination or by nonspecific amplification of background nucleic acids. 7 A sample with a Ct value greater than the subjective cutoff might, therefore, be classified and reported to the end user as a negative result without additional information to distinguish it from results that did not produce a Ct value. If the information associated with a high Ct value is not trustworthy, then why are reactions pursued beyond the decided cycle cutoff ? Therefore, although the implementation of Ct cutoff might be reasonable, its justification and its selection should be based on evidence.
The objective of the current work was to list justifications for choosing cutoff values for real-time PCR outcomes based on biologically sound evidence. Approaches for the selection of Ct cutoff were distinguished between bench-level (analytical) approaches and population-level (epidemiologic) approaches (Fig. 2). The application of the epidemiologic principles were illustrated by the example of a quantitative reverse transcription PCR (qRT-PCR) used to detect the presence of Infectious salmon anemia virus (ISAV) in farmed Atlantic salmon in Canada.
Empirical justifications of cutoffs for real-time PCR assay
Justifications and selection of cutoff at the “bench” level (analytic approaches)
Analytical criteria refer to technical parameters of the assay evaluated during the bench development, optimization, and standardization of the method.
Fluorescence signal threshold
The first consideration in the development of a qPCR protocol is the selection of a threshold level for the fluorescence signal. This limit is either selected by applying complex algorithms or visually by the operator. 15 The approach to select the threshold is often directed by the equipment and/or the software associated with the thermocycler. A simple approach is to set the threshold at several standard deviations above the fluorescence baseline mean (Fig. 1), 24 as it is done with other continuous assays (e.g., enzyme-linked immunosorbent assay). 2 However, the intention in qPCR is to ensure that the log-linear phase of the amplification is reached (Fig. 1) 17 and not that a targeted proportion of the noninfected and/or non-diseased population is selected. 20 Although the fluorescence signal threshold inherently influences the position of a Ct value, the operator primarily focuses on the discrimination among the Ct values themselves.
Limited number of cycles (amplification efficacy)
Technically, qPCR already uses a cutoff for Ct values by limiting the number of amplification cycles. Hypothetical increases of the fluorescence signal above the threshold after the last reaction cycle, therefore, are not detected and are considered negative. In general, the number of run cycles is set on the assumption that, if a single copy of the target is present in the tested specimen, then amplicons should be generated in sufficient quantity to be detected before the last cycle. Conventionally, qPCR protocols are set up to 40 cycles, which yields, in theory, a trillion amplicons from a single target molecule (Table 1) if the number of copies doubles at each reaction (i.e., amplification efficacy [E] = 1). However, E is rarely equal to unity and may decrease as the reaction progresses with the decline of reagents. 14 Thus, the number of generated amplicons may differ greatly (Table 1). Even if the qPCR is already limited by the number of run cycles, the operator may still want to set a Ct cutoff before the last cycle. One technical justification to select a Ct cutoff earlier during the reaction is to consider a Ct value false when it is below the corresponding reliable limit of detection of the assay.
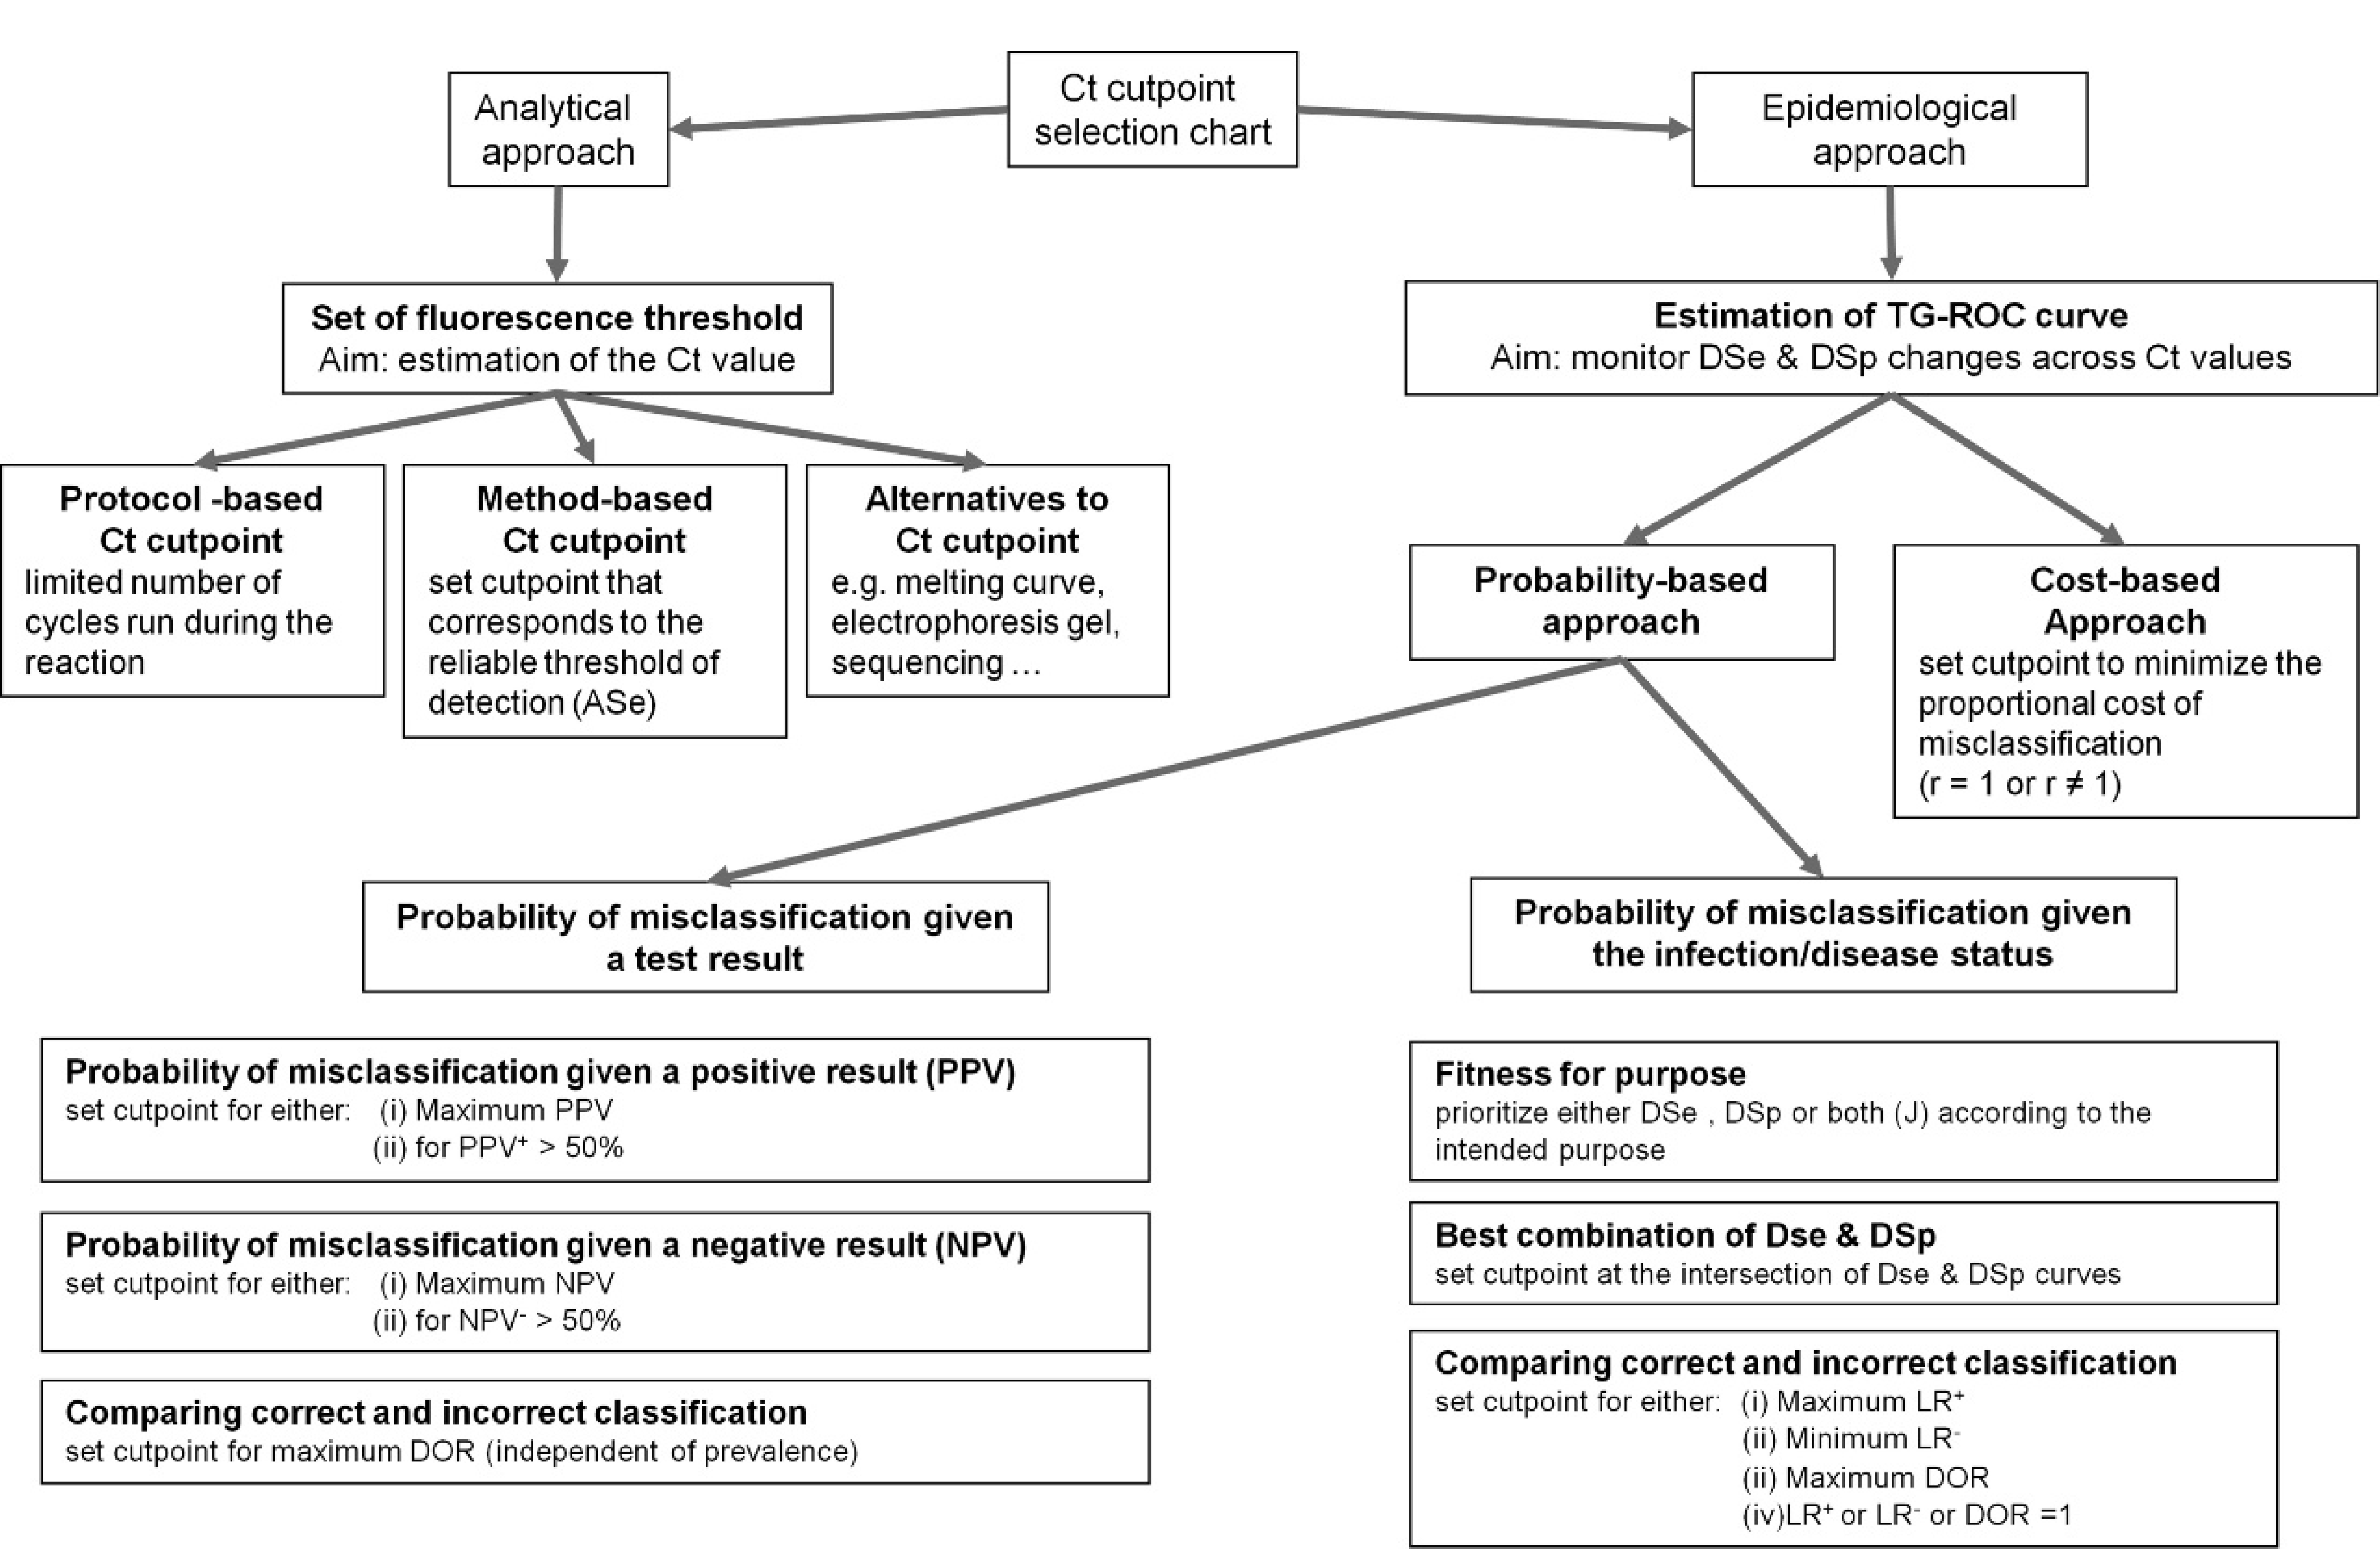
Decision tree for selecting a cutoff for real-time amplification assays. DSp = diagnostic specificity; DSe = diagnostic sensitivity; DOR = diagnostic odds ratio; J = Youden index; LR+ = likelihood ratio of a positive test; LR− = likelihood ratio of a negative test; PPV = positive predictive value; NPV = negative predictive value.
Limit of detection as the cutoff
During the development of an assay, the linear operating range of the method must be determined, including the estimation of the lower and upper limits of detection. 25 Referred to as analytical sensitivity (ASe), the lower limit of detection is defined as the minimum concentration of analyte detected with a known certainty. 25 By following the World Organization of Animal Health (OIE) guidelines, the ASe is determined as the endpoint dilution at which 50% of the tested samples are positive. 25 For PCR, the limit of “exactly 50%” positive test results is a recent modification from the previous international requirement of “at least 95%.” 7 Like most binary outcome diagnostic tests, qPCR is based on the dichotomization of individuals according to a measured continuous underlying trait (i.e., target concentration). 6 An analytical cutoff, therefore, could be justified by selecting a Ct value that corresponds to the defined lower limit of detection of the test. Any Ct value above this defined limit (i.e., lower amount of target) would, thereafter, be considered not reliable.
Correspondence between number of amplicons generated (Xn ) with the number of cycle (n) according to the amplification efficacy (E). *
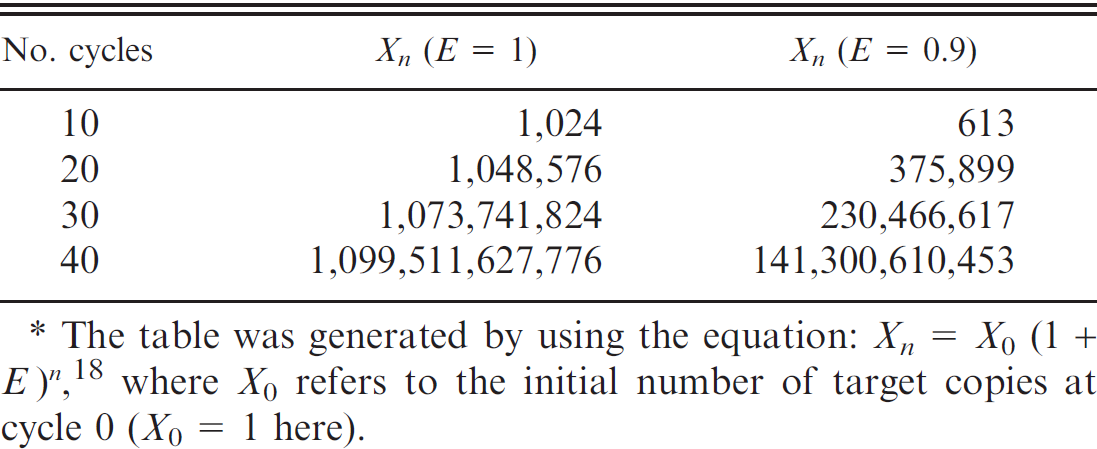
The table was generated by using the equation: Xn = X 0 (1 + E) n , 18 where X 0 refers to the initial number of target copies at cycle 0 (X 0 = 1 here).
Two approaches were suggested to estimate the ASe of qPCR. 7 The first, referred to as “experimental” ASe (ASeexp), determines the last investigated serial dilution where at least 95% of the samples tested positive. 7 This approach is less precise, because the exact concentration that corresponds to 95% detection is not estimated. Interestingly, the number of replicates per concentration did not seem to influence significantly the estimation of ASeexp. 7 For the sake of simplicity, the investigators of the current study suggest that the ASeexp estimation approach be adapted to the current OIE requirements of 50% of a positive test result associated to a certain degree of confidence (i.e., power of the sample size). This approach would reduce the number of tested samples necessary for each dilution, and the sample size calculation can be based on a computation to demonstrate freedom of disease. 8 For instance, to demonstrate that the assay does not detect at least 50% of samples at a specified concentration (i.e., proportion of positive test results lower than 50%) with 95% confidence, 5 replicates per dilution would be necessary. The ASeexp will then be estimated as the last serial concentration that yields positives on all 5 replicates (i.e., probability to test positive above 50%). A serial concentration with at least 1 negative of the 5 samples would reveal a probability to test positive potentially below 50%. For a 99% level of confidence, 7 replicates would be necessary. In addition, it is important to consider the dilution factor used in the serial dilution because it will impact the precision of ASeexp estimation. The lower the dilution factor, the more refined is the estimation (i.e., smaller gap between serial dilutions). For simplicity, dilution factors of 10 are frequently used, albeit some studies used a factor as low as 2 to increase the precision of estimation. 7
The second approach, referred to as “theoretical” ASe (ASetheo), uses computer-based regression modeling in which the exact dilution that corresponds to 95% positives is estimated. 7 Although more complex and exacting, this method is more sensitive to the number of replicates used per concentration. 7 In addition, caution should be taken when using this approach because the regression computation requires certain assumptions that may not hold true because of the atypical nature of Ct values (e.g., heteroscedasticity).
Once the ASe has been estimated, the corresponding Ct value is selected as the Ct cutoff. However, the efficacy of amplification can differ greatly across reactions. Further standardization can be achieved by either estimating the Ct value that corresponds to the ASe by using a standard curve (absolute quantification approach) or by normalization of the Ct cutoff by using the Ct value of a reference gene co-amplified in multiplex or parallel (relative quantification approach). 24
The selection of Ct cutoff can be based on the linear operating range of the assay. However, specimens with a pathogen concentration lower than the limit of detection will be considered negative when they can still be detected (i.e., with a probability lower than 50%). An alternative approach to cutoffs is to implement verification techniques to investigate potential cross contaminations and amplification artifacts.
Investigation of artifactual results
Amplicon artifacts are spurious products or primer dimers that are usually observed toward the end of the reaction. According to the fluorophore chemistry used, further procedures are routinely used to discriminate fluorescence signal artifacts. For instance, in SYBR Green a dye-based assays, investigation methods include melting curve analysis, electrophoresis gel, and sequencing. Comparatively, probe-based assays (e.g., TaqMan probe), b which are based on the detection of a specific sequence within the amplicon, limit some of the nonspecific fluorescence signals.
Alternatively, cross contamination from positive controls or truly infected samples with negative samples tested in parallel is the other common type of false-positive result. 23 In this situation, a strategy is to use positive controls marked distinctly from the samples, thus allowing tracking of potential contamination afterward. Although the concept stays the same, a wide range of marking strategies and marker detection techniques exist. For instance, the design of a plasmid-based positive control that contains a unique target site for a probe is one such approach. 19 The positive control is detected by the first probe specific to the target and also by a second probe (different fluorophore) that targets a unique sequence. Both probes are added to test samples, and positive results are detected by the first probe. The accidental introduction of the positive control plasmid to the sample will induce the second probe to produce a signal. However, no standard investigation strategy exists, except maybe sequencing, to address cross contamination among submitted specimens, the likelihood of which increases when some of the analyzed samples are strongly infected.
In conclusion, selection of cutoff based on analytical evidence is primarily justified by setting a reliable limit of detection. In this instance, the operator may decide to end the reaction at the corresponding Ct values. However, the inherent variability of amplification efficiency across runs supports running the reaction longer with either standardization or normalization procedures to precisely identify the appropriate cutoff value. An alternative to cutoff is the implementation of verification procedures to investigate suspicious results. Nonetheless, one may want to justify a cutoff based on the probability or the cost to have a false test result.
Justification and selection at the “population” level
Factors that influence diagnostic misclassification of a test include analytical parameters at the bench level and errors made in the “field” during sample collection and storage, which can also influence the interpretation and reporting of test results. 25 Approaches that use epidemiologic tools to account for population and exposure factors may provide a more pragmatic evaluation of a detection method and assist authorities in the decision-making process. Epidemiology-based justifications for the selection of a Ct cutoff are 2-fold: 1) reduction of the probability of misclassification, or 2) control of costs associated with misclassification. The epidemiologic parameters to assist in quantifying the operating characteristics of an assay and justifying the selection of cutoff values will be defined and a graphical tool used for estimation will be described.
Diagnostic accuracy
The accuracy of a diagnostic test is traditionally reported separately within infected and/or diseased (D+) and noninfected and/or nondiseased (D−) individuals. Diagnostic sensitivity (DSe) refers to the probability of a specimen to test positive given that the sampled individual was D+, and diagnostic specificity (DSp) refers to the probability of a specimen to test negative given that the sampled individual was D−. 26
Assay performances can also be expressed by using single parameters. The Youden index (J) expresses the average rate of “successes” of the test (difference between proportions of correctly classified and incorrectly classified) within both the D+ and the D− groups, 27 and has been suggested as a potential criteria to select cutoffs. 12 The estimation of J can be directly computed from DSe and DSp as follows:

The test discrimination is deemed positive (i.e., test useful) when J is above 0, which means that the test, regardless of the disease status, has a higher probability of success than failure. The test efficiency (Ef; proportion of correctly classified samples) is another single parameter that expresses test accuracy. Computed as Ef = P × DSe + (1 − P) × DSp, this parameter may be considered less useful because it is dependent on P, the prevalence of D+ in the population. 1
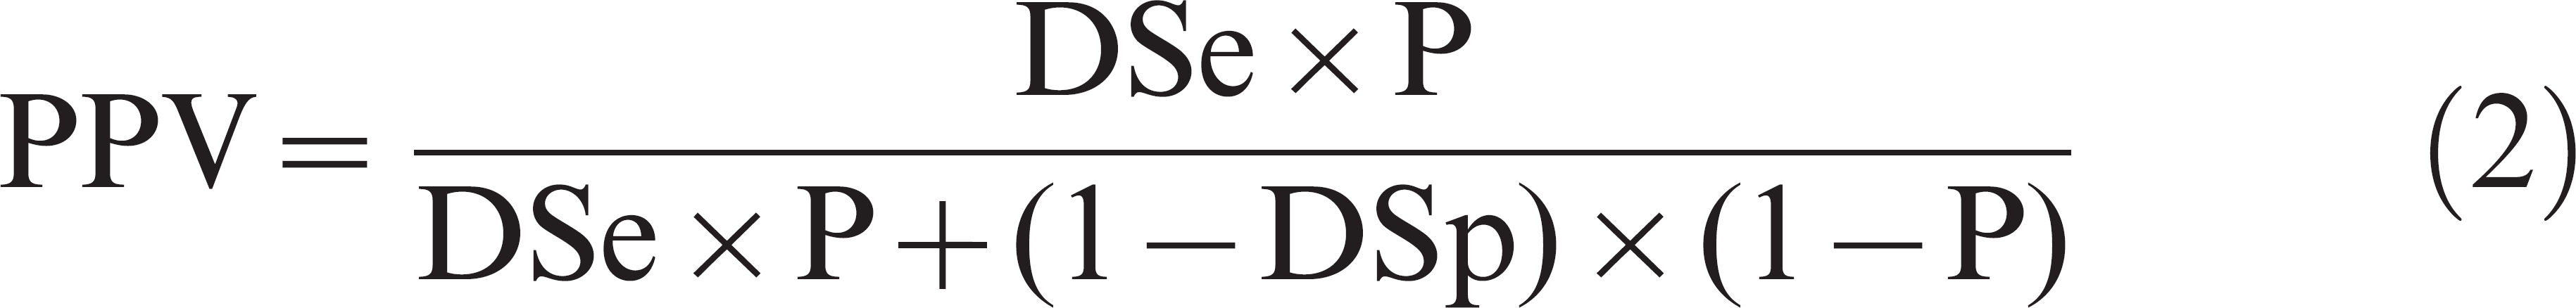
The DSe and DSp are estimated during test evaluation studies where the health status of tested specimens is presumably known with certainty. In practical applications, the true status is unknown, and only the result of the test is available to the user to make a decision. Thus, a test user is interested in the probability of D+ given a particular test result. This corresponds to estimating the positive predictive value (PPV) of a positive test result, which refers to the probability that an individual is D+ given that its specimen tested positive. Alternatively, the negative predictive value (NPV) corresponds to the probability that an individual is D− given that its specimen tested negative. 21 Predictive values depend on DSe, DSp, and the prevalence of D+ within the sample population (P), as shown in the following equations:

Diagnostic accuracy can also be expressed as likelihood ratios (LR). In the situation of a binary test result (i.e., cutoff-specific LR), the LR for a positive test result (LR+) reflects how much more likely D+ individuals are to test positive compared with D− individuals. The likelihood ratio for a negative test result (LR−) reflects how much less likely D+ individuals are to test negative compared with D− individuals. 8 Likelihood ratios can be defined for specific cutoffs associated with different sets of DSe and DSp, and are estimated by using the following equations:


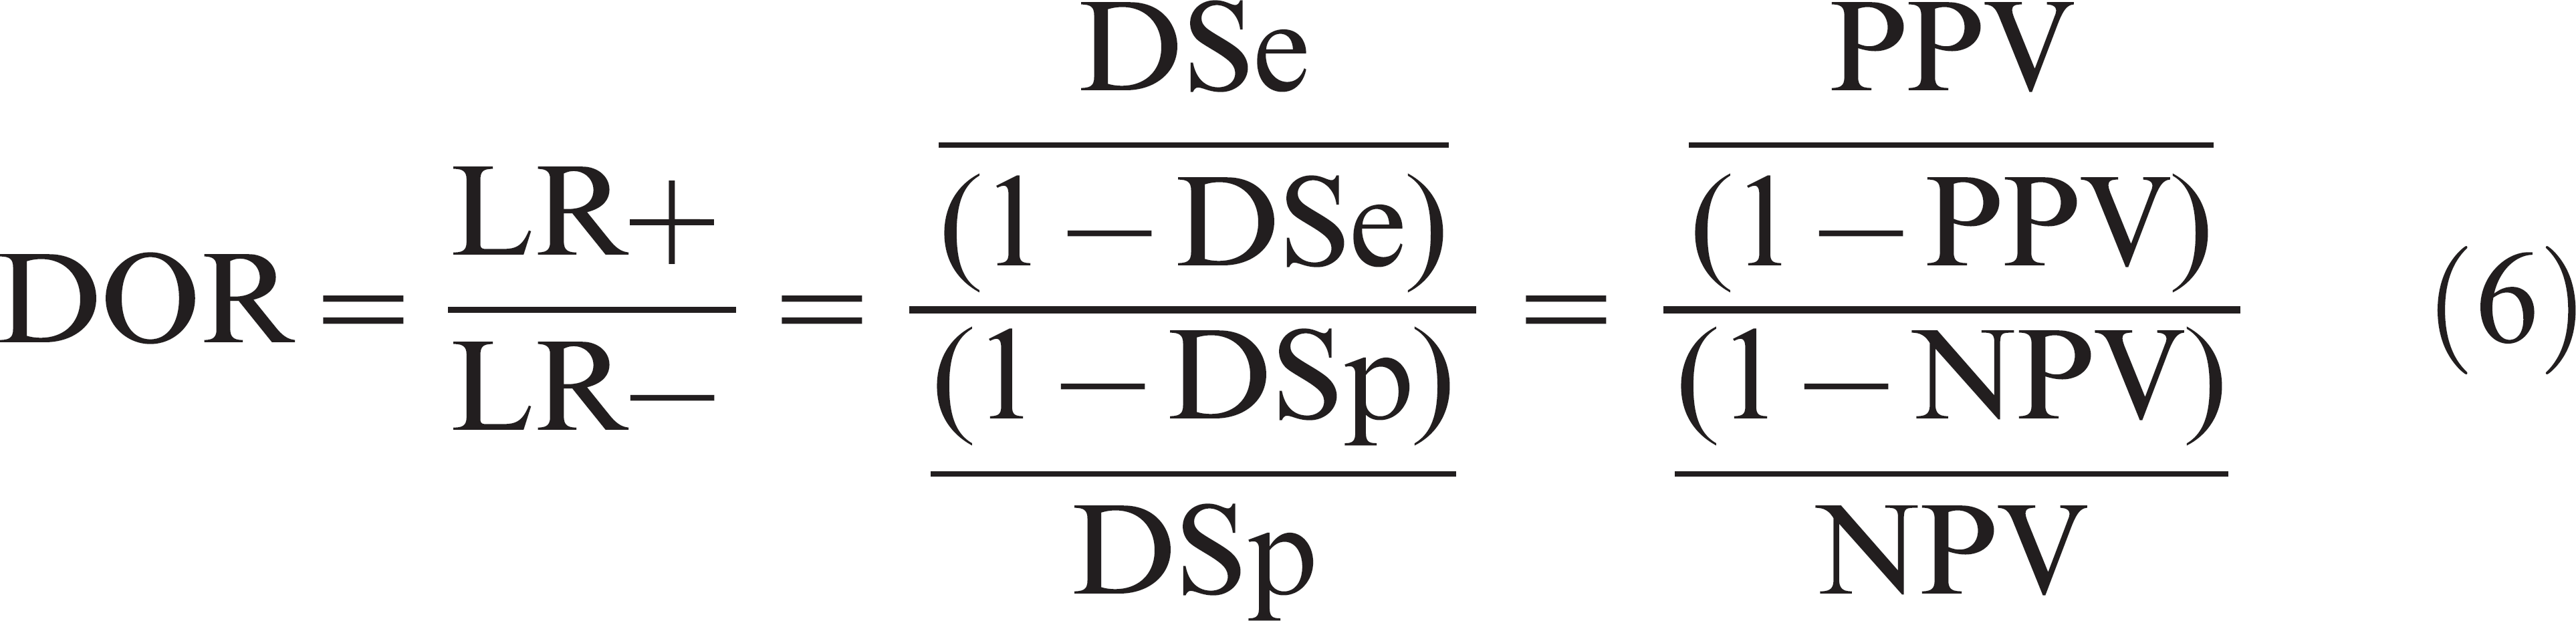
The last parameter of interest is diagnostic odds ratio (DOR), another single measure of diagnostic test accuracy that equals to the ratio of the odds of infection and/or disease in positive test results over the odds of infection and/or disease in negative test results. 9 The DOR, therefore, is estimated by using LR+ and LR−, DSe and DSp, or PPV and NPV:
The greater the DOR is above 1, the more useful is the test. If DOR is between 0 and 1, tested individuals have a greater chance of being misclassified than correctly classified (negative discrimination).
Two-graph receiver operating characteristic plot
Derived from the receiver operating characteristic (ROC) analysis, the two-graph (TG) ROC plot was developed to graph the variation of DSe and DSp of a continuous outcome assay across a range of cutoffs. 12 By assuming that the cutoff value is an independent variable, TG-ROC identifies intermediate test performances and facilitates the graphical selection of cutoff values. For conventional continuous outcome assays that directly quantify a target, obtained values are interpreted as positive when they are above or equal to a set cutoff. Therefore, the curve for DSe starts at 100% and monotonically decreases toward 0% with an increase of the cutoff, whereas the DSp curve starts at 0% and increases toward 100%. Conversely, in qPCR, a Ct value is deemed positive when it is below or equal to the set cutoff. Hence, DSe increases toward 100% with increasing Ct cutoff, whereas DSp decreases (Fig. 3A). Except for technical limitations, all specimens tested with conventional methods yield a measurement, and, therefore, both DSe and DSp can reach extreme values (i.e., 0% or 100%). For qPCR, DSp is not expected to reach 0% at the endpoint Ct cutoff because most D− individuals would not yield a Ct value. In addition, DSe is not expected to reach 100% because false-negatives, when they exist, do not yield a Ct value (Fig. 3A).
When the true health status is known, automated nonparametric or parametric (i.e., when assuming a specified distribution) computations to generate TG-ROC curves exist in varying statistical packages. For instance, the Stata statistical package c offers a roctg command. 16 When the true health status is unknown, Bayesian estimations of semiparametric standard ROC curves were developed to construct TG-ROC. 5 The TG-ROC, thereafter, are completed by adding curves of additional test accuracy parameters, in which the calculation depends directly on DSe and DSp (e.g., Fig. 3B). Optimal cutoffs are then selected to minimize the probability or the cost of misclassification.
Minimization of the probability of misclassification
According to OIE requirements, to be validated for international trade, the fitness for a specific purpose of an assay must be demonstrated. 25 The purpose of the test is to be defined first, then DSe and DSp are determined by selecting the proper cutoff to fit the intended use of the test. The OIE lists the following 6 different purposes for using a test 25 :
Demonstration of freedom from infection in a defined population (country/zone/compartment/ herd),
certification of freedom from infection or the presence of the agent in individual animals or products for trade/movement purposes,
eradication of disease or elimination of infection from defined populations,
confirmatory diagnosis of suspect or clinical cases (includes confirmation of positive screening test),
estimation of prevalence of infection or exposure to facilitate risk analysis (surveys, herd health status, disease control measures), and
determination of immune status of individual animals or populations (postvaccination).
The current article focuses on PCR diagnostic tests that, conventionally, detect the presence of the pathogen directly and are not used to determine immune status, therefore, OIE purpose (6) will not be considered further.
Probability of misclassification given the health status. A test should be validated and certified according to how well it performs for a specific purpose. For OIE purposes (1) and (4), the test validation will prioritize DSp (therefore, PPV) over DSe. The Ct cutoff is set such that DSp is maximized and DSe optimized (Fig. 3A, line A). For OIE purpose (2), the test validation will prioritize DSe (therefore, NPV) over DSp. The Ct cutoff is set such that DSe is maximized and DSp optimized (Fig. 3A, line B). Generally, for OIE purpose (3), if the agent has zoonotic consequences for human safety, then DSe (therefore, NPV) will be prioritized over DSp, whereas, if the agent has direct economic consequences because of depopulation cost, then DSp (therefore, PPV) will be prioritized over DSe. Finally, for OIE purpose (5), reduction of overall misclassification is the priority, regardless of the infection and/or disease status. This situation occurs when the test user intends to optimize the estimation of prevalence of infection and/or disease in a population. Here, the nature of misclassification (false-positive or false-negative) does not have an impact on the final purpose of the test, because the estimated apparent prevalence will be corrected to obtain the true prevalence.
The most intuitive way to select a Ct cutoff to reduce misclassification is to identify the Ct value that yields the best combination of DSe and DSp. That is, the Ct value for which DSe and DSp are equal or for which the square of the difference between the 2 parameters is minimized. 16 Practically, this cutoff corresponds to the Ct value where DSe and DSp curves intersect (Fig. 3A, line C). This approach is used when no clear purpose of the test is predefined and operators desire a balanced performance for misclassification of both positives and negatives. However, this approach does not minimize overall probability of misclassification given the health status. An alternative approach is to select the cutoff where J is maximized (Fig. 3A, line D). Maximizing J minimizes the sum of the false-positive and false-negative proportions. This approach may differ from the best pair approach (Fig. 3A).
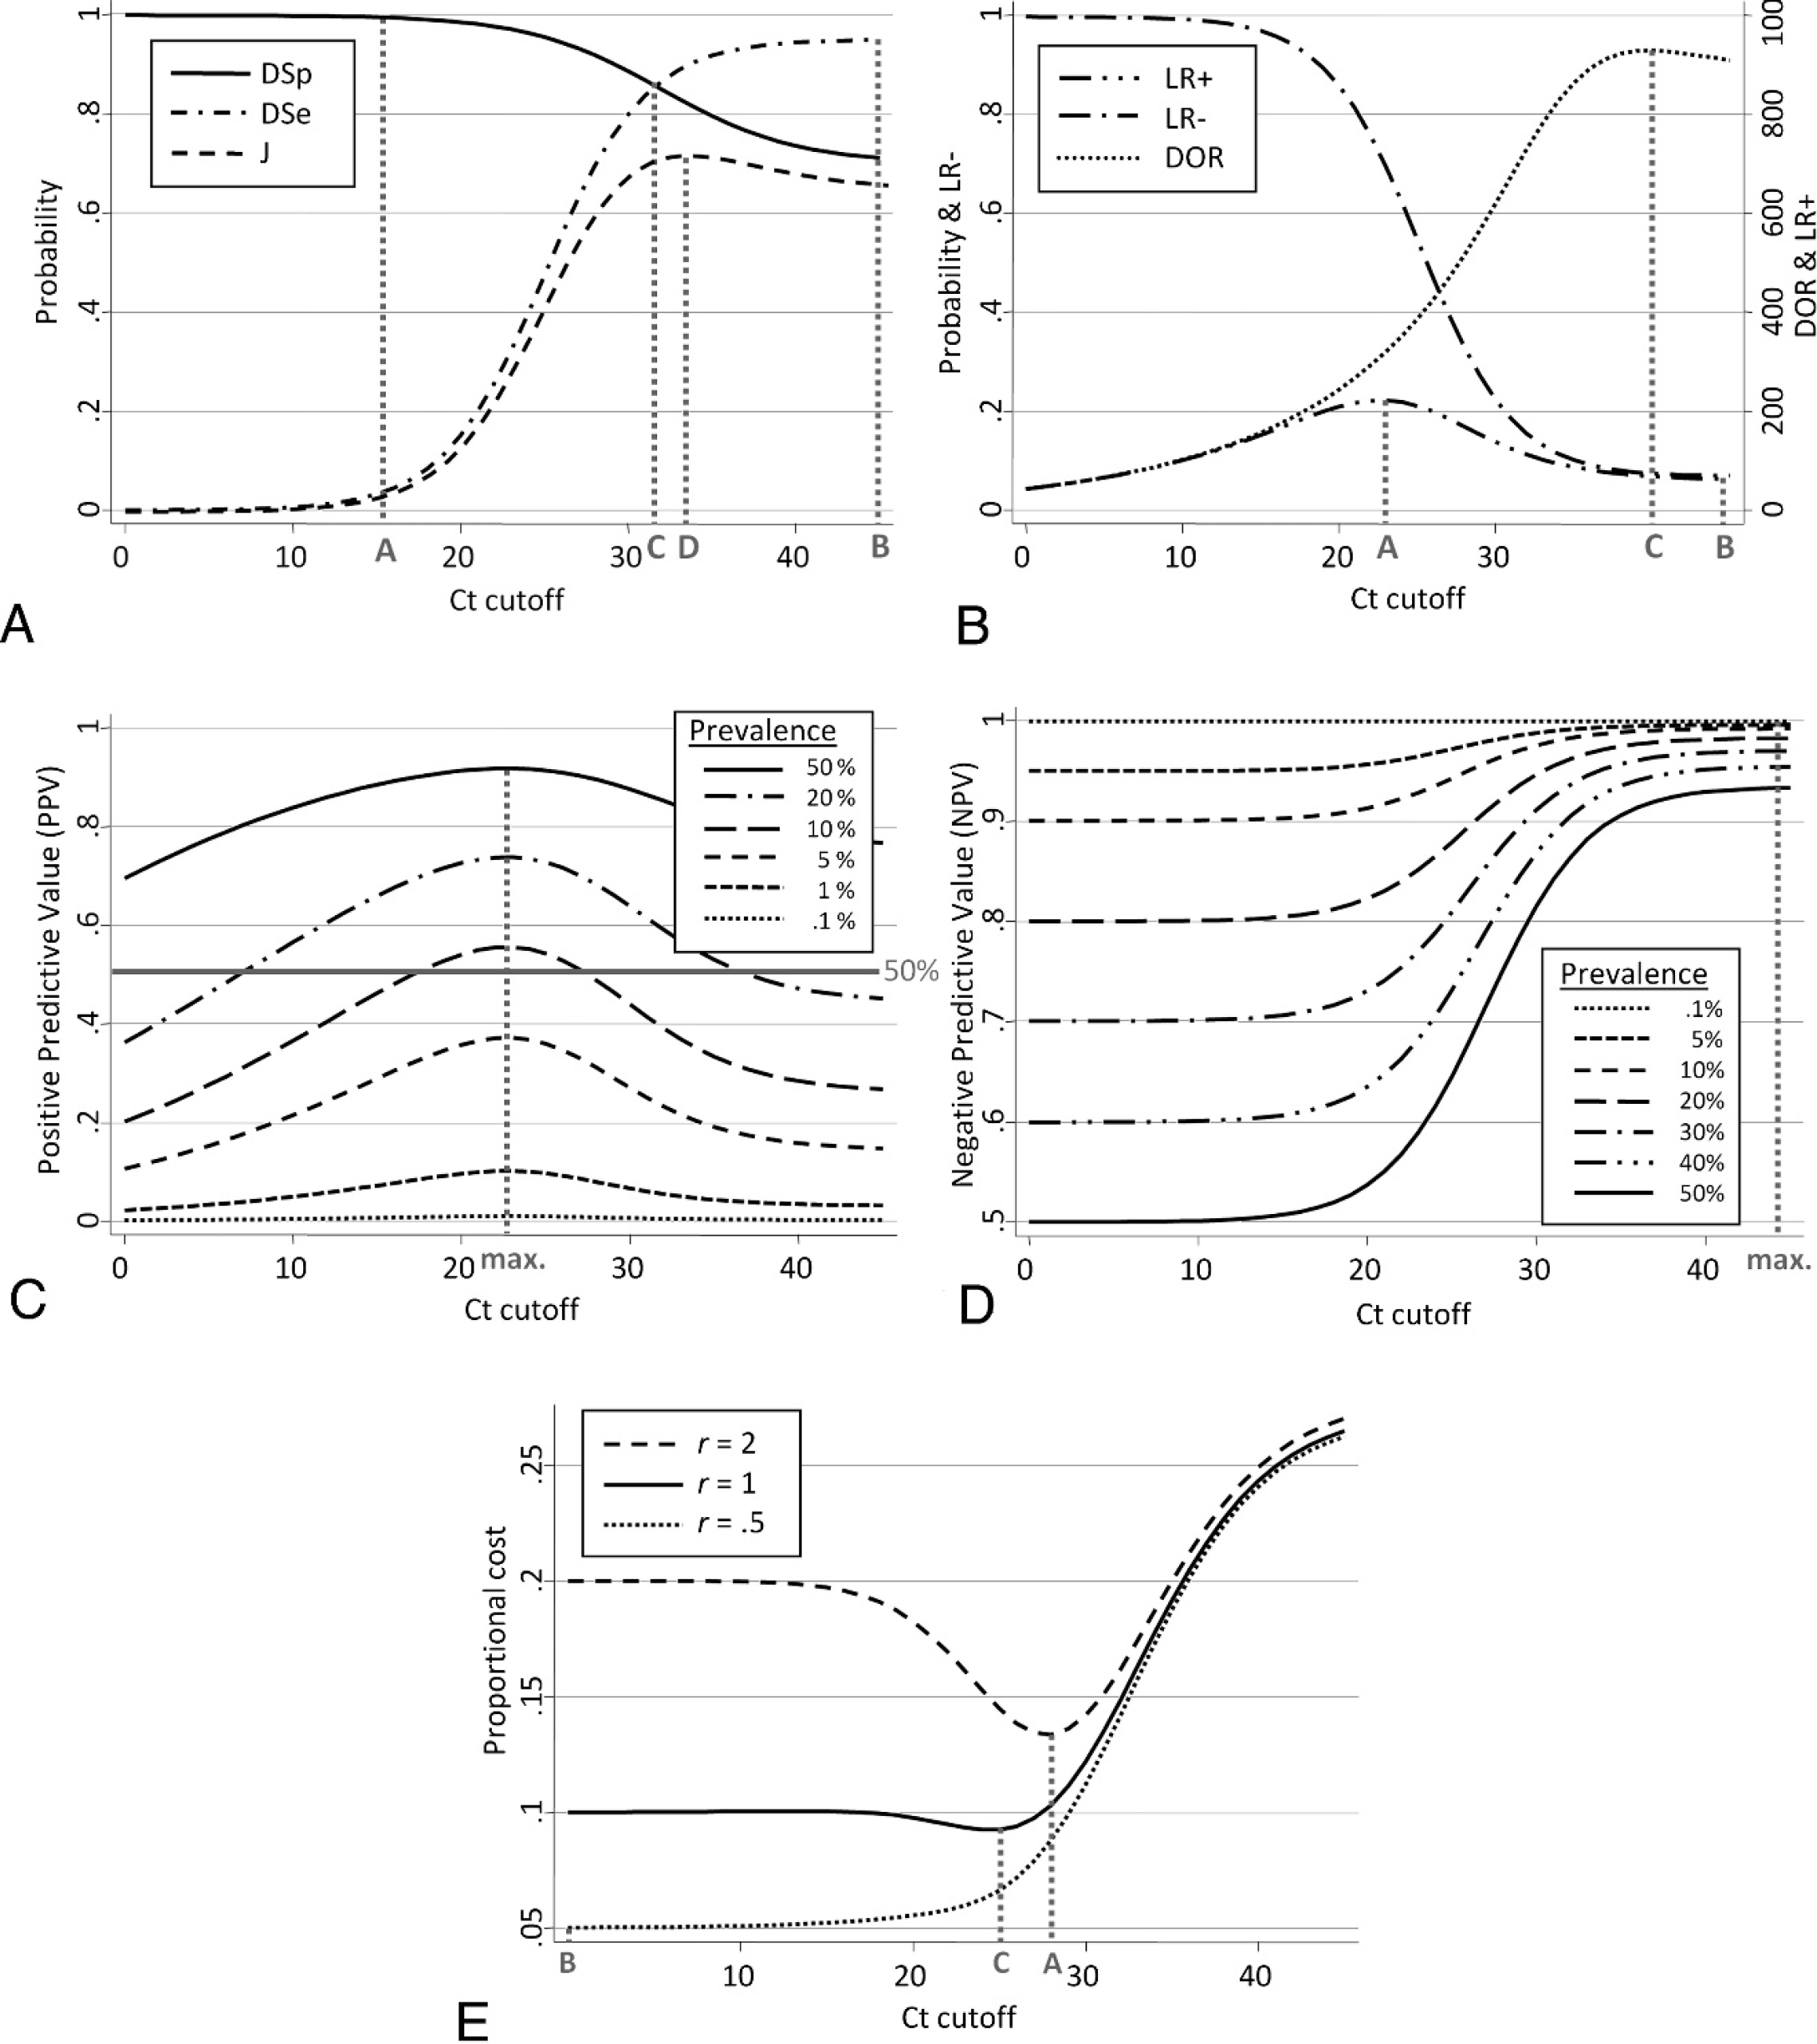
Graphical strategies to select threshold cycle (Ct) cutoff.
Selection comparing ratios of correct and incorrect misclassification. The LR+ is the ratio of the probability of correctly classified D+ individuals (proportion of true positive) to the probability of misclassified D− individuals (proportion of false-positive) given the health status. The selection of a Ct cutoff by using LR+ can follow 2 different approaches. First, a cutoff can be set such that the probability to be incorrectly classified equals the probability to be correctly classified (i.e., LR+ = 1). Therefore, when the Ct value is below this cutoff (i.e., sample deemed positive), the probability of a true positive is higher than the probability of false-positive. According to equation (4), this is translated as DSe = 1 − DSp, which is not suitable in practice, therefore, this approach is not recommended. Alternatively, a cutoff can be set such that the probability to be correctly classified compared with the probability of incorrectly classified is as large as possible. In this instance, the cutoff is selected for the maximum corresponding LR+ (Fig. 3B, line A).
A similar approach is used for LR−, whereby LR− is the ratio of the probability of misclassified D+ individuals (proportion of false-negative) to the probability correctly classified of D− individuals (proportion of true-negative) given the health status. Then, the preferred cutoff is selected where LR− is minimal (Fig. 3B, line B).
The DOR combines both LR+ and LR− and expresses how much more likely a sample is to be correctly classified than misclassified. In this instance, the Ct cutoff is selected to maximize the chance of a correct classification relative to the chance of misclassification when DOR is maximal (Fig. 3B, line C). Because of its symmetry, DOR can be interpreted either for a given test result or a given health status.
Probability of misclassification given a test result. The following probabilistic approach selects a Ct cutoff to optimize predictive values. However, predictive values depend on the assumed prevalence of D+ in the population. Similar to LRs, 2 approaches can be used. First, the cutoff is set such that, above this limit, the probability of truly classified (PPV) is lower than the probability of a falsely classified (complement of PPV, 1 – PPV) given a positive test result. This differs from the LR+ approach because the primary information is the test result and not the health status. This approach may appear as the most relevant because the true status is, in practice, unknown. The cutoff corresponds to the Ct value where PPV = 1 – PPV, which is equivalent to PPV = 50%. This approach applies equally to NPV. However, because predictive values might not cross the 50% limit, depending on the population prevalence, it is recommended instead to set the cutoff for maximum PPV or NPV (Fig. 3C and 3D, respectively). Interestingly, the maximum of PPV or NPV were not prevalence dependent. Indeed, from equations (2) and (3), it can be demonstrated that the selection of the cutoff for maximum PPV or NPV (i.e., cutoff where the derivative of PPV or NPV is nil) does not depend on the population prevalence (P), as long as DSe and DSp are not associated with prevalence.
The DOR also expresses the ratio of the odds of PPV over the odds of NPV (eq. [6]). Therefore, DOR combines both predictive values' criteria and is also independent of the prevalence. The DOR, therefore, is the parameter of choice to optimize all test operating characteristics at once regardless of the intended purpose.
An alternative to the TG-ROC graphical procedure is a statistical approach, named “mixture model analysis,” that enables the numerical selection of a cutoff in the situation where the distribution of Ct values from the target population is bimodal (mixture of the underlying distributions of D− and D+). 4 However, the distribution of Ct values is rarely expected to be bimodal because D− individuals will most likely not obtain a Ct value.
Cost of misclassification
The cost of a misclassification is a relative concept that can refer to either the economic value (e.g., treatment cost) or to the clinical and psychological consequences of a misclassification (e.g., fatal disease, treatment safety). A parameter, r, which represents the relative cost of misclassification was developed and is computed by dividing the cost of false-negative (misclassification in D+) by the cost of false-positive (misclassification in D−). 22 Misclassification costs, depending on the context, are usually different (r ≠ 1), although they can be equal (r = 1).
Differing misclassification costs (r ≠ 1). In the misclassification cost approach, the Ct cutoff will be selected such that the overall cost is minimized. The proportional cost of misclassification can be computed and monitored across Ct values by using the following equation 3 :

For instance, proportional costs were computed for a fixed prevalence (P = 10%) and by using different values of r across Ct cutoff with the TG-ROC plot (Fig. 3E). When r = 2 (cost of false-negative is twice the cost of a false-positive), the curve clearly showed a minimum (Fig. 3E, line A). When r < 1 (cost of false-negative is inferior to the cost of a false-positive), the curve reached a minimum at Ct cutoff = 0 when r = 0.5 (Fig. 3E, line B). For any given prevalence, the minimum of the proportional cost curve (Ct cutoff) moves toward the right (more sensitive test with less false-negative) as r increases (misdiagnosed D+ are becoming more costly). In addition, regardless of r, the Ct cutoff moves toward the right when prevalence increases. Indeed, with an increasing proportion of infected in the population, the proportional cost is more influenced by the probability of false-negative (eq. [7]), which decreases with higher Ct cutoff (more sensitive test).
Equal misclassification cost: efficiency (r = 1). In this particular case, the cost is the same for a false-positive and a false-negative. According to equation (7), for r = 1, the proportional cost equals P × (1 − DSe) + (1 − P) × (1 − DSp). The equation also reflects the inefficiency (Inef) of the assay (proportion of overall misclassified) in contrast to the previously defined efficiency (Ef). The cutoff is then set such that the Inef is minimized (or Ef maximized; Fig. 3E, line C).
In summary, the intended purpose of the test is critical to identify the targeted operating characteristic of the test and to select the Ct cutoff accordingly. Additional parameters, depending on the justification and the approach, may have to be considered (e.g., prevalence or cost). However, DOR represents a good compromise to optimize the average test performance for positive and negative tests without depending on prevalence.
Illustrations with an application
Background
The following example focuses on the application of epidemiologic criteria to select Ct cutoffs. A qRT-PCR test was recently developed and evaluated to detect ISAV in kidney samples of cultured Atlantic salmon in Canada (Caraguel CGB: 2010, Evaluation of factors affecting the performance of diagnostic tests for infectious salmon anaemia virus. University of Prince Edward Island, Charlottetown, PEI, Canada). The assay used was a TaqMan probe b in addition to a pair of primers to amplify a 120–base pairs fragment of the eighth RNA segment of the viral genome. Analytically, the fluorescence threshold was set by the computer software associated with the thermocycler. d The reaction included a maximum of 45 cycles so that even a low copy number of targets would be amplified and detected. The initial purpose of this test was to demonstrate freedom from infection in a defined population of cultured salmon.
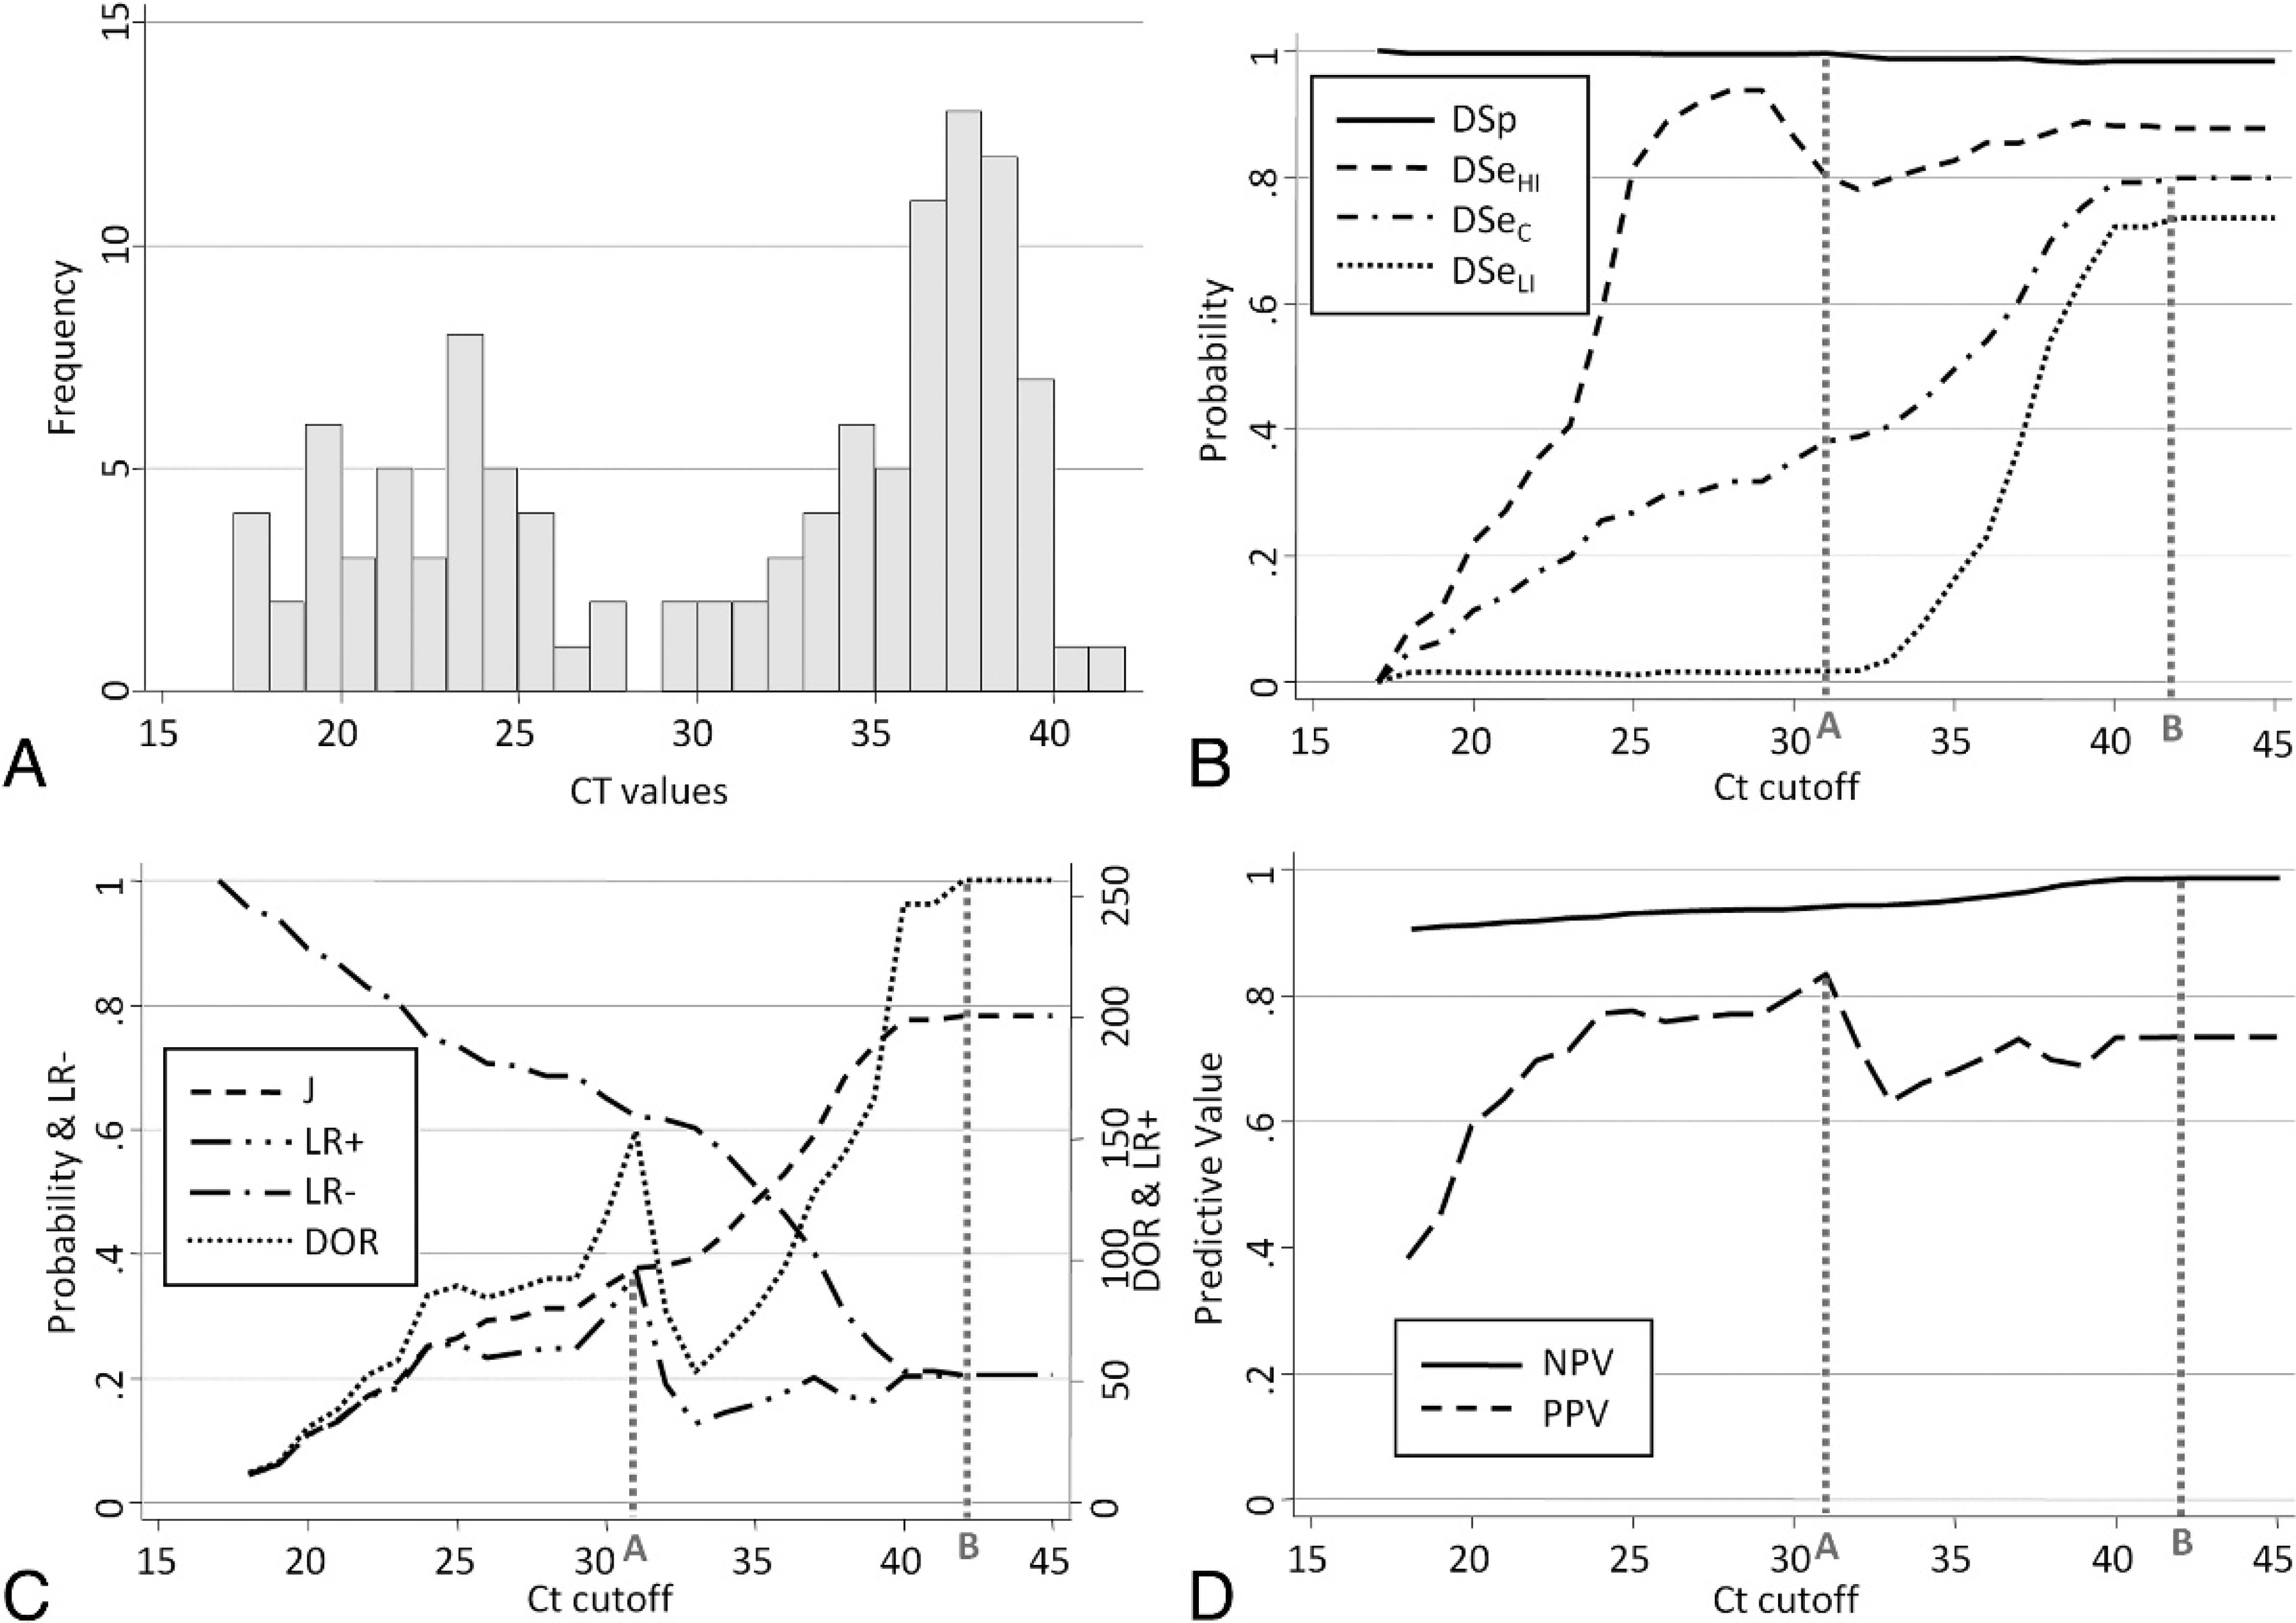
Of the 400 tested salmon, 112 provided a Ct value that ranged from 17.29 to 41.86. Interestingly, obtained Ct values had a bimodal distribution that suggested 2 subpopulations of fish that tested positive (Fig. 4A). An estimation procedure without gold standard information (i.e., a latent class model) was conducted in a Bayesian framework that involved 4 other ISAV detection assays. Without using Ct value information, the model identified 3 different classes of fish, which were hypothesized as non-, low-, and high-infected salmon (NI, LI, and HI, respectively). Therefore, different estimates of DSe (probability to test-positive) were reported for each class of infected fish (DSeLI and DSeHI); a single estimate of DSp (probability to test-negative) was reported for the class of noninfected. Three estimates (DSeLI, DSeHI, and DSp) were obtained for each possible qRT-PCR cutoff and plotted into a TG-ROC (Fig. 4B). To facilitate the presentation of this example, a combined DSe (DSeC) was generated that corresponded to weighted averages of both DSe estimates as a function of the estimated proportions of LI and HI at each cutoff (Fig. 4B) and was used throughout the example.
Probabilistic approach
According to the original objective of the test, the test purpose was the demonstration of freedom from infection in a salmon population. The main concern, therefore, is to minimize false-positives because of substantial economic consequences when a population is falsely declared infected. In this instance, 3 different approaches can be used by the test operator to select a Ct cutoff. To ease the process, a second TG-ROC was generated, which included J, DOR, and LR+ and LR− curves computed from the corresponding DSeC and DSp estimates across Ct cutoffs (Fig. 4C). First, the test operator may select the cutoff for minimum probability of false-positives among noninfected, which corresponds to the maximum DSp associated with an acceptable DSe (subjective assessment; Ct = 31; Fig. 4B, line A). Alternatively, the test operator may choose to maximize the probability of true positives among infected relative to the probability of false-positives among noninfected (i.e., maximal LR+; Ct = 31; Fig. 4C, line A). Finally, the operator may minimize the probability of false-positives among positive tests by selecting the maximum PPV (Ct = 31; Fig. 4D, line A). All 3 approaches yield the same cutoff (i.e., Ct = 31; Table 2). The objective of minimizing false-positives is compatible when seeking the confirmation of a clinical or suspect case or the eradication of infection associated with direct economic consequences associated with depopulation (Table 2). Nonetheless, the absence of evidence is not evidence of absence 18 and disregarding all results between 31 and 45 cycles may minimize false-positives but may generate some false-negatives. Therefore, a buyer from a free area may want to ensure the absence of infection in fish or products that will be shipped (i.e., OIE purpose [2]). In this instance, the operator would prioritize the minimization of false-negatives to avoid the introduction of the pathogen. This approach includes maximization of DSe to minimize the probability of false-negatives among infected (Fig. 4B, line B), or minimization of LR− to minimize the probability of false-negatives among infected relative to the probability of true-negatives among noninfected (Fig. 4C, line B), or maximization of NPV to minimize the probability of false-negatives among negative tests (Fig. 4D, line B). Regardless of the approach, identical cutoffs were identified (i.e., Ct = 42; Table 2). No Ct values were observed above 42 cycles, which resulted in an end plateau for all parameters (Fig. 4B, 4C). Believed to be representative of the full range of ISAV infection in a true salmon population, it seems unlikely that infected salmon would yield Ct above this limit, and the reaction could, therefore, be ended at 42 cycles. However, amplification efficiency may vary across runs, and a same sample could yield Ct values that differed by up to 2.3 cycles (repeatability previously estimated from duplicate runs of 40 samples), which makes 45 cycles a reasonable end point. Finally, the test operator may want to optimize the overall performance of the assay. The most intuitive approach is to select the best combination of DSe and DSp that occurs when both curves cross each other. Unfortunately, the 2 curves do not intersect, and the best combination is obtained when DSe is maximal at Ct = 42 (Fig. 4B, line A). Otherwise, the operator may select a cutoff to minimize overall misclassification regardless of the animal health status. First, by minimizing the probability of misclassification, a cutoff is selected for maximum J (Ct = 42; Fig. 4C, line B). Alternatively, a cutoff might be selected for the maximum DOR (the probability of correctly classified compared with misclassified samples; Ct = 42; Fig. 4D, line B).
Graphical summary for selection of threshold cycle (Ct) cutoff a real-time
reverse transcription polymerase chain reaction (RT-PCR) assay, detecting
Infectious salmon anemia virus (ISAV).
Summary table of diagnostic purposes, corresponding probability-based criteria, and selected threshold cycle (Ct) cutoff for real-time reverse transcription polymerase chain reaction of Infectious salmon anemia virus. *
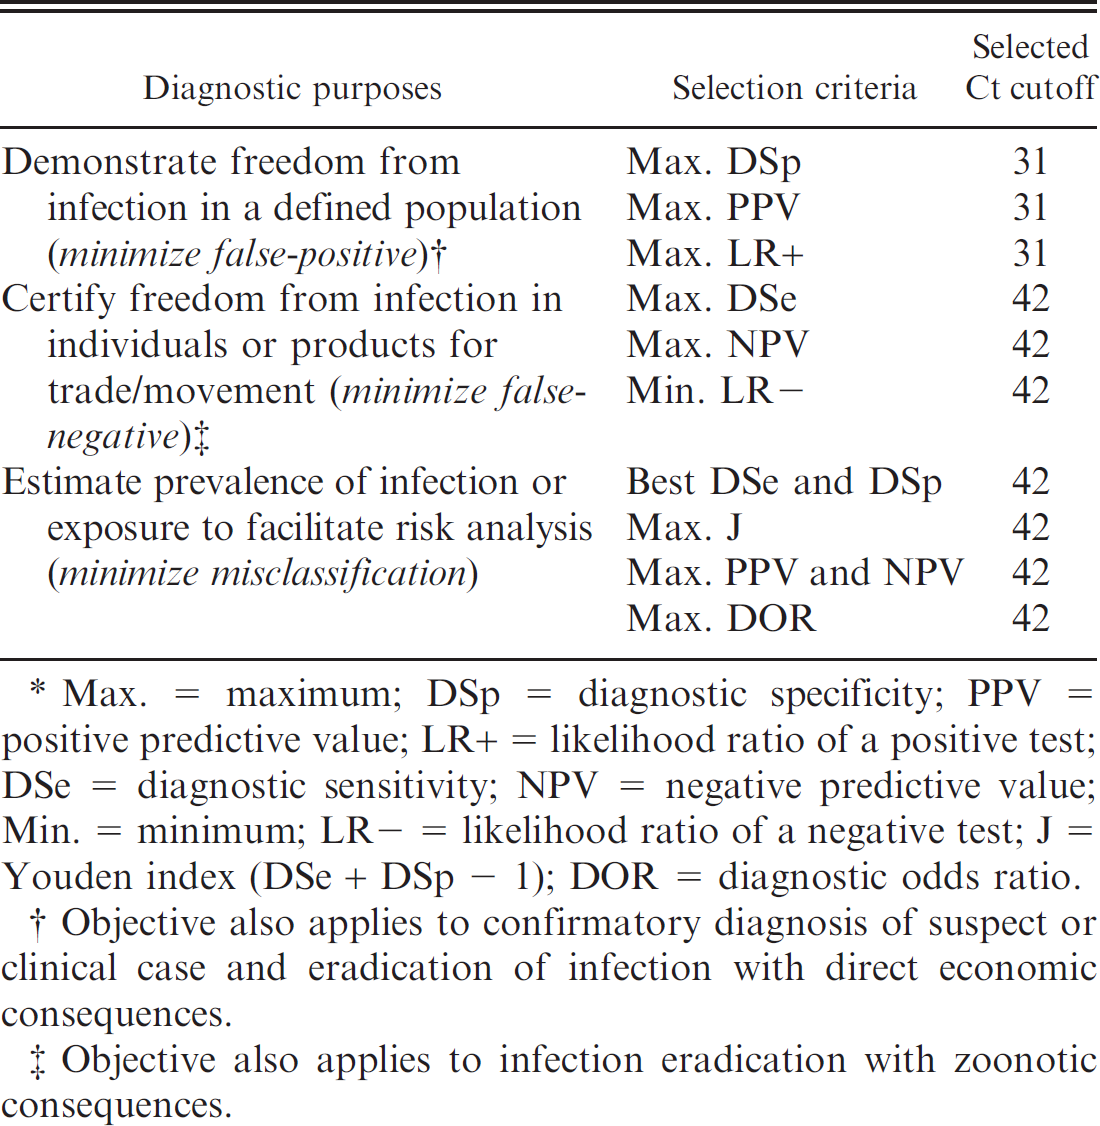
Max. = maximum; DSp = diagnostic specificity; PPV = positive predictive value; LR+ = likelihood ratio of a positive test; DSe = diagnostic sensitivity; NPV = negative predictive value; Min. = minimum; LR− = likelihood ratio of a negative test; J = Youden index (DSe + DSp − 1); DOR = diagnostic odds ratio.
Objective also applies to confirmatory diagnosis of suspect or clinical case and eradication of infection with direct economic consequences.
Objective also applies to infection eradication with zoonotic consequences.
According to the intended purpose of the diagnostic test and the selection criterion chosen, 2 different Ct cutoffs were selected for this particular qRT-PCR for ISAV (Table 2). Overall, the majority of the justifications (minimal false-negatives or overall misclassification) converged toward 42 cycles being the recommended cutoff. However, the initial objective was to limit or avoid direct economic burden associated with false-positive results, which corresponds to 31 cycles.
Cost approach
The initial objective of demonstrating freedom from infection in a population implies that the cost associated with a false-positive is more important than the cost associated with a false-negative. Therefore, the relative cost of misclassification in D+ (false-negative) compared with D− (false-positive) was set at half unity (r = 0.5). However, the reverse scenario (r = 2) and the equal cost (r = 1) were also investigated. Associated with r, DSe, and DSp, the proportional cost of misclassification also depends on prevalence (eq. [7]). Because the prevalence is expected to be fairly low when demonstrating freedom from infection, 3 low prevalences were included in the calculation: 0.17%, 1.7%, and 17% (Fig. 5). The prevalence of 1.7% was first selected to illustrate the particular case in which the proportional cost is stable across Ct cutoff (Fig. 5B). The 2 other prevalences were subsequently chosen as multiples of 1.7% to illustrate instances with lower and higher proportions of infected fish. All curves were monotonic, and none demonstrated an intermediate minimum. At 0.17% prevalence, regardless of the relative cost (r), the lowest proportional cost was obtained for the minimum observed Ct value (i.e., 17 cycles; Fig. 5A). This is explained by the fact that, at such a low prevalence, most of the positive results obtained were highly likely to be false. At 1.7% prevalence, the Inef of the test (r = 1) is stable because of a constant probability of a false test result regardless of the Ct value. This may be explained by a progressive increase of false-positives, and a reciprocal decrease of false-negatives, as the cutoff increases (Fig. 5B). The proportional cost, therefore, was higher for higher relative cost of false-positives (r = 0.5), and was lower for higher relative cost of false-negatives (r = 2; Fig. 5B). At 17% prevalence, the probability of false-negatives increased when the cutoff increased (Fig. 5C). Therefore, regardless of the relative cost, the proportional cost progressively decreased, which established the largest obtained Ct value as the cutoff (i.e., Ct = 42). At the lowest prevalence, the very low probability to sample an infected fish justifies the high probability that any obtained Ct value might be false and, therefore, more costly. Above a certain prevalence (approximately 1.7%) and according to r, it appeared economically beneficial to deem positive any salmon that yielded a Ct value (i.e., cutoff at 42 cycles).
Discussion
Although the TG-ROC plot is a convenient visual tool to select a cutoff for real-time PCR, interpreting the profiles should be done cautiously. Both DSe and DSp are strongly influenced by the distribution in the population of biological factors associated with the pathophysiology of the disease (e.g., age, sex, infection stage). 11 Therefore, the profile of DSe in the TG-ROC is expected to substantially change according to the infection stage of ISAV in a salmon (e.g., Fig. 4B). Because the distribution of infection stages (associated with viral load and Ct values) varies across populations, the TG-ROC profile is population dependent and should be validated for specific targeted populations. False-positive results that yield a Ct value might be explained, for instance, by cross contamination. 23 Therefore, the profile of the DSp curve might also change dramatically because of increased contamination pressure when handling tissues from heavily infected populations. The representativeness of specimens used to construct the TG-ROC and the strong dependence of curve profiles on the tested population should be of primary consideration when selecting a cutoff. 10 For instance, the exclusive use of experimentally challenged animals to evaluate test operating characteristics is not recommended because the specimens do not represent the full infection spectrum found in field conditions, and test accuracy is often overestimated. 25 When the true health status of an individual is not available, the methods used to estimate the TG-ROC curves may be complex and require adapting advanced statistical models. 5
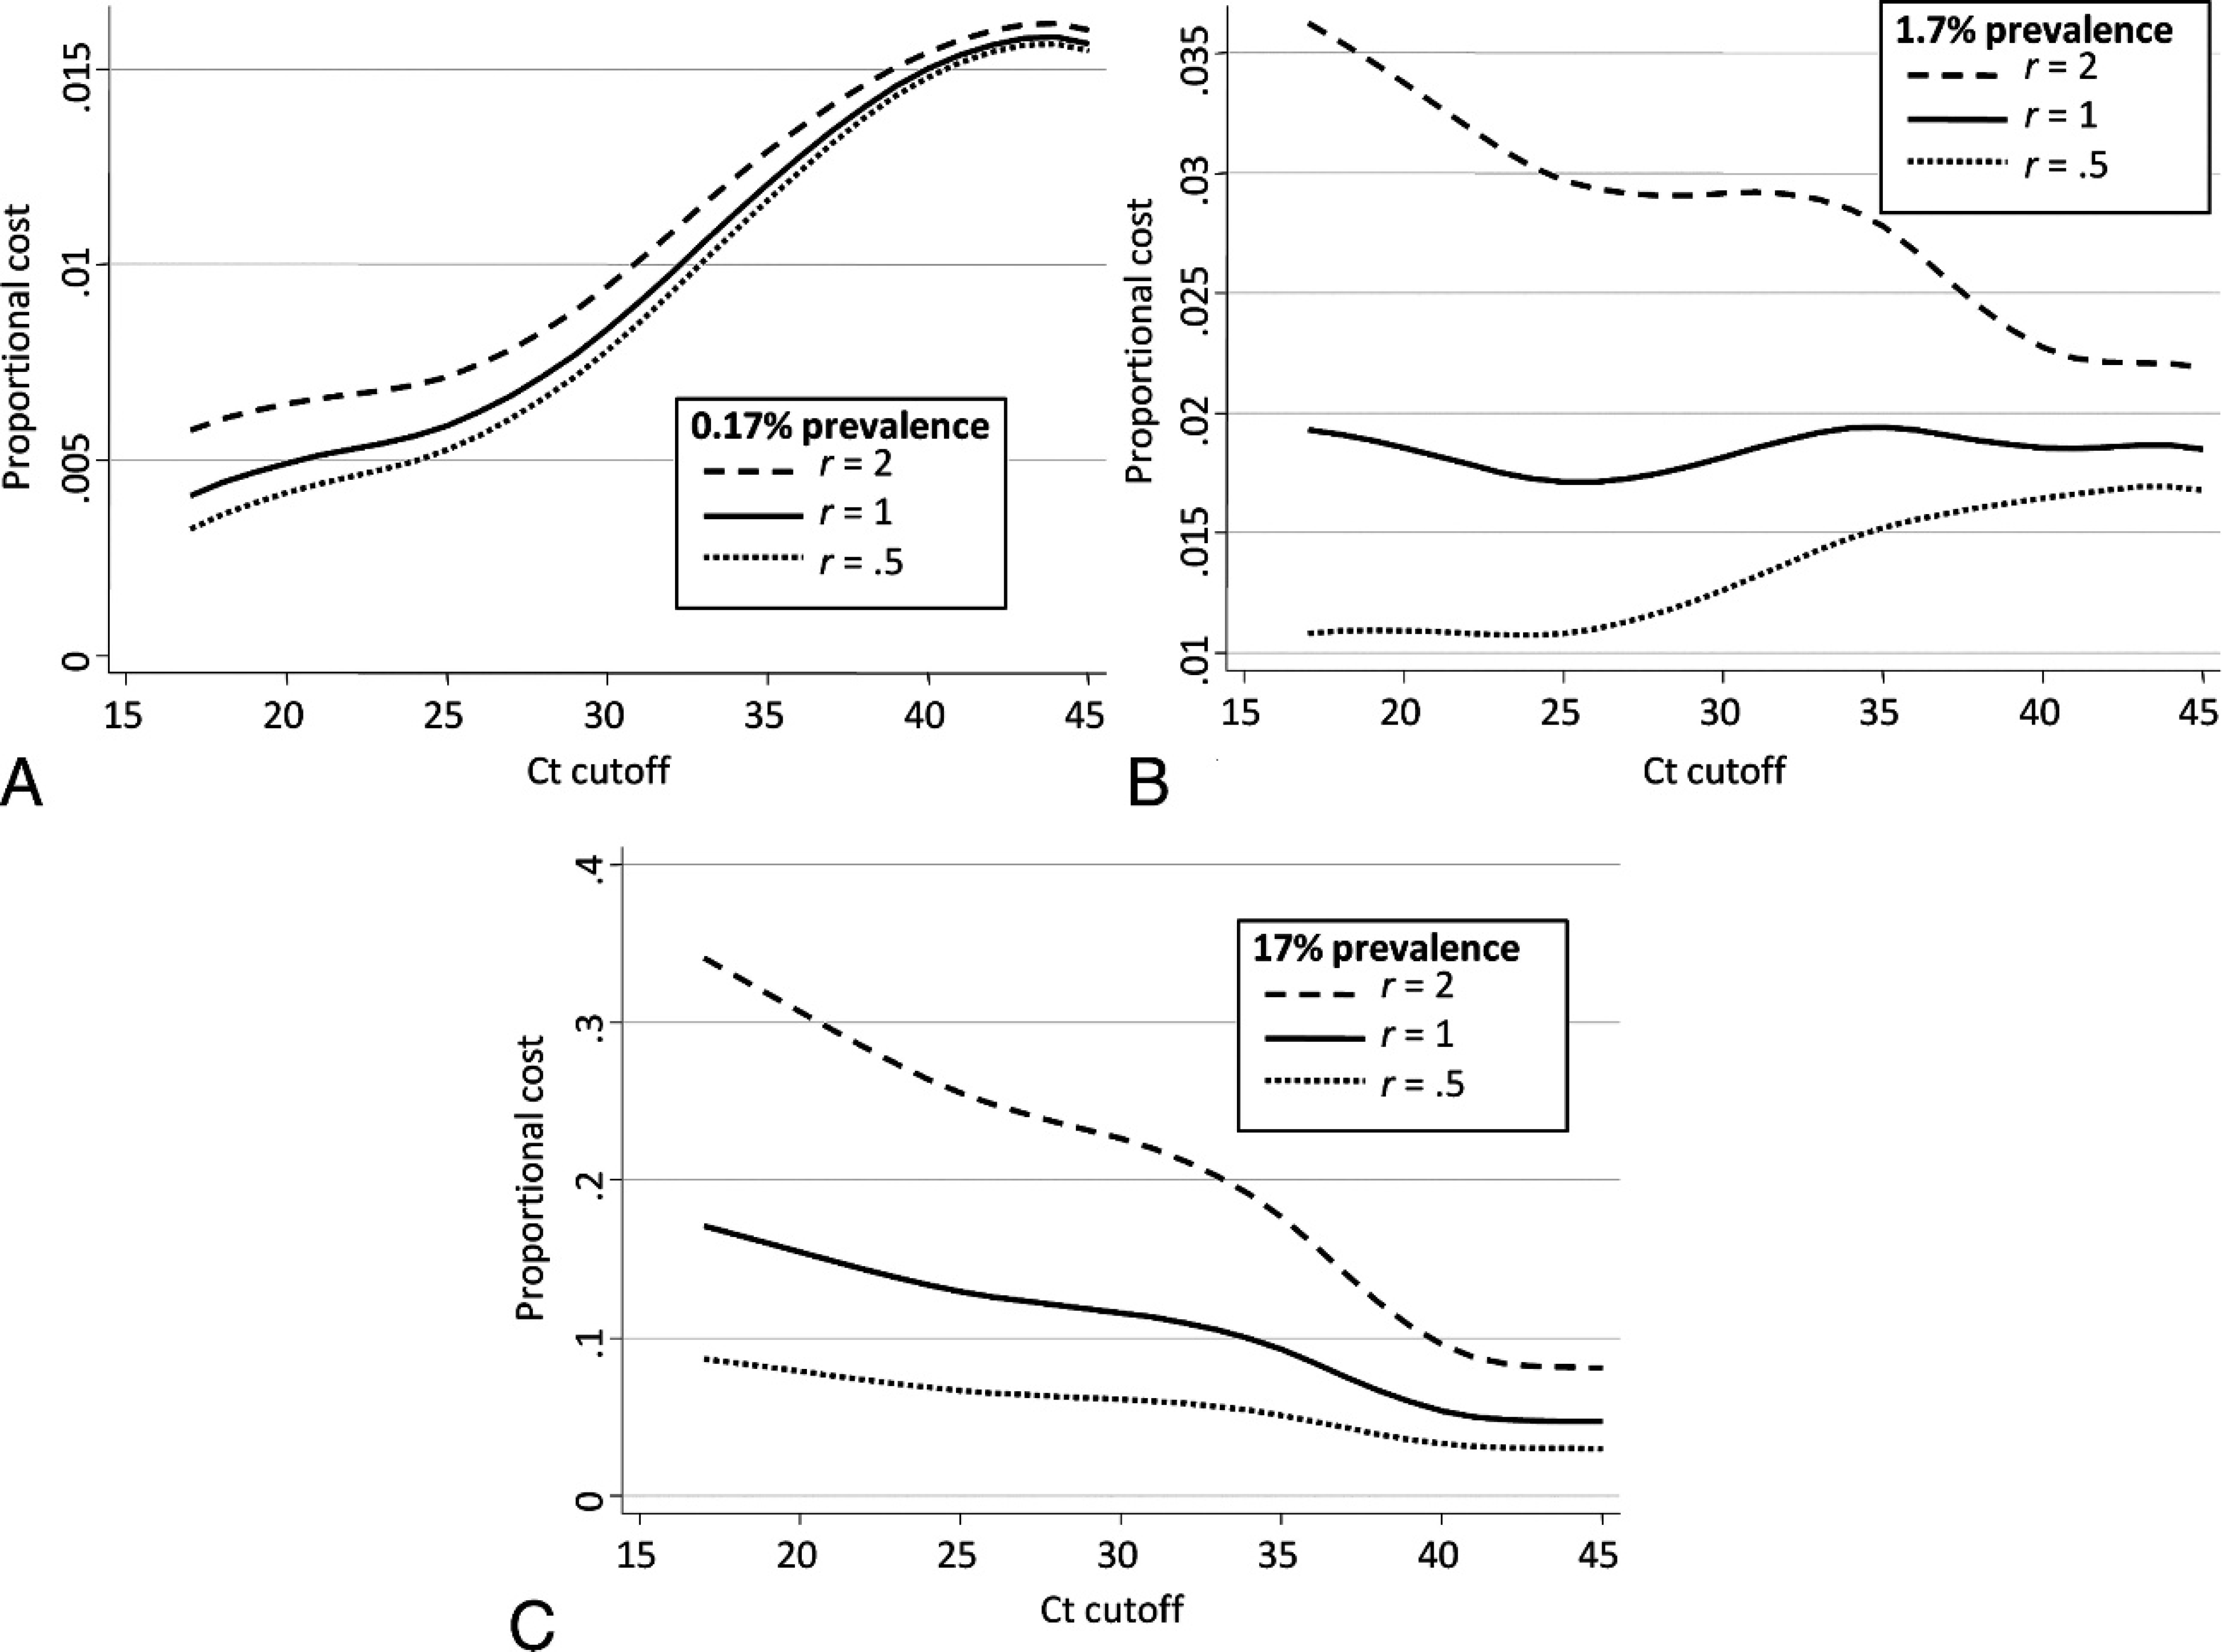
Proportional cost across threshold cycle (Ct) cutoffs of a real-time reverse
transcription polymerase chain reaction assay for Infectious salmon anemia
virus by using 3 different prevalence of infected/diseased
(
The selection of a cutoff for real-time amplification assays relies on interpretation of test results (Ct value) that can be justified based on a variety of factors according to the intended purpose of the test. Therefore, the purpose of the test and the parameters of interest should be clearly stated before initiating the TG-ROC evaluation. In general, the investigators of the current study recommend the use of NPV or PPV compared with DSe or DSp, respectively, as a better fit for real situations. To optimize overall diagnostic test performances, maximum DOR is the recommended criterion. It would be rare to observe the DSe and DSp curves intersecting for real-time amplification assays. As illustrated in the example, DSp only decreased moderately (especially with probe-based fluorophore chemistry) when DSe did not reach perfection (100%), which prevented the intersection. An easy way to predict the presence or absence of intersection is to compare the estimates of DSe and DSp when no Ct cutoff is set. If DSe is higher than DSp, then an intersection is to be expected; alternatively, if DSe is lower than DSp, then no intersection is to be expected.
Conclusions
Several analytical and epidemiologic approaches exist to justify and select a cutoff based on evidence for real-time amplification assays. Different justifications may lead to the same cutoffs. Epidemiologic cutoffs are population dependent, and their validity is directly associated with the targeted population. Cost-based determination of an optimal cutoff is likely to depend strongly on prevalence; hence, reliable prior prevalence information is needed. Although predictive values (PPV and NPV) depend on prevalence, their respective maxima rely only on the test DSe and DSp, and are fixed regardless of the prevalence. To optimize the overall diagnostic performance, it is recommended to select the Ct cutoff by using the maximum test DOR, also independent of prevalence. Even if the use of a cutoff is reasonable, it is still recommended to report the obtained Ct value to the end decision maker with complementary analytical or epidemiologic information on the test performance to justify the reclassification of the sample's test result. Finally, real-time amplification efficiency varies within and between laboratories, and a set cutoff might not be constant across runs. Therefore, it is recommended to normalize cutoffs with relative or absolute quantification approaches.
Acknowledgements
The direct and indirect support of the following agencies and companies are greatly appreciated: Atlantic Innovation Fund, New Brunswick Department of Agriculture and Aquaculture (Total Development Fund), Fisheries and Oceans Canada (Aquaculture Collaborative Research and Development Program), and many salmon farms in New Brunswick.
Footnotes
a.
SYBR® Green, Qiagen Inc., Mississauga, Ontario, Canada.
b.
TaqMan® probe, Applied Biosystems Inc., Foster City, CA.
c.
Intercooled Stata Statistical Software, release 10, StataCorp LP, College Station, TX.
d.
MxPro QPCR Software, Stratagene, Toronto, Ontario, Canada.