
Abstract
The goal of the current study was to determine the range of blood selenium concentrations in goats in New York State that were fed adequately supplemented diets. Blood samples from mature, juvenile, and neonatal goats from commercial farms, 2 dairy and 2 meat producers, were analyzed via graphite-furnace atomic absorption spectroscopy. Feed samples were analyzed by using inductively coupled argon plasma optical emission spectroscopy to confirm that dietary selenium concentrations were adequate. The ranges of blood selenium concentration obtained were 9.1–49.9 μg/dl for mature goats, 7.6–37.5 μg/dl for juveniles, and 9.7–40.7 μg/dl for neonates.
Introduction
Consequences of selenium (Se) deficiency may be subtle or inapparent in some animals and include reproductive failure and nutritional myopathy. 18 Although a major source of animal protein around the world, goats are a relatively minor agricultural species in the United States, and much is unknown about their dietary requirements.
It is often difficult to apply the concept of normal or reference values to trace minerals in livestock because of the marked variation in supplementation and other management factors on different production operations. Soils, pastures, and harvested crops from many areas, including New York State, are deficient in Se and compromise the health of unsupplemented livestock. 1,10 Veterinarians and nutritionists require more information on blood Se concentrations in healthy goats to determine the adequacy of supplementation protocols for goat herds in their care. Nutritional recommendations for Se are based on expected Se concentrations in local forages and crops, feeding systems, age, production classifications, and other management factors. Reference ranges determined from animals with known supplementation history are useful to the veterinarian, nutritionist, or producer.
The current nutritional recommendations from the National Research Council (NRC) for goats present a range of Se supplementation recommendations (0.15–1.88 mg/day), depending on age, sex, growth, pregnancy, and lactation status. 12 The U.S. Food and Drug Administration (USFDA) specified that the maximum amount of Se that can be supplemented in diets for most livestock species is 0.3 ppm (Code of Federal Regulations Title 2: 21CFR573.920). Goats were later included in this recommendation (CVM Update, April 11, 1995). Many feed manufacturers and nutritionists base their supplementation rates on the maximum allowable limits. The goal of the current study was to collect and summarize whole blood Se data for goats fed at dietary Se concentrations within the NRC recommended range.
Materials and methods
The use of animals in the present study was under the guidance and permission of the Cornell University Institutional Animal Care and Use Committee. Four commercial herds of goats fed diets calculated to be within NRC recommended ranges for Se were enrolled in the study. All the animals in these herds were being overwintered in confinement as part of routine herd management and had no access to fresh growing forages or other feed aside from that provided by the producer for 3 months preceding blood collection to ensure relatively accurate measurement of dietary Se input. Dairy goat herds A and B had approximately 130 and 120 individuals, including all ages, respectively, and breeds represented included Toggenburg, Nubian, Alpine, La Mancha, Saanen, crosses thereof, and, in herd B, Boer crosses. Meat goat herds C and D had approximately 100 and 130 individuals, respectively, and consisted of Boers in herds C and D and Boer crosses in herd D. Herds were each managed uniquely for either primarily dairy or meat production and were fed supplemental Se in addition to the Se found in the native forages in the diet. Concentrate (grain and commercially prepared products) and forage samples were collected for analysis, and dietary information was recorded for estimating Se consumption of individuals in each herd. Injectable Se supplementation was recorded when used. The herd veterinarians selected herds based on herd health and the lack of health or production problems known to be associated with Se deficiency (e.g., white muscle disease, poor production, decreased reproductive performance, or increased susceptibility to infectious disease). 5–7,13 Blood collectors noted no evidence of illness in goats that were sampled or in other goats in the herds. Goats were selected for sampling based on ease of handling and age (mature: ≥11 months old [includes pregnant and lactating does], juvenile: >1 month old and <11 months old, neonates: ≤1 month old). Not all age groups were represented in all herds. Individual goats were sampled no more than one time. Sampling from herd A was performed in January 2007, herds B and D in April of 2006, and herd C in March of 2005. Concentrate samples, with manufacturer's tags, and forage samples were collected at the time of blood collection.
Blood collection
Whole blood was collected routinely, under the supervision of a veterinarian, via jugular venipuncture into a 10-ml ethylenediamine tetra-acetic acid tube. a The blood was stored in the refrigerator (approximately 5°C) until analysis.
Blood Se analysis
Whole blood was analyzed by using a graphite-furnace atomic absorption spectrophotometer b (GFAAS) with a longitudinal Zeeman-effect background corrector. 4 Matrix-modifier solution was dispensed in 900-μl aliquots into 2-ml auto analyzer cups for each sample and calibration standard. Matrix-modifier solution is composed of a 5:4 ratio of palladium (Pd) chloride (Cl2)/nickel(ous) nitrate solution and ammonium phosphate/magnesium nitrate solution. Palladium chloride solution is prepared by using 1.667 g of PdCl2 in 1 liter of NANOpure deionized water that contains 2% HNO3. Palladium chloride/nickel(ous) nitrate solution is prepared by using 550 ml of PdCl2 solution added to 12.5 g of Ni(NO3)2*6H2O and 1 ml of Triton X, taken to 1 liter for stock solution. Ammonium phosphate/magnesium nitrate solution is prepared by using NANOpure deionized water that contains 0.2% NH4H2PO4 and 0.05% Mg(NO)3 in 1% HNO3 and 0.1% Triton X. Whole-blood samples were mixed well, pipetted into the 2-ml auto sampler cups in 100-μl aliquots, and mixed with the 900 μl of matrix modifier. The cups were then loaded into the auto sampler tray along with calibration standards of 2.50, 10.00, 25.00, and 50.00 μg/dl, which are prepared by pipetting 100 μl of intermediate standard solutions (25.0, 100.0, 250, and 500.0 ng/ml, respectively) and were mixed with 900 μl of matrix modifier in 2-ml sample cups. Samples, modifier blank, and calibration standards were dispensed in aliquots of 10 μl into the graphite furnace. All analyses were done in duplicate. Selenium peaks were read at a furnace atomization temperature of 2200°C by using a wavelength of 196 nm and slit width of 2.0 nm. The calibration curve gave a linear response across this range with a correlation coefficient of 0.999.
Feed analyses
A 500-mg subsample of finely ground feed or supplement was placed in a Teflon microwave vessel to which 5 ml of acid mixture was added. The acid mixture contained 1:1:2, concentrated hydrochloric acid, concentrated nitric acid, and deionized water. All acids used were trace metal grade. Two milliliters of 30% hydrogen peroxide solution were added to the samples. The samples were capped and heated in an analytical microwave oven c to 210°C for 15 min, then held at 210°C for 15 min. The vessels were cooled to room temperature before opening, and 2.5 ml of concentrated hydrochloric acid (trace metal grade) was added to the vessel. The vessels were capped and heated in the microwave oven to 130°C over 10 min, then held at 130°C for 20 min. The vessels were cooled to room temperature before opening and then 5 ml of 10% (w/v) sulfamic acid solution was added to the vessels and mixed. The resulting digests were transferred to centrifuge tubes and taken to 15 ml total volume with deionized water. The capped tubes were centrifuged at 800 × g for 10 min. To produce prepared working standard solutions, 5-ml aliquots of stock Se working standard solutions (0, 0.010, 0.050, 0.100, and 0.250 mg/l, all were in 1% nitric acid) were pipetted into individual centrifuge tubes. Five milliliters of 10% sulfamic acid and 2.5 ml of concentrated hydrochloric acid were added to each centrifuge tube. The solutions were taken to 15-ml volume with deionized water, capped, and mixed. Prepared standards and sample digests were analyzed via Se-hydride vapor generation and inductively coupled argon plasma optical emission spectrometry (ICP-OES). d To generate the Se-hydride vapor, standards and samples were combined at 1 ml/min with 0.5% (w/v) sodium borohydride reductant solution (which contained 0.1% [w/v] sodium hydroxide as a keeper) at 2.2 ml/min, in an in-line hydride vapor generator/separator. The resulting Se-hydride vapor was transported to the torch of the ICP-OES system by using an argon flow rate of 0.5 ml/min. The Se emission was measured at 196.027 nm in the axial viewing position for all working standard solutions and prepared sample digests. The Se content of the samples was determined by comparing the sample solution response to the standard curve. The calibration curve gave a linear response across this range with a correlation coefficient of 0.999.
It was assumed that goats consumed 100% of concentrate offered to estimate nutrient intake. Salt intake estimates were made based on the maximum Se intake from free-choice salt of 0.7 mg per head per day and the maximum concentration of Se allowable in free-choice salt of 90 ppm based on USFDA regulations (Title 2, 21 CFR 573.920). The estimated daily intake of free-choice salt was 7.78 g, and the highest Se concentration detected in a salt supplement was 0.19 ppm, thus free-choice salt could have contributed <0.002 mg of Se per day to any individual animal and was omitted from further calculations. Concentrations of Se in milk were not measured or included in total intake of nursing kids. Derivations that assumed 1 ppm Se = 1 mg/kg Se were used in calculations. Daily Se intake for each age group in each herd was determined by using the following formula: (daily Se intake in mg) = (daily concentrate in kg) × (Se content of concentrate in mg/kg) + (daily hay in kg) × (Se content of hay in mg/kg).
Dietary summary by herd. *
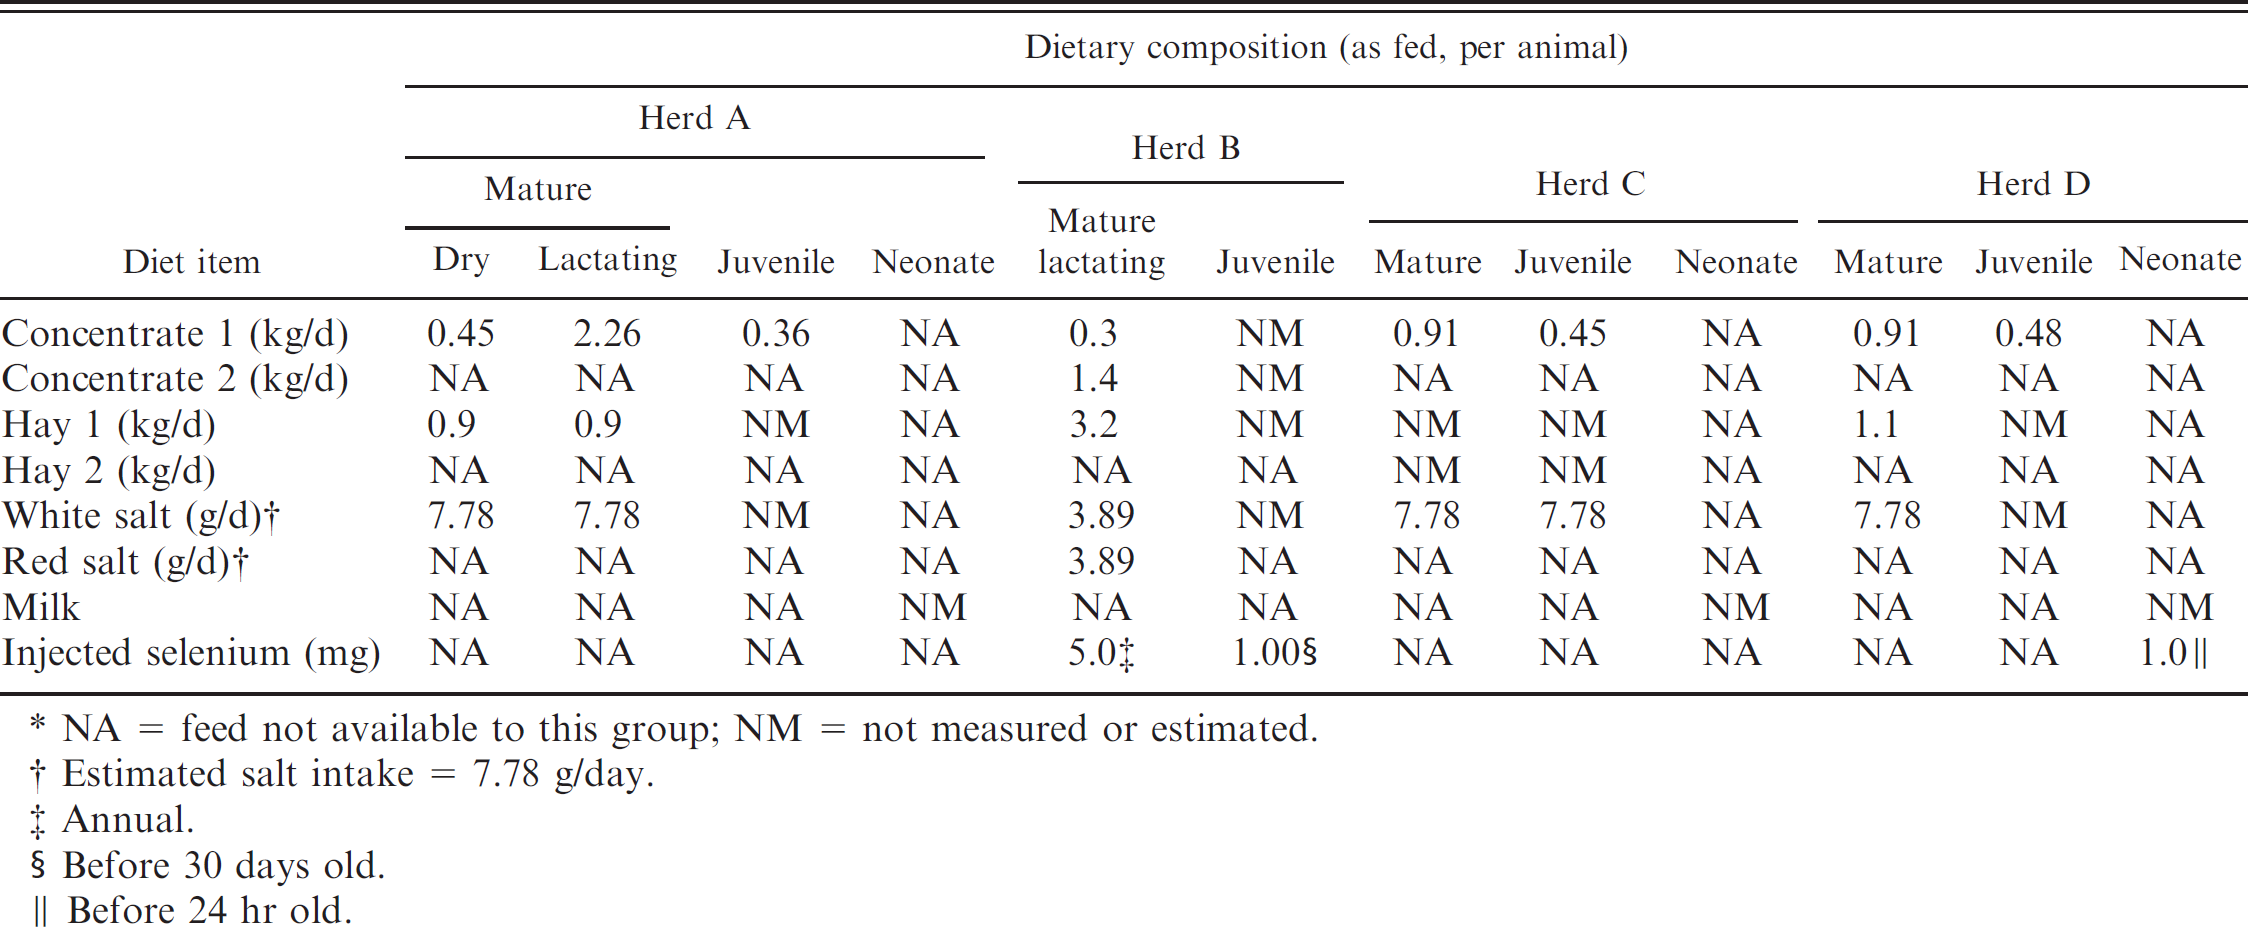
NA = feed not available to this group; NM = not measured or estimated.
Estimated salt intake = 7.78 g/day.
Annual.
Before 30 days old.
Before 24 hr old.
Data analysis
Measures of central tendency and dispersion of Se in goats enrolled in the study were computed after plotting the frequency distribution of these values on statistical soft-ware. e These measures were stratified by age (mature, juvenile, and neonate) and type of production (meat or dairy). Analysis of variance was performed to examine if differences existed among herds A–D in blood Se concentration as stratified by age and if overall age differences existed. Post hoc analysis by using the Tukey procedure was used to identify differences among the groups.
Selenium content of feed (wet weight) by herd. *
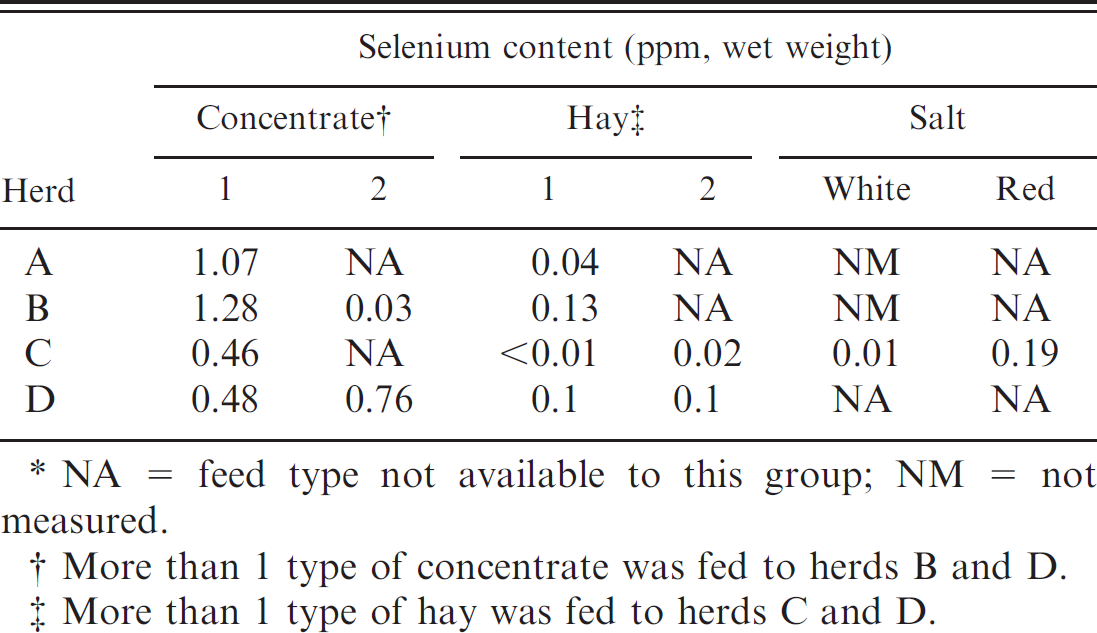
NA = feed type not available to this group; NM = not measured.
More than 1 type of concentrate was fed to herds B and D.
More than 1 type of hay was fed to herds C and D.
Estimated maximum daily selenium intake by herd based on concentrate intake. *
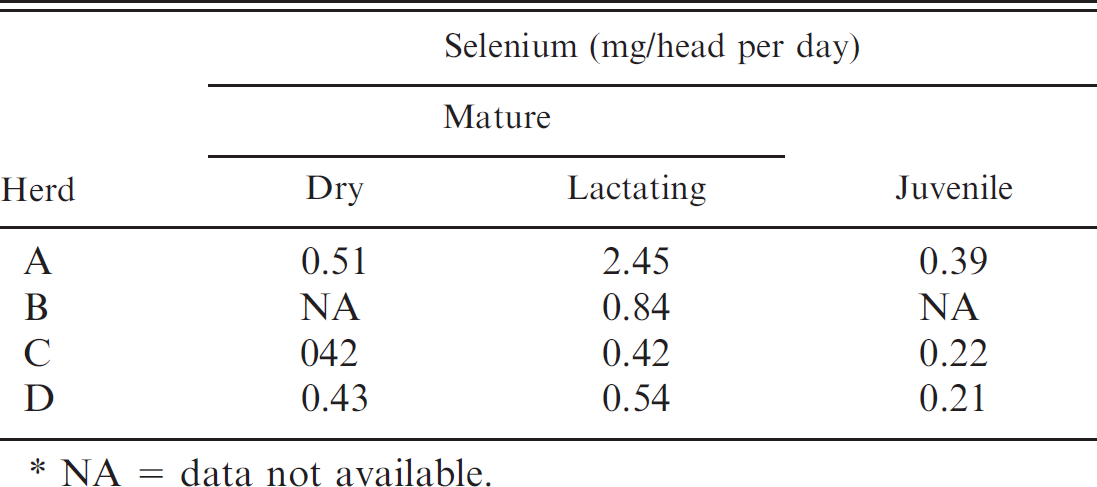
NA = data not available.
Results
Diet information is summarized in Table 1. Selenium concentrations of dietary components are listed in Table 2, and estimated Se intakes are listed in Table 3. Blood Se concentrations are summarized in Table 4. Overall, mature goats had significantly higher blood Se concentrations than juvenile and neonatal goats (P < 0.05), and juvenile and neonatal goats were not significantly different from each other. Mature goats in dairy herd A and meat herd D were significantly different from each other and from those in the other herds. Juvenile dairy goats from herd A were significantly different from those in the other herds. Juveniles from herds B and C were not significantly different from each other, and juveniles from herds C and D were not significantly different from each other. Neonates from herds A and C were significantly different from each other.
Ranges and means for blood selenium in mg/dl in mature, juvenile, and neonatal goats in herds A–D (significance is determined by P < 0.05).
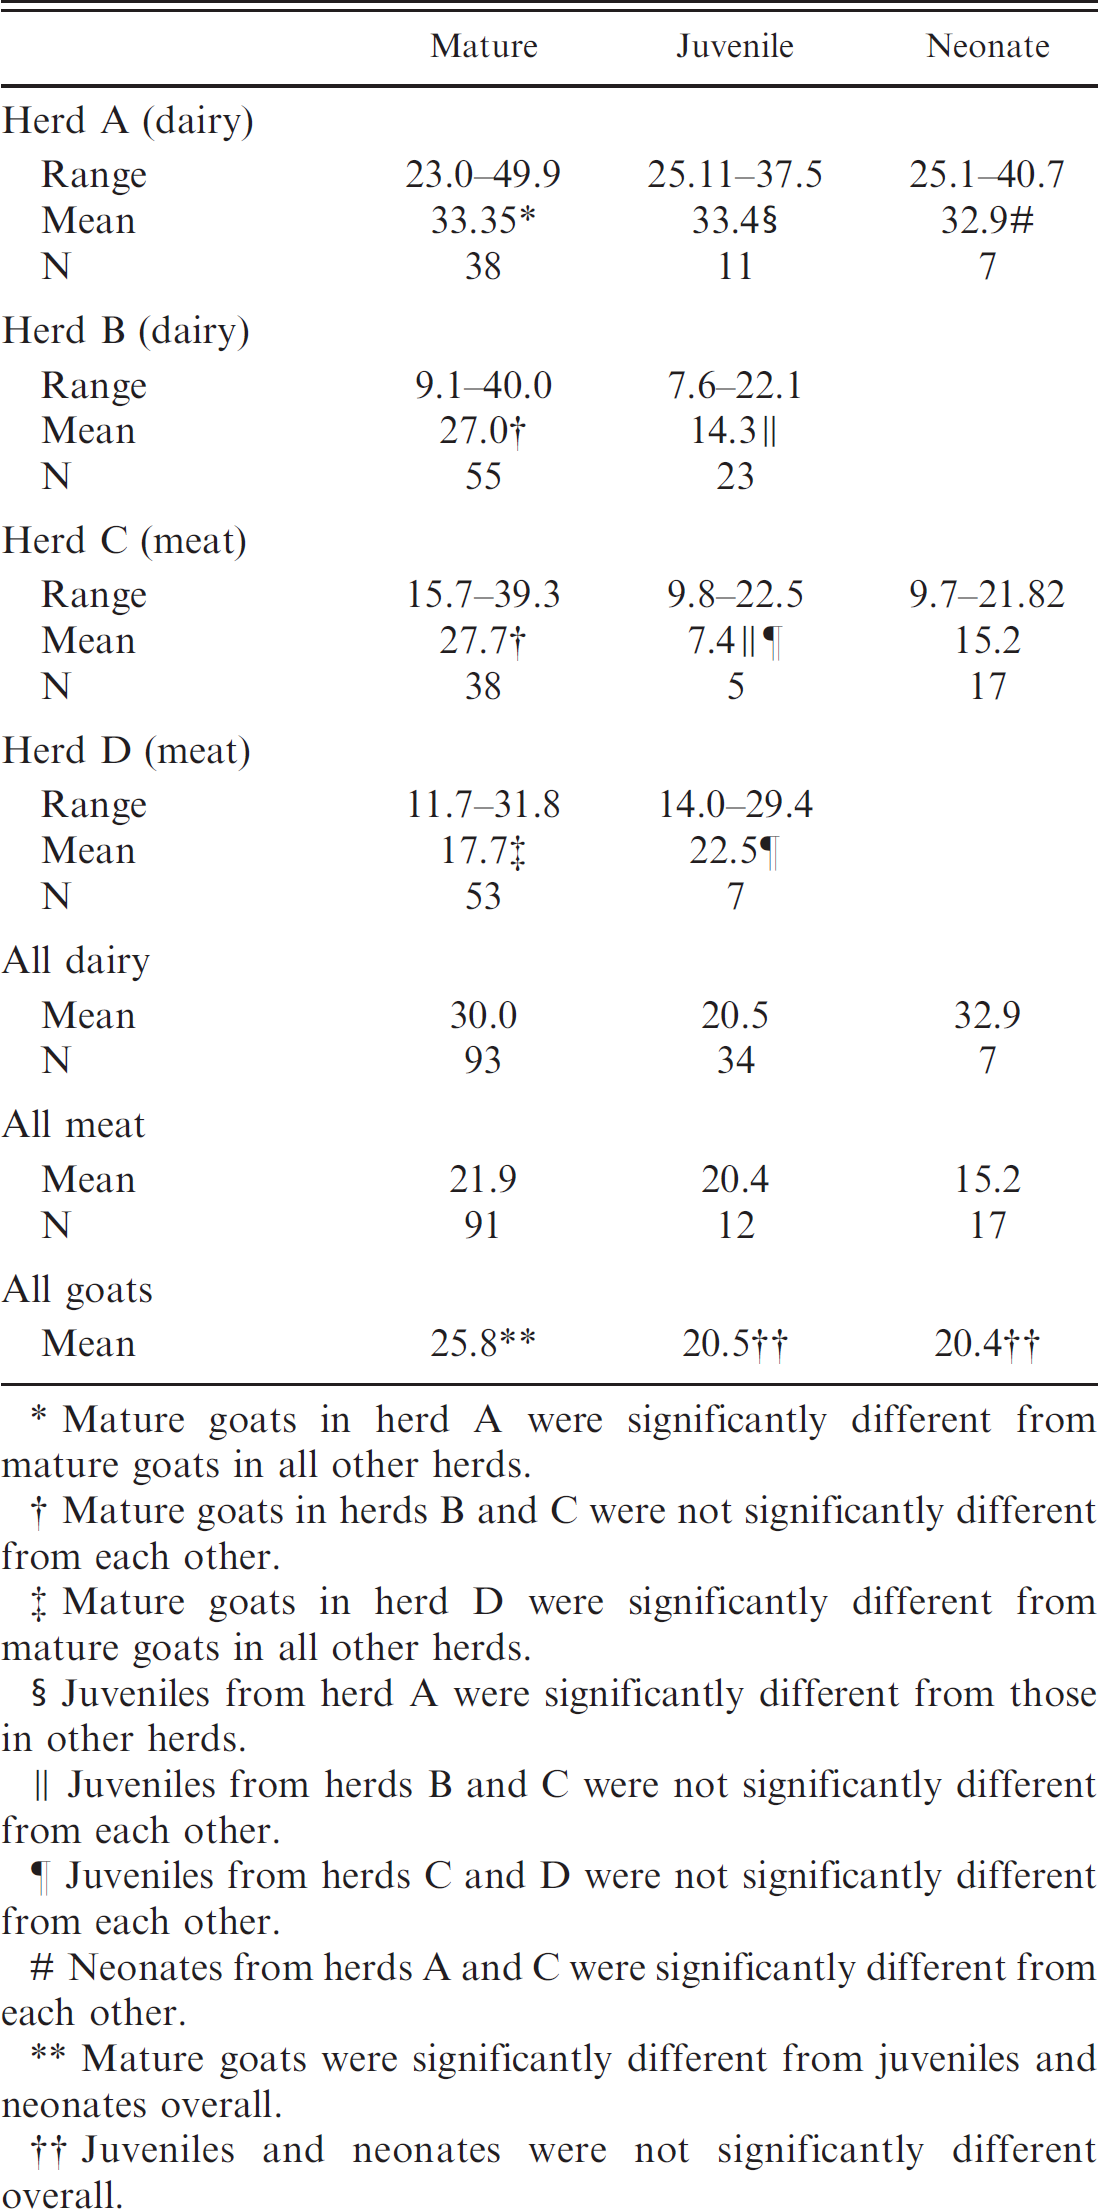
Mature goats in herd A were significantly different from mature goats in all other herds.
Mature goats in herds B and C were not significantly different from each other.
Mature goats in herd D were significantly different from mature goats in all other herds.
Juveniles from herd A were significantly different from those in other herds.
Juveniles from herds B and C were not significantly different from each other.
Juveniles from herds C and D were not significantly different from each other.
Neonates from herds A and C were significantly different from each other.
Mature goats were significantly different from juveniles and neonates overall.
Juveniles and neonates were not significantly different overall.
Discussion
Selenium supplementation is especially important for livestock in regions of the world with low soil Se content. In the United States, Se-deficient areas include the northeast and southeast regions. 1 Selenium deficiency is still frequently diagnosed in livestock in New York State by the Animal Health Diagnostic Center (unpublished data). The present study used seasonally confined goats that were on Se supplementation protocols typical for the northeastern United States. Adequacy of Se supplementation was assumed based on overall health and dietary standards documented by the NRC. 12 Although no comparison was made between lactating and dry goats among the dairy goats, most of the mature goats from herd A were dry, and the mature goats sampled in herd B were lactating at the time of sampling. Because most mature and juvenile goats retained in herds were female, sex differences were not addressed in the current study.
Forage Se concentrations of ≤0.1 ppm are associated with clinical Se deficiency in livestock. 11 An investigation in the Mexican plateau revealed that a forage value of 0.065 ppm Se produced clinical signs of deficiency in some goats but not all, with no apparent variation between rainy and dry seasons. 13,14 In the present study, forage Se values ranged from <0.01 to 0.13 ppm (Table 2).
Concentrate portions of the diet contributed to most of the Se intake. Lactating goats in herds A and B (dairy) had higher Se intakes than all mature goats in herds C and D (meat), but this did not translate to significantly different blood Se concentrations between mature dairy goats and mature meat goats. The blood Se concentrations of the neonatal dairy goats were significantly higher than those of the neonatal meat goats and may reflect the higher blood Se concentrations of the dams in herd A (compared with those in herd C) with placental transfer of Se or else neonatal access to and consumption of the supplemented diets of the mature goats.
A previous study reported average blood Se concentrations of 2.57 μg/dl in apparently healthy mature goats in The Philippines, and 0.51 μg/dl in kids <1 month of age. 15 Oral supplementation of mature does increased the average blood Se concentrations to 6.22 μg/dl in the does and 2.80 μg/dl in their kids. These values are lower than the suggested threshold concentration of 7 μg/dl and are below that at which livestock species are considered to be Se deficient. 6 None of the goats in the present study had blood Se concentrations below 7.6 μg/dl.
Results of some studies have indicated that goats are less susceptible to Se deficiency than other livestock. 15 However, a study in New Zealand determined that nutritional muscular dystrophy caused by Se deficiency was the leading cause of mortality in goat kids between the ages of 1 and 9 weeks. 2 Nutritional muscular dystrophy was rarely diagnosed in cattle or sheep in the same area of the country, but differences in supplementation were not specifically addressed. 2 Based on these studies, differences in species and location appear to play a role in the Se requirement for goats.
Studies of goats in South Africa reported relatively low blood Se concentrations. 16,17 Blood Se concentrations were 19.7 ± 3.3 μg/dl and 8.9 ± 1.9 μg/dl in goats <2 months of age and 16.9 ± 3.0 μg/dl and 13.5 ± 2.5 μg/dl in mature goats. No clinical evidence of Se deficiency was reported. Dietary Se concentrations were not reported. Blood Se concentrations in goats were intermediate between cattle (which had lower concentrations) and sheep (which had higher concentrations) on the same pasture. 16,17 The mean values for blood Se in all goats grazing Se-deficient regions of Kenya were 15.6 μg/dl and 16.4 μg/dl during the rainy and dry seasons, respectively. 9 Goats in Kenya were pastured during the day. Unlike the South African goats, goats in Kenya had higher mean blood Se concentrations than sheep, regardless of season. 9 The reason for this difference is not clear, although differences in breed, location, and overall nutritional status may contribute. 9,16,17 Blood Se concentrations in goats in the present study were higher than those reported in the African studies. This is most likely because of feeding practices that include supplementation in the current study.
The present study did not attempt to evaluate the whole-blood Se concentrations relative to the red blood cell counts (RBC) or packed cell volumes (PCV) because hemolysis was present in many samples and PCV data were missing for some samples. RBCs have higher Se concentrations than plasma or serum. 8,11 Selenium in plasma and serum reflects recent dietary exposure to Se, whereas whole-blood Se is an indicator of the long-term Se status of an individual. 8,11 Therefore, anemia may influence the concentration of Se in a blood sample. Goats may become anemic because of conditions such as parasitism, other trace mineral deficiencies, or chronic illness. Further study is needed to determine if RBC or PCV influence the blood Se concentration.
Trace mineral concentrations in blood or serum often have diagnostic significance and are used to identify nutrient imbalances in domestic animals. Reference ranges for goats are often borrowed or extrapolated from other species, for example, sheep. 12 Although 2 ppm is accepted as the maximum tolerable concentration of Se for livestock, this guideline may not be applicable to all species, according to a recent study. 3 Twenty-five wethers were exposed, for 52 weeks, to feed Se concentrations that ranged from 2 to 10 ppm. None of the sheep had observed clinical signs or histologic evidence of Se toxicosis. 3 Other studies showed different clinical effects associated with a Se-deficient diet in goats compared with sheep or cattle on the same pasture. 2
A major goal of the current study was to determine ranges for blood Se concentrations in goats that consumed Se-adequate diets. The ranges of blood Se concentration obtained in goats in the present study were 9.1–49.9 μg/dl for mature goats, 7.6–37.5 μg/dl for juveniles, and 9.7–40.7 μg/dl for neonates.
Acknowledgements
Thanks to the U.S. Department of Agriculture and the National Sheep Industry Improvement Center for helping to fund this work. Thanks also to farm owners for their patience and cooperation in gathering the data. Special thanks to the veterinary students who assisted with handling and sampling the goats.
Footnotes
a.
BD Vacutainer®, BD, Franklin Lakes, NJ.
b.
Model 800 Transversely Heated Graphite Furnace Atomic Absorption Spectrophotometer, PerkinElmer Inc., Waltham, MA.
c.
MARS, CEM Corp., Matthews, NC.
d.
Optima DV2100 Inductively Coupled Plasma-Optical Emissions Spectrometry, PerkinElmer Inc., Waltham, MA.
e.
Statistix® v8.0, Analytical Software, Tallahassee, FL.